Categories
Life Sciences Consumer Goods Materials and Chemicals Construction & Manufacturing Food and Beverages Energy and Power Semiconductor and Electronics Automotive and Transportation ICT & Media Aerospace & Defense BFSI

Int'l : +1-503-894-6022 | Toll Free : +1-800-792-5285 | help@alliedmarketresearch.com

Advanced Metering Infrastructure Market by Device (Smart Gas Meter, Smart Water Meter, Smart Electric Meter), by Service (System Integration, Meter Deployment, Program Management and Consulting), by Solution (Meter data management, Meter data analytics, Advanced Metering Infrastructure security, Meter communication infrastructure) and by End-User (Residential, Commercial, Industrial): Global Opportunity Analysis and Industry Forecast, 2023-2032

A06970

Pages: NA

Charts: NA

Tables: NA

Advanced Metering Infrastructure Market Statistics: 2027

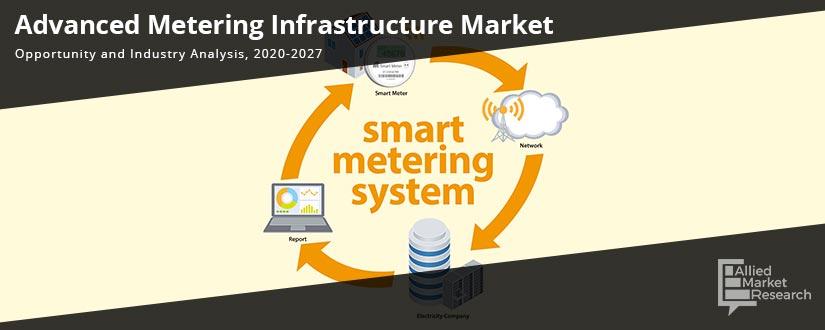
Advanced metering infrastructure is an interconnected system of communications networks, smart meters, and data processing systems that facilitates bidirectional communication between    clients and utilities. In addition, there are number of benefits provided by advanced metering infrastructure, which cannot be performed manually such as the ability to connect & disconnect service, identify & isolate outage, automatically & remotely measure electricity use, and monitor voltage. AMI handle task areas that include text messaging, external profile calculation, disconnection/reconnection, meter reading processes, and technical master data exchange. AMI also enables utilities to offer new time-based rate programs and incentives that results in reducing peak demand and also helps to manage energy consumption and reduce costs.

COVID-19 Scenario Analysis: 

  • Since the COVID-19 virus outbreak in December 2019, the disease has spread to almost 180+ countries around the globe with the World Health Organization declaring it a public health emergency. The global impacts of the corona virus disease 2019 (COVID-19) are already starting to be felt, and would significantly affect the advanced metering infrastructure in 2020. 
  • To stop the spread of corona virus, governments have implemented lockdown due to which people are forced to sit at their homes and doing work from home which will result in increase in the electric demand in the countries as advanced metering infrastructure helps to reduce the cost of metering and billing and more customer control over electricity consumption, costs, and bills it will create the demand for advanced metering infrastructure which will help to grow the advanced metering infrastructure market in the future.

Top impacting factors: Market Scenario Analysis, Trends, Drivers, and Impact Analysis

Rise in need for reducing manual meter reading & meter reading device usage is the major key factor driving the growth of the market. In addition, large-scale acceptance of advanced metering infrastructure, owing to its numerous benefits for consumers and utilities fuels the growth of the advanced metering infrastructure market. However, high cost while implementing these solutions, inadequate financial incentives for utilities, and need for improvement in customer service level restrain the advanced metering infrastructure market. Furthermore, growth in use of internet of things (IoT) and other innovative technology is expected to provide lucrative opportunity for the market.

The market trends for advanced metering infrastructure are as follow:

Recent developments in the field of advanced metering infrastructure 

Utilities are adopting these solutions for their vast benefits. For instance, in May 2020, the U.S. utility Indianapolis Power & Light selected Landis+Gyr to expand its advanced metering infrastructure program. They would deploy 350,000 smart meters and upgrade utility’s existing network to optimize data telemetry by already installed smart meters, which is expected to help them enhance the management of energy distribution, integration of renewable resources, consumer energy efficiency, and quality of service.

Asia-pacific is expected to witness the highest growth during the forecast period:

North America is expected to have the largest advanced metering infrastructure market share during the forecast period, owing to its early adoption of latest technologies along with presence of big players dealing in advance metering infrastructure solutions while Asia-pacific is expected to witness highest growth during the forecast period, owing to its digital transformation and rise in awareness about sustainable use of resources in recent times, which boosts growth of the market.

Key segments coveredKey benefits of the report:

  • This study presents the analytical depiction of the global advanced metering infrastructure market along with the current trends and future estimations to determine the imminent investment pockets.
  • The report presents information related to key drivers, restraints, and opportunities along with detailed analysis of the market share.
  • The current market is quantitatively analyzed to highlight the global advanced metering infrastructure market growth scenario.
  • Porter’s five forces analysis illustrates the potency of buyers & suppliers in the advanced metering infrastructure market. 
  • The report provides a detailed advanced metering infrastructure market analysis based on competitive intensity and how the competition will take shape in coming years. 

Key Market Segments

  • By Device
    • Smart Gas Meter
    • Smart Water Meter
    • Smart Electric Meter
  • By Service
    • System Integration
    • Meter Deployment
    • Program Management and Consulting
  • By Solution
    • Meter data management
    • Meter data analytics
    • Advanced Metering Infrastructure security
    • Meter communication infrastructure
  • By End-User
    • Residential
    • Commercial
    • Industrial
  • By Region
    • North America
      • U.S.
      • Canada
    • Europe
      • France
      • Germany
      • Italy
      • Spain
      • UK
      • Rest of Europe
    • Asia-Pacific
      • China
      • Japan
      • India
      • South Korea
      • Australia
      • Rest of Asia-Pacific
    • LAMEA
      • Latin America
      • Middle East
      • Africa


Key Market Players

  • Dynosonic
  • Sensus
  • Elster Group GmbH
  • General Electric
  • Trilliant Inc.
  • Schneider Electric SE
  • IBM Corporation
  • Tieto Corporation
  • Itron, Inc
  • Landis+Gyr
  • CHAPTER 1: INTRODUCTION

    • 1.1. Report Description

    • 1.2. Key Market Segments

    • 1.3. Key Benefits

    • 1.4. Research Methodology

      • 1.4.1. Primary Research

      • 1.4.2. Secondary Research

      • 1.4.3. Analyst Tools and Models

  • CHAPTER 2: EXECUTIVE SUMMARY

    • 2.1. CXO Perspective

  • CHAPTER 3: MARKET LANDSCAPE

    • 3.1. Market Definition and Scope

    • 3.2. Key Findings

      • 3.2.1. Top Investment Pockets

      • 3.2.2. Top Winning Strategies

    • 3.3. Porter's Five Forces Analysis

      • 3.3.1. Bargaining Power of Suppliers

      • 3.3.2. Threat of New Entrants

      • 3.3.3. Threat of Substitutes

      • 3.3.4. Competitive Rivalry

      • 3.3.5. Bargaining Power among Buyers

    • 3.5. Market Dynamics

      • 3.5.1. Drivers

      • 3.5.2. Restraints

      • 3.5.3. Opportunities

  • CHAPTER 4: ADVANCED METERING INFRASTRUCTURE MARKET, BY DEVICE

    • 4.1. Market Overview

      • 4.1.1 Market Size and Forecast, By Device

    • 4.2. Smart Gas Meter

      • 4.2.1. Key Market Trends, Growth Factors and Opportunities

      • 4.2.2. Market Size and Forecast, By Region

      • 4.2.3. Market Share Analysis, By Country

    • 4.3. Smart Water Meter

      • 4.3.1. Key Market Trends, Growth Factors and Opportunities

      • 4.3.2. Market Size and Forecast, By Region

      • 4.3.3. Market Share Analysis, By Country

    • 4.4. Smart Electric Meter

      • 4.4.1. Key Market Trends, Growth Factors and Opportunities

      • 4.4.2. Market Size and Forecast, By Region

      • 4.4.3. Market Share Analysis, By Country

  • CHAPTER 5: ADVANCED METERING INFRASTRUCTURE MARKET, BY SERVICE

    • 5.1. Market Overview

      • 5.1.1 Market Size and Forecast, By Service

    • 5.2. System Integration

      • 5.2.1. Key Market Trends, Growth Factors and Opportunities

      • 5.2.2. Market Size and Forecast, By Region

      • 5.2.3. Market Share Analysis, By Country

    • 5.3. Meter Deployment

      • 5.3.1. Key Market Trends, Growth Factors and Opportunities

      • 5.3.2. Market Size and Forecast, By Region

      • 5.3.3. Market Share Analysis, By Country

    • 5.4. Program Management And Consulting

      • 5.4.1. Key Market Trends, Growth Factors and Opportunities

      • 5.4.2. Market Size and Forecast, By Region

      • 5.4.3. Market Share Analysis, By Country

  • CHAPTER 6: ADVANCED METERING INFRASTRUCTURE MARKET, BY SOLUTION

    • 6.1. Market Overview

      • 6.1.1 Market Size and Forecast, By Solution

    • 6.2. Meter Data Management

      • 6.2.1. Key Market Trends, Growth Factors and Opportunities

      • 6.2.2. Market Size and Forecast, By Region

      • 6.2.3. Market Share Analysis, By Country

    • 6.3. Meter Data Analytics

      • 6.3.1. Key Market Trends, Growth Factors and Opportunities

      • 6.3.2. Market Size and Forecast, By Region

      • 6.3.3. Market Share Analysis, By Country

    • 6.4. Advanced Metering Infrastructure Security

      • 6.4.1. Key Market Trends, Growth Factors and Opportunities

      • 6.4.2. Market Size and Forecast, By Region

      • 6.4.3. Market Share Analysis, By Country

    • 6.5. Meter Communication Infrastructure

      • 6.5.1. Key Market Trends, Growth Factors and Opportunities

      • 6.5.2. Market Size and Forecast, By Region

      • 6.5.3. Market Share Analysis, By Country

  • CHAPTER 7: ADVANCED METERING INFRASTRUCTURE MARKET, BY END-USER

    • 7.1. Market Overview

      • 7.1.1 Market Size and Forecast, By End-user

    • 7.2. Residential

      • 7.2.1. Key Market Trends, Growth Factors and Opportunities

      • 7.2.2. Market Size and Forecast, By Region

      • 7.2.3. Market Share Analysis, By Country

    • 7.3. Commercial

      • 7.3.1. Key Market Trends, Growth Factors and Opportunities

      • 7.3.2. Market Size and Forecast, By Region

      • 7.3.3. Market Share Analysis, By Country

    • 7.4. Industrial

      • 7.4.1. Key Market Trends, Growth Factors and Opportunities

      • 7.4.2. Market Size and Forecast, By Region

      • 7.4.3. Market Share Analysis, By Country

  • CHAPTER 8: ADVANCED METERING INFRASTRUCTURE MARKET, BY REGION

    • 8.1. Market Overview

      • 8.1.1 Market Size and Forecast, By Region

    • 8.2. North America

      • 8.2.1. Key Market Trends and Opportunities

      • 8.2.2. Market Size and Forecast, By Device

      • 8.2.3. Market Size and Forecast, By Service

      • 8.2.4. Market Size and Forecast, By Solution

      • 8.2.5. Market Size and Forecast, By End-user

      • 8.2.6. Market Size and Forecast, By Country

      • 8.2.7. U.S. Advanced Metering Infrastructure Market

        • 8.2.7.1. Market Size and Forecast, By Device
        • 8.2.7.2. Market Size and Forecast, By Service
        • 8.2.7.3. Market Size and Forecast, By Solution
        • 8.2.7.4. Market Size and Forecast, By End-user
      • 8.2.8. Canada Advanced Metering Infrastructure Market

        • 8.2.8.1. Market Size and Forecast, By Device
        • 8.2.8.2. Market Size and Forecast, By Service
        • 8.2.8.3. Market Size and Forecast, By Solution
        • 8.2.8.4. Market Size and Forecast, By End-user
      • 8.2.9. Mexico Advanced Metering Infrastructure Market

        • 8.2.9.1. Market Size and Forecast, By Device
        • 8.2.9.2. Market Size and Forecast, By Service
        • 8.2.9.3. Market Size and Forecast, By Solution
        • 8.2.9.4. Market Size and Forecast, By End-user
    • 8.3. Europe

      • 8.3.1. Key Market Trends and Opportunities

      • 8.3.2. Market Size and Forecast, By Device

      • 8.3.3. Market Size and Forecast, By Service

      • 8.3.4. Market Size and Forecast, By Solution

      • 8.3.5. Market Size and Forecast, By End-user

      • 8.3.6. Market Size and Forecast, By Country

      • 8.3.7. France Advanced Metering Infrastructure Market

        • 8.3.7.1. Market Size and Forecast, By Device
        • 8.3.7.2. Market Size and Forecast, By Service
        • 8.3.7.3. Market Size and Forecast, By Solution
        • 8.3.7.4. Market Size and Forecast, By End-user
      • 8.3.8. Germany Advanced Metering Infrastructure Market

        • 8.3.8.1. Market Size and Forecast, By Device
        • 8.3.8.2. Market Size and Forecast, By Service
        • 8.3.8.3. Market Size and Forecast, By Solution
        • 8.3.8.4. Market Size and Forecast, By End-user
      • 8.3.9. Italy Advanced Metering Infrastructure Market

        • 8.3.9.1. Market Size and Forecast, By Device
        • 8.3.9.2. Market Size and Forecast, By Service
        • 8.3.9.3. Market Size and Forecast, By Solution
        • 8.3.9.4. Market Size and Forecast, By End-user
      • 8.3.10. Spain Advanced Metering Infrastructure Market

        • 8.3.10.1. Market Size and Forecast, By Device
        • 8.3.10.2. Market Size and Forecast, By Service
        • 8.3.10.3. Market Size and Forecast, By Solution
        • 8.3.10.4. Market Size and Forecast, By End-user
      • 8.3.11. UK Advanced Metering Infrastructure Market

        • 8.3.11.1. Market Size and Forecast, By Device
        • 8.3.11.2. Market Size and Forecast, By Service
        • 8.3.11.3. Market Size and Forecast, By Solution
        • 8.3.11.4. Market Size and Forecast, By End-user
      • 8.3.12. Russia Advanced Metering Infrastructure Market

        • 8.3.12.1. Market Size and Forecast, By Device
        • 8.3.12.2. Market Size and Forecast, By Service
        • 8.3.12.3. Market Size and Forecast, By Solution
        • 8.3.12.4. Market Size and Forecast, By End-user
      • 8.3.13. Rest Of Europe Advanced Metering Infrastructure Market

        • 8.3.13.1. Market Size and Forecast, By Device
        • 8.3.13.2. Market Size and Forecast, By Service
        • 8.3.13.3. Market Size and Forecast, By Solution
        • 8.3.13.4. Market Size and Forecast, By End-user
    • 8.4. Asia-Pacific

      • 8.4.1. Key Market Trends and Opportunities

      • 8.4.2. Market Size and Forecast, By Device

      • 8.4.3. Market Size and Forecast, By Service

      • 8.4.4. Market Size and Forecast, By Solution

      • 8.4.5. Market Size and Forecast, By End-user

      • 8.4.6. Market Size and Forecast, By Country

      • 8.4.7. China Advanced Metering Infrastructure Market

        • 8.4.7.1. Market Size and Forecast, By Device
        • 8.4.7.2. Market Size and Forecast, By Service
        • 8.4.7.3. Market Size and Forecast, By Solution
        • 8.4.7.4. Market Size and Forecast, By End-user
      • 8.4.8. Japan Advanced Metering Infrastructure Market

        • 8.4.8.1. Market Size and Forecast, By Device
        • 8.4.8.2. Market Size and Forecast, By Service
        • 8.4.8.3. Market Size and Forecast, By Solution
        • 8.4.8.4. Market Size and Forecast, By End-user
      • 8.4.9. India Advanced Metering Infrastructure Market

        • 8.4.9.1. Market Size and Forecast, By Device
        • 8.4.9.2. Market Size and Forecast, By Service
        • 8.4.9.3. Market Size and Forecast, By Solution
        • 8.4.9.4. Market Size and Forecast, By End-user
      • 8.4.10. South Korea Advanced Metering Infrastructure Market

        • 8.4.10.1. Market Size and Forecast, By Device
        • 8.4.10.2. Market Size and Forecast, By Service
        • 8.4.10.3. Market Size and Forecast, By Solution
        • 8.4.10.4. Market Size and Forecast, By End-user
      • 8.4.11. Australia Advanced Metering Infrastructure Market

        • 8.4.11.1. Market Size and Forecast, By Device
        • 8.4.11.2. Market Size and Forecast, By Service
        • 8.4.11.3. Market Size and Forecast, By Solution
        • 8.4.11.4. Market Size and Forecast, By End-user
      • 8.4.12. Thailand Advanced Metering Infrastructure Market

        • 8.4.12.1. Market Size and Forecast, By Device
        • 8.4.12.2. Market Size and Forecast, By Service
        • 8.4.12.3. Market Size and Forecast, By Solution
        • 8.4.12.4. Market Size and Forecast, By End-user
      • 8.4.13. Malaysia Advanced Metering Infrastructure Market

        • 8.4.13.1. Market Size and Forecast, By Device
        • 8.4.13.2. Market Size and Forecast, By Service
        • 8.4.13.3. Market Size and Forecast, By Solution
        • 8.4.13.4. Market Size and Forecast, By End-user
      • 8.4.14. Indonesia Advanced Metering Infrastructure Market

        • 8.4.14.1. Market Size and Forecast, By Device
        • 8.4.14.2. Market Size and Forecast, By Service
        • 8.4.14.3. Market Size and Forecast, By Solution
        • 8.4.14.4. Market Size and Forecast, By End-user
      • 8.4.15. Rest of Asia Pacific Advanced Metering Infrastructure Market

        • 8.4.15.1. Market Size and Forecast, By Device
        • 8.4.15.2. Market Size and Forecast, By Service
        • 8.4.15.3. Market Size and Forecast, By Solution
        • 8.4.15.4. Market Size and Forecast, By End-user
    • 8.5. LAMEA

      • 8.5.1. Key Market Trends and Opportunities

      • 8.5.2. Market Size and Forecast, By Device

      • 8.5.3. Market Size and Forecast, By Service

      • 8.5.4. Market Size and Forecast, By Solution

      • 8.5.5. Market Size and Forecast, By End-user

      • 8.5.6. Market Size and Forecast, By Country

      • 8.5.7. Brazil Advanced Metering Infrastructure Market

        • 8.5.7.1. Market Size and Forecast, By Device
        • 8.5.7.2. Market Size and Forecast, By Service
        • 8.5.7.3. Market Size and Forecast, By Solution
        • 8.5.7.4. Market Size and Forecast, By End-user
      • 8.5.8. South Africa Advanced Metering Infrastructure Market

        • 8.5.8.1. Market Size and Forecast, By Device
        • 8.5.8.2. Market Size and Forecast, By Service
        • 8.5.8.3. Market Size and Forecast, By Solution
        • 8.5.8.4. Market Size and Forecast, By End-user
      • 8.5.9. Saudi Arabia Advanced Metering Infrastructure Market

        • 8.5.9.1. Market Size and Forecast, By Device
        • 8.5.9.2. Market Size and Forecast, By Service
        • 8.5.9.3. Market Size and Forecast, By Solution
        • 8.5.9.4. Market Size and Forecast, By End-user
      • 8.5.10. UAE Advanced Metering Infrastructure Market

        • 8.5.10.1. Market Size and Forecast, By Device
        • 8.5.10.2. Market Size and Forecast, By Service
        • 8.5.10.3. Market Size and Forecast, By Solution
        • 8.5.10.4. Market Size and Forecast, By End-user
      • 8.5.11. Argentina Advanced Metering Infrastructure Market

        • 8.5.11.1. Market Size and Forecast, By Device
        • 8.5.11.2. Market Size and Forecast, By Service
        • 8.5.11.3. Market Size and Forecast, By Solution
        • 8.5.11.4. Market Size and Forecast, By End-user
      • 8.5.12. Rest of LAMEA Advanced Metering Infrastructure Market

        • 8.5.12.1. Market Size and Forecast, By Device
        • 8.5.12.2. Market Size and Forecast, By Service
        • 8.5.12.3. Market Size and Forecast, By Solution
        • 8.5.12.4. Market Size and Forecast, By End-user
  • CHAPTER 9: COMPETITIVE LANDSCAPE

    • 9.1. Introduction

    • 9.2. Top Winning Strategies

    • 9.3. Product Mapping Of Top 10 Player

    • 9.4. Competitive Dashboard

    • 9.5. Competitive Heatmap

    • 9.6. Top Player Positioning, 2024

  • CHAPTER 10: COMPANY PROFILES

    • 10.1. IBM Corporation

      • 10.1.1. Company Overview

      • 10.1.2. Key Executives

      • 10.1.3. Company Snapshot

      • 10.1.4. Operating Business Segments

      • 10.1.5. Product Portfolio

      • 10.1.6. Business Performance

      • 10.1.7. Key Strategic Moves and Developments

    • 10.2. General Electric

      • 10.2.1. Company Overview

      • 10.2.2. Key Executives

      • 10.2.3. Company Snapshot

      • 10.2.4. Operating Business Segments

      • 10.2.5. Product Portfolio

      • 10.2.6. Business Performance

      • 10.2.7. Key Strategic Moves and Developments

    • 10.3. Elster Group GmbH

      • 10.3.1. Company Overview

      • 10.3.2. Key Executives

      • 10.3.3. Company Snapshot

      • 10.3.4. Operating Business Segments

      • 10.3.5. Product Portfolio

      • 10.3.6. Business Performance

      • 10.3.7. Key Strategic Moves and Developments

    • 10.4. Schneider Electric SE

      • 10.4.1. Company Overview

      • 10.4.2. Key Executives

      • 10.4.3. Company Snapshot

      • 10.4.4. Operating Business Segments

      • 10.4.5. Product Portfolio

      • 10.4.6. Business Performance

      • 10.4.7. Key Strategic Moves and Developments

    • 10.5. Sensus

      • 10.5.1. Company Overview

      • 10.5.2. Key Executives

      • 10.5.3. Company Snapshot

      • 10.5.4. Operating Business Segments

      • 10.5.5. Product Portfolio

      • 10.5.6. Business Performance

      • 10.5.7. Key Strategic Moves and Developments

    • 10.6. Tieto Corporation

      • 10.6.1. Company Overview

      • 10.6.2. Key Executives

      • 10.6.3. Company Snapshot

      • 10.6.4. Operating Business Segments

      • 10.6.5. Product Portfolio

      • 10.6.6. Business Performance

      • 10.6.7. Key Strategic Moves and Developments

    • 10.7. Landis+Gyr

      • 10.7.1. Company Overview

      • 10.7.2. Key Executives

      • 10.7.3. Company Snapshot

      • 10.7.4. Operating Business Segments

      • 10.7.5. Product Portfolio

      • 10.7.6. Business Performance

      • 10.7.7. Key Strategic Moves and Developments

    • 10.8. Trilliant Inc.

      • 10.8.1. Company Overview

      • 10.8.2. Key Executives

      • 10.8.3. Company Snapshot

      • 10.8.4. Operating Business Segments

      • 10.8.5. Product Portfolio

      • 10.8.6. Business Performance

      • 10.8.7. Key Strategic Moves and Developments

    • 10.9. Dynosonic

      • 10.9.1. Company Overview

      • 10.9.2. Key Executives

      • 10.9.3. Company Snapshot

      • 10.9.4. Operating Business Segments

      • 10.9.5. Product Portfolio

      • 10.9.6. Business Performance

      • 10.9.7. Key Strategic Moves and Developments

    • 10.10. Itron, Inc

      • 10.10.1. Company Overview

      • 10.10.2. Key Executives

      • 10.10.3. Company Snapshot

      • 10.10.4. Operating Business Segments

      • 10.10.5. Product Portfolio

      • 10.10.6. Business Performance

      • 10.10.7. Key Strategic Moves and Developments

  • LIST OF TABLES

  • TABLE 1. GLOBAL ADVANCED METERING INFRASTRUCTURE MARKET, BY DEVICE, 2025-2033 ($MILLION)
  • TABLE 2. GLOBAL ADVANCED METERING INFRASTRUCTURE MARKET FOR SMART GAS METER, BY REGION, 2025-2033 ($MILLION)
  • TABLE 3. GLOBAL ADVANCED METERING INFRASTRUCTURE MARKET FOR SMART WATER METER, BY REGION, 2025-2033 ($MILLION)
  • TABLE 4. GLOBAL ADVANCED METERING INFRASTRUCTURE MARKET FOR SMART ELECTRIC METER, BY REGION, 2025-2033 ($MILLION)
  • TABLE 5. GLOBAL ADVANCED METERING INFRASTRUCTURE MARKET, BY SERVICE, 2025-2033 ($MILLION)
  • TABLE 6. GLOBAL ADVANCED METERING INFRASTRUCTURE MARKET FOR SYSTEM INTEGRATION, BY REGION, 2025-2033 ($MILLION)
  • TABLE 7. GLOBAL ADVANCED METERING INFRASTRUCTURE MARKET FOR METER DEPLOYMENT, BY REGION, 2025-2033 ($MILLION)
  • TABLE 8. GLOBAL ADVANCED METERING INFRASTRUCTURE MARKET FOR PROGRAM MANAGEMENT AND CONSULTING, BY REGION, 2025-2033 ($MILLION)
  • TABLE 9. GLOBAL ADVANCED METERING INFRASTRUCTURE MARKET, BY SOLUTION, 2025-2033 ($MILLION)
  • TABLE 10. GLOBAL ADVANCED METERING INFRASTRUCTURE MARKET FOR METER DATA MANAGEMENT, BY REGION, 2025-2033 ($MILLION)
  • TABLE 11. GLOBAL ADVANCED METERING INFRASTRUCTURE MARKET FOR METER DATA ANALYTICS, BY REGION, 2025-2033 ($MILLION)
  • TABLE 12. GLOBAL ADVANCED METERING INFRASTRUCTURE MARKET FOR ADVANCED METERING INFRASTRUCTURE SECURITY, BY REGION, 2025-2033 ($MILLION)
  • TABLE 13. GLOBAL ADVANCED METERING INFRASTRUCTURE MARKET FOR METER COMMUNICATION INFRASTRUCTURE, BY REGION, 2025-2033 ($MILLION)
  • TABLE 14. GLOBAL ADVANCED METERING INFRASTRUCTURE MARKET, BY END-USER, 2025-2033 ($MILLION)
  • TABLE 15. GLOBAL ADVANCED METERING INFRASTRUCTURE MARKET FOR RESIDENTIAL, BY REGION, 2025-2033 ($MILLION)
  • TABLE 16. GLOBAL ADVANCED METERING INFRASTRUCTURE MARKET FOR COMMERCIAL, BY REGION, 2025-2033 ($MILLION)
  • TABLE 17. GLOBAL ADVANCED METERING INFRASTRUCTURE MARKET FOR INDUSTRIAL, BY REGION, 2025-2033 ($MILLION)
  • TABLE 18. GLOBAL ADVANCED METERING INFRASTRUCTURE MARKET, BY REGION, 2025-2033 ($MILLION)
  • TABLE 19. NORTH AMERICA ADVANCED METERING INFRASTRUCTURE, BY REGION, 2025-2033 ($MILLION)
  • TABLE 20. NORTH AMERICA ADVANCED METERING INFRASTRUCTURE, BY DEVICE, 2025-2033 ($MILLION)
  • TABLE 21. NORTH AMERICA ADVANCED METERING INFRASTRUCTURE, BY SERVICE, 2025-2033 ($MILLION)
  • TABLE 22. NORTH AMERICA ADVANCED METERING INFRASTRUCTURE, BY SOLUTION, 2025-2033 ($MILLION)
  • TABLE 23. NORTH AMERICA ADVANCED METERING INFRASTRUCTURE, BY END-USER, 2025-2033 ($MILLION)
  • TABLE 24. U.S. ADVANCED METERING INFRASTRUCTURE, BY DEVICE, 2025-2033 ($MILLION)
  • TABLE 25. U.S. ADVANCED METERING INFRASTRUCTURE, BY SERVICE, 2025-2033 ($MILLION)
  • TABLE 26. U.S. ADVANCED METERING INFRASTRUCTURE, BY SOLUTION, 2025-2033 ($MILLION)
  • TABLE 27. U.S. ADVANCED METERING INFRASTRUCTURE, BY END-USER, 2025-2033 ($MILLION)
  • TABLE 28. CANADA ADVANCED METERING INFRASTRUCTURE, BY DEVICE, 2025-2033 ($MILLION)
  • TABLE 29. CANADA ADVANCED METERING INFRASTRUCTURE, BY SERVICE, 2025-2033 ($MILLION)
  • TABLE 30. CANADA ADVANCED METERING INFRASTRUCTURE, BY SOLUTION, 2025-2033 ($MILLION)
  • TABLE 31. CANADA ADVANCED METERING INFRASTRUCTURE, BY END-USER, 2025-2033 ($MILLION)
  • TABLE 32. MEXICO ADVANCED METERING INFRASTRUCTURE, BY DEVICE, 2025-2033 ($MILLION)
  • TABLE 33. MEXICO ADVANCED METERING INFRASTRUCTURE, BY SERVICE, 2025-2033 ($MILLION)
  • TABLE 34. MEXICO ADVANCED METERING INFRASTRUCTURE, BY SOLUTION, 2025-2033 ($MILLION)
  • TABLE 35. MEXICO ADVANCED METERING INFRASTRUCTURE, BY END-USER, 2025-2033 ($MILLION)
  • TABLE 36. EUROPE ADVANCED METERING INFRASTRUCTURE, BY REGION, 2025-2033 ($MILLION)
  • TABLE 37. EUROPE ADVANCED METERING INFRASTRUCTURE, BY DEVICE, 2025-2033 ($MILLION)
  • TABLE 38. EUROPE ADVANCED METERING INFRASTRUCTURE, BY SERVICE, 2025-2033 ($MILLION)
  • TABLE 39. EUROPE ADVANCED METERING INFRASTRUCTURE, BY SOLUTION, 2025-2033 ($MILLION)
  • TABLE 40. EUROPE ADVANCED METERING INFRASTRUCTURE, BY END-USER, 2025-2033 ($MILLION)
  • TABLE 41. FRANCE ADVANCED METERING INFRASTRUCTURE, BY DEVICE, 2025-2033 ($MILLION)
  • TABLE 42. FRANCE ADVANCED METERING INFRASTRUCTURE, BY SERVICE, 2025-2033 ($MILLION)
  • TABLE 43. FRANCE ADVANCED METERING INFRASTRUCTURE, BY SOLUTION, 2025-2033 ($MILLION)
  • TABLE 44. FRANCE ADVANCED METERING INFRASTRUCTURE, BY END-USER, 2025-2033 ($MILLION)
  • TABLE 45. GERMANY ADVANCED METERING INFRASTRUCTURE, BY DEVICE, 2025-2033 ($MILLION)
  • TABLE 46. GERMANY ADVANCED METERING INFRASTRUCTURE, BY SERVICE, 2025-2033 ($MILLION)
  • TABLE 47. GERMANY ADVANCED METERING INFRASTRUCTURE, BY SOLUTION, 2025-2033 ($MILLION)
  • TABLE 48. GERMANY ADVANCED METERING INFRASTRUCTURE, BY END-USER, 2025-2033 ($MILLION)
  • TABLE 49. ITALY ADVANCED METERING INFRASTRUCTURE, BY DEVICE, 2025-2033 ($MILLION)
  • TABLE 50. ITALY ADVANCED METERING INFRASTRUCTURE, BY SERVICE, 2025-2033 ($MILLION)
  • TABLE 51. ITALY ADVANCED METERING INFRASTRUCTURE, BY SOLUTION, 2025-2033 ($MILLION)
  • TABLE 52. ITALY ADVANCED METERING INFRASTRUCTURE, BY END-USER, 2025-2033 ($MILLION)
  • TABLE 53. SPAIN ADVANCED METERING INFRASTRUCTURE, BY DEVICE, 2025-2033 ($MILLION)
  • TABLE 54. SPAIN ADVANCED METERING INFRASTRUCTURE, BY SERVICE, 2025-2033 ($MILLION)
  • TABLE 55. SPAIN ADVANCED METERING INFRASTRUCTURE, BY SOLUTION, 2025-2033 ($MILLION)
  • TABLE 56. SPAIN ADVANCED METERING INFRASTRUCTURE, BY END-USER, 2025-2033 ($MILLION)
  • TABLE 57. UK ADVANCED METERING INFRASTRUCTURE, BY DEVICE, 2025-2033 ($MILLION)
  • TABLE 58. UK ADVANCED METERING INFRASTRUCTURE, BY SERVICE, 2025-2033 ($MILLION)
  • TABLE 59. UK ADVANCED METERING INFRASTRUCTURE, BY SOLUTION, 2025-2033 ($MILLION)
  • TABLE 60. UK ADVANCED METERING INFRASTRUCTURE, BY END-USER, 2025-2033 ($MILLION)
  • TABLE 61. RUSSIA ADVANCED METERING INFRASTRUCTURE, BY DEVICE, 2025-2033 ($MILLION)
  • TABLE 62. RUSSIA ADVANCED METERING INFRASTRUCTURE, BY SERVICE, 2025-2033 ($MILLION)
  • TABLE 63. RUSSIA ADVANCED METERING INFRASTRUCTURE, BY SOLUTION, 2025-2033 ($MILLION)
  • TABLE 64. RUSSIA ADVANCED METERING INFRASTRUCTURE, BY END-USER, 2025-2033 ($MILLION)
  • TABLE 65. REST OF EUROPE ADVANCED METERING INFRASTRUCTURE, BY DEVICE, 2025-2033 ($MILLION)
  • TABLE 66. REST OF EUROPE ADVANCED METERING INFRASTRUCTURE, BY SERVICE, 2025-2033 ($MILLION)
  • TABLE 67. REST OF EUROPE ADVANCED METERING INFRASTRUCTURE, BY SOLUTION, 2025-2033 ($MILLION)
  • TABLE 68. REST OF EUROPE ADVANCED METERING INFRASTRUCTURE, BY END-USER, 2025-2033 ($MILLION)
  • TABLE 69. ASIA-PACIFIC ADVANCED METERING INFRASTRUCTURE, BY REGION, 2025-2033 ($MILLION)
  • TABLE 70. ASIA-PACIFIC ADVANCED METERING INFRASTRUCTURE, BY DEVICE, 2025-2033 ($MILLION)
  • TABLE 71. ASIA-PACIFIC ADVANCED METERING INFRASTRUCTURE, BY SERVICE, 2025-2033 ($MILLION)
  • TABLE 72. ASIA-PACIFIC ADVANCED METERING INFRASTRUCTURE, BY SOLUTION, 2025-2033 ($MILLION)
  • TABLE 73. ASIA-PACIFIC ADVANCED METERING INFRASTRUCTURE, BY END-USER, 2025-2033 ($MILLION)
  • TABLE 74. CHINA ADVANCED METERING INFRASTRUCTURE, BY DEVICE, 2025-2033 ($MILLION)
  • TABLE 75. CHINA ADVANCED METERING INFRASTRUCTURE, BY SERVICE, 2025-2033 ($MILLION)
  • TABLE 76. CHINA ADVANCED METERING INFRASTRUCTURE, BY SOLUTION, 2025-2033 ($MILLION)
  • TABLE 77. CHINA ADVANCED METERING INFRASTRUCTURE, BY END-USER, 2025-2033 ($MILLION)
  • TABLE 78. JAPAN ADVANCED METERING INFRASTRUCTURE, BY DEVICE, 2025-2033 ($MILLION)
  • TABLE 79. JAPAN ADVANCED METERING INFRASTRUCTURE, BY SERVICE, 2025-2033 ($MILLION)
  • TABLE 80. JAPAN ADVANCED METERING INFRASTRUCTURE, BY SOLUTION, 2025-2033 ($MILLION)
  • TABLE 81. JAPAN ADVANCED METERING INFRASTRUCTURE, BY END-USER, 2025-2033 ($MILLION)
  • TABLE 82. INDIA ADVANCED METERING INFRASTRUCTURE, BY DEVICE, 2025-2033 ($MILLION)
  • TABLE 83. INDIA ADVANCED METERING INFRASTRUCTURE, BY SERVICE, 2025-2033 ($MILLION)
  • TABLE 84. INDIA ADVANCED METERING INFRASTRUCTURE, BY SOLUTION, 2025-2033 ($MILLION)
  • TABLE 85. INDIA ADVANCED METERING INFRASTRUCTURE, BY END-USER, 2025-2033 ($MILLION)
  • TABLE 86. SOUTH KOREA ADVANCED METERING INFRASTRUCTURE, BY DEVICE, 2025-2033 ($MILLION)
  • TABLE 87. SOUTH KOREA ADVANCED METERING INFRASTRUCTURE, BY SERVICE, 2025-2033 ($MILLION)
  • TABLE 88. SOUTH KOREA ADVANCED METERING INFRASTRUCTURE, BY SOLUTION, 2025-2033 ($MILLION)
  • TABLE 89. SOUTH KOREA ADVANCED METERING INFRASTRUCTURE, BY END-USER, 2025-2033 ($MILLION)
  • TABLE 90. AUSTRALIA ADVANCED METERING INFRASTRUCTURE, BY DEVICE, 2025-2033 ($MILLION)
  • TABLE 91. AUSTRALIA ADVANCED METERING INFRASTRUCTURE, BY SERVICE, 2025-2033 ($MILLION)
  • TABLE 92. AUSTRALIA ADVANCED METERING INFRASTRUCTURE, BY SOLUTION, 2025-2033 ($MILLION)
  • TABLE 93. AUSTRALIA ADVANCED METERING INFRASTRUCTURE, BY END-USER, 2025-2033 ($MILLION)
  • TABLE 94. THAILAND ADVANCED METERING INFRASTRUCTURE, BY DEVICE, 2025-2033 ($MILLION)
  • TABLE 95. THAILAND ADVANCED METERING INFRASTRUCTURE, BY SERVICE, 2025-2033 ($MILLION)
  • TABLE 96. THAILAND ADVANCED METERING INFRASTRUCTURE, BY SOLUTION, 2025-2033 ($MILLION)
  • TABLE 97. THAILAND ADVANCED METERING INFRASTRUCTURE, BY END-USER, 2025-2033 ($MILLION)
  • TABLE 98. MALAYSIA ADVANCED METERING INFRASTRUCTURE, BY DEVICE, 2025-2033 ($MILLION)
  • TABLE 99. MALAYSIA ADVANCED METERING INFRASTRUCTURE, BY SERVICE, 2025-2033 ($MILLION)
  • TABLE 100. MALAYSIA ADVANCED METERING INFRASTRUCTURE, BY SOLUTION, 2025-2033 ($MILLION)
  • TABLE 101. MALAYSIA ADVANCED METERING INFRASTRUCTURE, BY END-USER, 2025-2033 ($MILLION)
  • TABLE 102. INDONESIA ADVANCED METERING INFRASTRUCTURE, BY DEVICE, 2025-2033 ($MILLION)
  • TABLE 103. INDONESIA ADVANCED METERING INFRASTRUCTURE, BY SERVICE, 2025-2033 ($MILLION)
  • TABLE 104. INDONESIA ADVANCED METERING INFRASTRUCTURE, BY SOLUTION, 2025-2033 ($MILLION)
  • TABLE 105. INDONESIA ADVANCED METERING INFRASTRUCTURE, BY END-USER, 2025-2033 ($MILLION)
  • TABLE 106. REST OF ASIA PACIFIC ADVANCED METERING INFRASTRUCTURE, BY DEVICE, 2025-2033 ($MILLION)
  • TABLE 107. REST OF ASIA PACIFIC ADVANCED METERING INFRASTRUCTURE, BY SERVICE, 2025-2033 ($MILLION)
  • TABLE 108. REST OF ASIA PACIFIC ADVANCED METERING INFRASTRUCTURE, BY SOLUTION, 2025-2033 ($MILLION)
  • TABLE 109. REST OF ASIA PACIFIC ADVANCED METERING INFRASTRUCTURE, BY END-USER, 2025-2033 ($MILLION)
  • TABLE 110. LAMEA ADVANCED METERING INFRASTRUCTURE, BY REGION, 2025-2033 ($MILLION)
  • TABLE 111. LAMEA ADVANCED METERING INFRASTRUCTURE, BY DEVICE, 2025-2033 ($MILLION)
  • TABLE 112. LAMEA ADVANCED METERING INFRASTRUCTURE, BY SERVICE, 2025-2033 ($MILLION)
  • TABLE 113. LAMEA ADVANCED METERING INFRASTRUCTURE, BY SOLUTION, 2025-2033 ($MILLION)
  • TABLE 114. LAMEA ADVANCED METERING INFRASTRUCTURE, BY END-USER, 2025-2033 ($MILLION)
  • TABLE 115. BRAZIL ADVANCED METERING INFRASTRUCTURE, BY DEVICE, 2025-2033 ($MILLION)
  • TABLE 116. BRAZIL ADVANCED METERING INFRASTRUCTURE, BY SERVICE, 2025-2033 ($MILLION)
  • TABLE 117. BRAZIL ADVANCED METERING INFRASTRUCTURE, BY SOLUTION, 2025-2033 ($MILLION)
  • TABLE 118. BRAZIL ADVANCED METERING INFRASTRUCTURE, BY END-USER, 2025-2033 ($MILLION)
  • TABLE 119. SOUTH AFRICA ADVANCED METERING INFRASTRUCTURE, BY DEVICE, 2025-2033 ($MILLION)
  • TABLE 120. SOUTH AFRICA ADVANCED METERING INFRASTRUCTURE, BY SERVICE, 2025-2033 ($MILLION)
  • TABLE 121. SOUTH AFRICA ADVANCED METERING INFRASTRUCTURE, BY SOLUTION, 2025-2033 ($MILLION)
  • TABLE 122. SOUTH AFRICA ADVANCED METERING INFRASTRUCTURE, BY END-USER, 2025-2033 ($MILLION)
  • TABLE 123. SAUDI ARABIA ADVANCED METERING INFRASTRUCTURE, BY DEVICE, 2025-2033 ($MILLION)
  • TABLE 124. SAUDI ARABIA ADVANCED METERING INFRASTRUCTURE, BY SERVICE, 2025-2033 ($MILLION)
  • TABLE 125. SAUDI ARABIA ADVANCED METERING INFRASTRUCTURE, BY SOLUTION, 2025-2033 ($MILLION)
  • TABLE 126. SAUDI ARABIA ADVANCED METERING INFRASTRUCTURE, BY END-USER, 2025-2033 ($MILLION)
  • TABLE 127. UAE ADVANCED METERING INFRASTRUCTURE, BY DEVICE, 2025-2033 ($MILLION)
  • TABLE 128. UAE ADVANCED METERING INFRASTRUCTURE, BY SERVICE, 2025-2033 ($MILLION)
  • TABLE 129. UAE ADVANCED METERING INFRASTRUCTURE, BY SOLUTION, 2025-2033 ($MILLION)
  • TABLE 130. UAE ADVANCED METERING INFRASTRUCTURE, BY END-USER, 2025-2033 ($MILLION)
  • TABLE 131. ARGENTINA ADVANCED METERING INFRASTRUCTURE, BY DEVICE, 2025-2033 ($MILLION)
  • TABLE 132. ARGENTINA ADVANCED METERING INFRASTRUCTURE, BY SERVICE, 2025-2033 ($MILLION)
  • TABLE 133. ARGENTINA ADVANCED METERING INFRASTRUCTURE, BY SOLUTION, 2025-2033 ($MILLION)
  • TABLE 134. ARGENTINA ADVANCED METERING INFRASTRUCTURE, BY END-USER, 2025-2033 ($MILLION)
  • TABLE 135. REST OF LAMEA ADVANCED METERING INFRASTRUCTURE, BY DEVICE, 2025-2033 ($MILLION)
  • TABLE 136. REST OF LAMEA ADVANCED METERING INFRASTRUCTURE, BY SERVICE, 2025-2033 ($MILLION)
  • TABLE 137. REST OF LAMEA ADVANCED METERING INFRASTRUCTURE, BY SOLUTION, 2025-2033 ($MILLION)
  • TABLE 138. REST OF LAMEA ADVANCED METERING INFRASTRUCTURE, BY END-USER, 2025-2033 ($MILLION)
  • TABLE 139. IBM CORPORATION: KEY EXECUTIVES
  • TABLE 140. IBM CORPORATION: COMPANY SNAPSHOT
  • TABLE 141. IBM CORPORATION: OPERATING SEGMENTS
  • TABLE 142. IBM CORPORATION: PRODUCT PORTFOLIO
  • TABLE 143. IBM CORPORATION: KEY STRATEGIC MOVES AND DEVELOPMENTS
  • TABLE 144. GENERAL ELECTRIC: KEY EXECUTIVES
  • TABLE 145. GENERAL ELECTRIC: COMPANY SNAPSHOT
  • TABLE 146. GENERAL ELECTRIC: OPERATING SEGMENTS
  • TABLE 147. GENERAL ELECTRIC: PRODUCT PORTFOLIO
  • TABLE 148. GENERAL ELECTRIC: KEY STRATEGIC MOVES AND DEVELOPMENTS
  • TABLE 149. ELSTER GROUP GMBH: KEY EXECUTIVES
  • TABLE 150. ELSTER GROUP GMBH: COMPANY SNAPSHOT
  • TABLE 151. ELSTER GROUP GMBH: OPERATING SEGMENTS
  • TABLE 152. ELSTER GROUP GMBH: PRODUCT PORTFOLIO
  • TABLE 153. ELSTER GROUP GMBH: KEY STRATEGIC MOVES AND DEVELOPMENTS
  • TABLE 154. SCHNEIDER ELECTRIC SE: KEY EXECUTIVES
  • TABLE 155. SCHNEIDER ELECTRIC SE: COMPANY SNAPSHOT
  • TABLE 156. SCHNEIDER ELECTRIC SE: OPERATING SEGMENTS
  • TABLE 157. SCHNEIDER ELECTRIC SE: PRODUCT PORTFOLIO
  • TABLE 158. SCHNEIDER ELECTRIC SE: KEY STRATEGIC MOVES AND DEVELOPMENTS
  • TABLE 159. SENSUS: KEY EXECUTIVES
  • TABLE 160. SENSUS: COMPANY SNAPSHOT
  • TABLE 161. SENSUS: OPERATING SEGMENTS
  • TABLE 162. SENSUS: PRODUCT PORTFOLIO
  • TABLE 163. SENSUS: KEY STRATEGIC MOVES AND DEVELOPMENTS
  • TABLE 164. TIETO CORPORATION: KEY EXECUTIVES
  • TABLE 165. TIETO CORPORATION: COMPANY SNAPSHOT
  • TABLE 166. TIETO CORPORATION: OPERATING SEGMENTS
  • TABLE 167. TIETO CORPORATION: PRODUCT PORTFOLIO
  • TABLE 168. TIETO CORPORATION: KEY STRATEGIC MOVES AND DEVELOPMENTS
  • TABLE 169. LANDIS+GYR: KEY EXECUTIVES
  • TABLE 170. LANDIS+GYR: COMPANY SNAPSHOT
  • TABLE 171. LANDIS+GYR: OPERATING SEGMENTS
  • TABLE 172. LANDIS+GYR: PRODUCT PORTFOLIO
  • TABLE 173. LANDIS+GYR: KEY STRATEGIC MOVES AND DEVELOPMENTS
  • TABLE 174. TRILLIANT INC.: KEY EXECUTIVES
  • TABLE 175. TRILLIANT INC.: COMPANY SNAPSHOT
  • TABLE 176. TRILLIANT INC.: OPERATING SEGMENTS
  • TABLE 177. TRILLIANT INC.: PRODUCT PORTFOLIO
  • TABLE 178. TRILLIANT INC.: KEY STRATEGIC MOVES AND DEVELOPMENTS
  • TABLE 179. DYNOSONIC: KEY EXECUTIVES
  • TABLE 180. DYNOSONIC: COMPANY SNAPSHOT
  • TABLE 181. DYNOSONIC: OPERATING SEGMENTS
  • TABLE 182. DYNOSONIC: PRODUCT PORTFOLIO
  • TABLE 183. DYNOSONIC: KEY STRATEGIC MOVES AND DEVELOPMENTS
  • TABLE 184. ITRON, INC: KEY EXECUTIVES
  • TABLE 185. ITRON, INC: COMPANY SNAPSHOT
  • TABLE 186. ITRON, INC: OPERATING SEGMENTS
  • TABLE 187. ITRON, INC: PRODUCT PORTFOLIO
  • TABLE 188. ITRON, INC: KEY STRATEGIC MOVES AND DEVELOPMENTS
  • LIST OF FIGURES

  • FIGURE 1. GLOBAL ADVANCED METERING INFRASTRUCTURE MARKET SEGMENTATION
  • FIGURE 2. GLOBAL ADVANCED METERING INFRASTRUCTURE MARKET
  • FIGURE 3. SEGMENTATION ADVANCED METERING INFRASTRUCTURE MARKET
  • FIGURE 4. TOP INVESTMENT POCKET IN ADVANCED METERING INFRASTRUCTURE MARKET
  • FIGURE 5. MODERATE BARGAINING POWER OF BUYERS
  • FIGURE 6. MODERATE BARGAINING POWER OF SUPPLIERS
  • FIGURE 7. MODERATE THREAT OF NEW ENTRANTS
  • FIGURE 8. LOW THREAT OF SUBSTITUTION
  • FIGURE 9. HIGH COMPETITIVE RIVALRY
  • FIGURE 10. OPPORTUNITIES, RESTRAINTS AND DRIVERS: GLOBALADVANCED METERING INFRASTRUCTURE MARKET
  • FIGURE 11. ADVANCED METERING INFRASTRUCTURE MARKET SEGMENTATION, BY BY DEVICE
  • FIGURE 12. ADVANCED METERING INFRASTRUCTURE MARKET FOR SMART GAS METER, BY COUNTRY, 2025-2033 ($MILLION)
  • FIGURE 13. ADVANCED METERING INFRASTRUCTURE MARKET FOR SMART WATER METER, BY COUNTRY, 2025-2033 ($MILLION)
  • FIGURE 14. ADVANCED METERING INFRASTRUCTURE MARKET FOR SMART ELECTRIC METER, BY COUNTRY, 2025-2033 ($MILLION)
  • FIGURE 15. ADVANCED METERING INFRASTRUCTURE MARKET SEGMENTATION, BY BY SERVICE
  • FIGURE 16. ADVANCED METERING INFRASTRUCTURE MARKET FOR SYSTEM INTEGRATION, BY COUNTRY, 2025-2033 ($MILLION)
  • FIGURE 17. ADVANCED METERING INFRASTRUCTURE MARKET FOR METER DEPLOYMENT, BY COUNTRY, 2025-2033 ($MILLION)
  • FIGURE 18. ADVANCED METERING INFRASTRUCTURE MARKET FOR PROGRAM MANAGEMENT AND CONSULTING, BY COUNTRY, 2025-2033 ($MILLION)
  • FIGURE 19. ADVANCED METERING INFRASTRUCTURE MARKET SEGMENTATION, BY BY SOLUTION
  • FIGURE 20. ADVANCED METERING INFRASTRUCTURE MARKET FOR METER DATA MANAGEMENT, BY COUNTRY, 2025-2033 ($MILLION)
  • FIGURE 21. ADVANCED METERING INFRASTRUCTURE MARKET FOR METER DATA ANALYTICS, BY COUNTRY, 2025-2033 ($MILLION)
  • FIGURE 22. ADVANCED METERING INFRASTRUCTURE MARKET FOR ADVANCED METERING INFRASTRUCTURE SECURITY, BY COUNTRY, 2025-2033 ($MILLION)
  • FIGURE 23. ADVANCED METERING INFRASTRUCTURE MARKET FOR METER COMMUNICATION INFRASTRUCTURE, BY COUNTRY, 2025-2033 ($MILLION)
  • FIGURE 24. ADVANCED METERING INFRASTRUCTURE MARKET SEGMENTATION, BY BY END-USER
  • FIGURE 25. ADVANCED METERING INFRASTRUCTURE MARKET FOR RESIDENTIAL, BY COUNTRY, 2025-2033 ($MILLION)
  • FIGURE 26. ADVANCED METERING INFRASTRUCTURE MARKET FOR COMMERCIAL, BY COUNTRY, 2025-2033 ($MILLION)
  • FIGURE 27. ADVANCED METERING INFRASTRUCTURE MARKET FOR INDUSTRIAL, BY COUNTRY, 2025-2033 ($MILLION)
  • FIGURE 28. TOP WINNING STRATEGIES, BY YEAR, 2022-2024*
  • FIGURE 29. TOP WINNING STRATEGIES, BY DEVELOPMENT, 2022-2024*
  • FIGURE 30. TOP WINNING STRATEGIES, BY COMPANY, 2022-2024*
  • FIGURE 31. PRODUCT MAPPING OF TOP 10 PLAYERS
  • FIGURE 32. COMPETITIVE DASHBOARD
  • FIGURE 33. COMPETITIVE HEATMAP: ADVANCED METERING INFRASTRUCTURE MARKET
  • FIGURE 34. TOP PLAYER POSITIONING, 2024
  • FIGURE 35. IBM CORPORATION: NET SALES, 2022-2024 ($MILLION)
  • FIGURE 36. IBM CORPORATION: REVENUE SHARE, BY SEGMENT, 2024 (%)
  • FIGURE 37. IBM CORPORATION: REVENUE SHARE, BY REGION, 2024 (%)
  • FIGURE 38. GENERAL ELECTRIC: NET SALES, 2022-2024 ($MILLION)
  • FIGURE 39. GENERAL ELECTRIC: REVENUE SHARE, BY SEGMENT, 2024 (%)
  • FIGURE 40. GENERAL ELECTRIC: REVENUE SHARE, BY REGION, 2024 (%)
  • FIGURE 41. ELSTER GROUP GMBH: NET SALES, 2022-2024 ($MILLION)
  • FIGURE 42. ELSTER GROUP GMBH: REVENUE SHARE, BY SEGMENT, 2024 (%)
  • FIGURE 43. ELSTER GROUP GMBH: REVENUE SHARE, BY REGION, 2024 (%)
  • FIGURE 44. SCHNEIDER ELECTRIC SE: NET SALES, 2022-2024 ($MILLION)
  • FIGURE 45. SCHNEIDER ELECTRIC SE: REVENUE SHARE, BY SEGMENT, 2024 (%)
  • FIGURE 46. SCHNEIDER ELECTRIC SE: REVENUE SHARE, BY REGION, 2024 (%)
  • FIGURE 47. SENSUS: NET SALES, 2022-2024 ($MILLION)
  • FIGURE 48. SENSUS: REVENUE SHARE, BY SEGMENT, 2024 (%)
  • FIGURE 49. SENSUS: REVENUE SHARE, BY REGION, 2024 (%)
  • FIGURE 50. TIETO CORPORATION: NET SALES, 2022-2024 ($MILLION)
  • FIGURE 51. TIETO CORPORATION: REVENUE SHARE, BY SEGMENT, 2024 (%)
  • FIGURE 52. TIETO CORPORATION: REVENUE SHARE, BY REGION, 2024 (%)
  • FIGURE 53. LANDIS+GYR: NET SALES, 2022-2024 ($MILLION)
  • FIGURE 54. LANDIS+GYR: REVENUE SHARE, BY SEGMENT, 2024 (%)
  • FIGURE 55. LANDIS+GYR: REVENUE SHARE, BY REGION, 2024 (%)
  • FIGURE 56. TRILLIANT INC.: NET SALES, 2022-2024 ($MILLION)
  • FIGURE 57. TRILLIANT INC.: REVENUE SHARE, BY SEGMENT, 2024 (%)
  • FIGURE 58. TRILLIANT INC.: REVENUE SHARE, BY REGION, 2024 (%)
  • FIGURE 59. DYNOSONIC: NET SALES, 2022-2024 ($MILLION)
  • FIGURE 60. DYNOSONIC: REVENUE SHARE, BY SEGMENT, 2024 (%)
  • FIGURE 61. DYNOSONIC: REVENUE SHARE, BY REGION, 2024 (%)
  • FIGURE 62. ITRON, INC: NET SALES, 2022-2024 ($MILLION)
  • FIGURE 63. ITRON, INC: REVENUE SHARE, BY SEGMENT, 2024 (%)
  • FIGURE 64. ITRON, INC: REVENUE SHARE, BY REGION, 2024 (%)

Purchase Full Report of
Advanced Metering Infrastructure Market

PURCHASE OPTIONS


* Taxes/Fees, If applicable will be added during checkout. All prices in USD.

Have a question ?

Need to add more ?

Avail up to 30% discount on subscription plans on


Avenue