Int'l : +1-503-894-6022 | Toll Free : +1-800-792-5285 | help@alliedmarketresearch.com
A10376 | Pages: 407 | Charts: 112 | Tables: 213 |
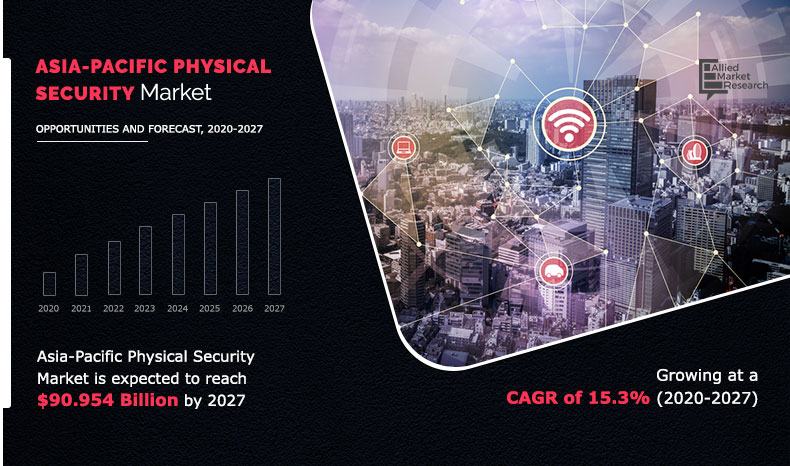
The Asia-Pacific physical security market size was valued at $28,809 million in 2019 and is estimated to reach a value of $90,954 million by 2027, registering a CAGR of 15.3% from 2020 to 2027. Physical security is defined as protection of personnel, hardware, software, networks, and data from physical actions and events that could cause serious loss or damage to an enterprise, agency, or institution. It comprises access control, surveillance, and testing. Physical locations are monitored by installing surveillance cameras and notification systems, including heat sensors, intrusion detection sensors, and smoke detectors. Modern security systems can take advantage of multiple types of sensors, including those that detect motion, heat, and smoke for protection against intrusion and accidents. Rise in importance for physical security for organizations and identifying potential threats are the key drivers for market growth. Rapid adoption of contact less biometric systems in the pandemic and high demand for video surveillance solutions, specifically for remote monitoring activities are the major factors that propel the market growth. However, rise in issue of data privacy is expected to restrain the market growth. In addition, rapid growth of IoT network and emergence of advanced technologies such as AI and security analytics is estimated to be a game changer for the market.
[COVIDIMPACTSTATEMENT]
Industry wise, the BFSI segment is estimated to gain a higher CAGR, backed by integration of AI-based surveillance system within the banking sector, which is set to create a lucrative growth scenario for the overall industry. These video solutions provide remote monitoring and advanced AI capabilities.
Get more information on this report : Request Sample Pages
China holds a significant place within the market, mainly backed by rise in smart city project initiatives, which has mandated adoption of technology and measures to reduce adverse impacts of growing urbanization. For instance, in Hangzhou, a city with a population of greater than 9.47 million, is a smart technological initiative designed by Alibaba, a Chinese tech giant. This city primarily operates through artificial intelligence that uses big data and big computing power to improve and fix traffic problems. Thus, by monitoring every vehicle within the city, it has become possible to reduce traffic jams by 15%. Thus, such tech initiatives taken by China has led to an immense adoption of physical security devices, creating a lucrative opportunity for the overall market growth during the forecast period.
The report focuses on growth prospects, restraints, and market analysis. The study of physical security provides Porter’s five forces analysis of the internet advertising industry to understand impact of various factors such as bargaining power of suppliers, competitive intensity of competitors, threat of new entrants, threat of substitutes, and bargaining power of buyers on the physical security market trends in Asia-Pacific.
The Asia-Pacific physical security market is primarily segmented on the basis of component, enterprise size, industry verticals, and country. On the basis of component, the market is bifurcated into system and services. The system segment is further divided into physical access system, video surveillance system, perimeter intrusion & detection, physical security information management, and others. In addition, the services segment is divided into access control-as-a-service, video surveillance-as-a-service, remote monitoring services, security systems integration services and others. On the basis of enterprise size, it is divided into large enterprises and small & medium enterprises. on the basis of industry vertical, it is divided into (BFSI, government, retail, transportation, residential, IT & telecom, and others.
Post COVID-19, size of the Asia-Pacific physical security market is estimated to grow from 33,596 million in 2020 and projected to reach $90,954 million by 2027, at a CAGR of 15.3%. The current estimation of 2027 is projected to be higher than pre-COVID-19 estimates. COVID-19 pandemic has bought a positive impact on the physical security market, achieving a growth rate of 5-10% in the year 2020. Physical security market, primarily encompasses study of physical access system, video surveillance system, perimeter intrusion & detection, physical security information management, and physical identity access management. Before the pandemic, there was a significant demand for contact-based biometric and access control systems. However, owing to the COVID-19 crisis, there is a strong traction for contactless access control and biometric systems, owing to increase in awareness among people to avoid any contacts at public places. In August 2020, the government of China introduced contactless biometric technology at the Beijing Capital International Airport (BCIA) to ensure safe air travel.
Factors such as colossal demand for contactless biometric system, specifically owing to the pandemic and high demand for video surveillance solutions for remote monitoring activities are some of the major factors that are estimated to create a positive growth effect on the market. Furthermore, rapid growth within the IoT network is anticipated to create lucrative opportunities during the forecast period. However, rise in data privacy issues is estimated to restrain the overall market.
Demand for video surveillance products has increased, especially in the COVID-19 pandemic scenario, where remote monitoring and surveillance measures have a great importance for patient tracking and preventing spread of the disease. Asia-Pacific dominated the video surveillance market, with China holding a significantly higher share. China mobilized its mass surveillance tools, from drones to CCTV cameras, to monitor quarantined people and track spread of the coronavirus. As per the data released by CNBC, there are estimated 770 million surveillance cameras installed around the world, with more than 50% installed only in China. In addition, China is home to some of the world’s largest makers of video surveillance products, such as Division, Huawei, and Dahua. Furthermore, governments of countries such as China and South Korea are adopting surveillance technologies to keep a track of the coronavirus spread.
[COMPONENTGRAPH]
Get more information on this report : Request Sample Pages
AI technology is gaining a massive demand in both commercial and business sectors. These sectors are adopting AI technology to improve overall analytic processing of data right from text-based information to audio & video to gain meaningful business insights. It has also changed operational behavior of video surveillance technology by easing the process of monitoring and tracking. As per data published by Carnegie Endowment for International Peace in 2018, AI surveillance technology is spreading at a faster rate to a wide range of countries than experts have commonly understood. At least 75 out of 176 countries, globally are actively using AI technologies for surveillance purposes. This includes smart city/safe city platforms (56 countries), facial recognition systems (64 countries), and smart policing (52 countries). Out of which, China is gaining dominance within AI based surveillance. Companies such as Huawei, Hikvision, Dahua, and ZTE are some of the major companies involved in the supply of AI-based surveillance technologies.
Therefore, with such rapid developments and advancement strategies adopted by these companies, the market is expected to gain a higher growth rate during the forecast period.
[INDUSTRYVERTICALGRAPH]
Get more information on this report : Request Sample Pages
Key Benefits For Stakeholders
Key Market Segments
Key Market Players
CHAPTER 1:INTRODUCTION
1.1.REPORT DESCRIPTION
1.2.KEY BENEFITS FOR STAKEHOLDERS
1.3.KEY MARKET SEGMENTS
1.3.1.Key market players
1.4.RESEARCH METHODOLOGY
1.4.1.Secondary research
1.4.2.Primary research
1.4.3.Analyst tools & models
CHAPTER 2:EXECUTIVE SUMMARY
2.1.KEY FINDINGS
2.1.1.Top impacting factors
2.1.2.Top investment pockets
2.2.CXO PERSPECTIVE
CHAPTER 3:MARKET OVERVIEW
3.1.MARKET DEFINITION AND SCOPE
3.2.KEY FORCES SHAPING THE PHYSICAL SECURITY MARKET
3.3.MARKET DYNAMICS
3.3.1.Drivers
3.3.1.1.Rapid Adoption of Contactless biometric system
3.3.1.2.High demand for video surveillance solutions
3.3.2.Restraints
3.3.2.1.Rise in issue of data privacy
3.3.3.Opportunities
3.3.3.1.Rapid growth of IoT Network
3.6.VALUE CHAIN ANALYSIS
3.7.COVID-19 IMPACT ANALYSIS ON THE PHYSICAL SECURITYMARKET
3.7.1.Impact on market size
3.7.2.Consumer trends, preferences, and budget impact
3.7.3.Economic impact
3.7.4.Key player strategies to tackle negative impact
3.7.5.Opportunity window
CHAPTER 4:PHYSICAL SECURITYSTORAGE MARKET, BY COMPONENT
4.1.OVERVIEW
4.2.SYSTEM
4.2.1.Key market trends, growth factors, and opportunities
4.2.2.Market size and forecast, by region
4.2.3.Market analysis, by country
4.3.SERVICES
4.3.1.Key market trends, growth factors, and opportunities
4.3.2.Market size and forecast, by region
4.3.3.Market analysis, by country
CHAPTER 5:PHYSICAL SECURITY STORAGE MARKET, BY SYSTEM TYPE
5.1.OVERVIEW
5.2.PHYSICAL ACCESS SYSTEM
5.2.1.Key market trends, growth factors, and opportunities
5.2.2.Market size and forecast, by region
5.2.3.Market analysis, by country
5.3.VIDEO SURVEILLANCE SYSYEM
5.3.1.Key market trends, growth factors, and opportunities
5.3.2.Market size and forecast, by region
5.3.3.Market analysis, by country
5.4.PERIMETER INTRUSION AND DETECTION
5.4.1.Key market trends, growth factors, and opportunities
5.4.2.Market size and forecast, by region
5.4.3.Market analysis, by country
5.5. PHYSICAL SECURITY INFORMATION MANAGEMENT
5.5.1.Key market trends, growth factors, and opportunities
5.5.2.Market size and forecast, by region
5.5.3.Market analysis, by country
5.6.OTHERS
5.6.1.Key market trends, growth factors, and opportunities
5.6.2.Market size and forecast, by region
5.6.3.Market analysis, by country
CHAPTER 6:PHYSICAL SECURITYSTORAGE MARKET, BY SERVICE TYPE
6.1.OVERVIEW
6.2.ACCESS CONTROL-AS-A-SERVICE
6.2.1.Key market trends, growth factors, and opportunities
6.2.2.Market size and forecast, by region
6.2.3.Market analysis, by country
6.3.VIDEO SURVEILLANCE-AS-A-SERVICE
6.3.1.Key market trends, growth factors, and opportunities
6.3.2.Market size and forecast, by region
6.3.3.Market analysis, by country
6.4.REMOTE MONITORING SERVICE
6.4.1.Key market trends, growth factors, and opportunities
6.4.2.Market size and forecast, by region
6.4.3.Market analysis, by country
6.5.SECURITY SYSTEM INTEGRATION SERVICE
6.5.1.Key market trends, growth factors, and opportunities
6.5.2.Market size and forecast, by region
6.5.3.Market analysis, by country
6.6.OTHERS
6.6.1.Key market trends, growth factors, and opportunities
6.6.2.Market size and forecast, by region
6.6.3.Market analysis, by country
CHAPTER 7:PHYSICAL SECURITYSTORAGE MARKET, BY ORGANIZATION SIZE
7.1.OVERVIEW
7.2.LARGE ENTERPRISE
7.2.1.Key market trends, growth factors, and opportunities
7.2.2.Market size and forecast, by region
7.2.3.Market analysis, by country
7.3.SMALL AND MEDIUM ENTERPRISE
7.3.1.Key market trends, growth factors, and opportunities
7.3.2.Market size and forecast, by region
7.3.3.Market analysis, by country
CHAPTER 8:PHYSICAL SECURITYSTORAGE MARKET, BY INDUSTRY VERTICAL
8.1.OVERVIEW
8.2.BFSI
8.2.1.Key market trends, growth factors, and opportunities
8.2.2.Market size and forecast, by region
8.2.3.Market analysis, by country
8.3.GOVERNMENT
8.3.1.Key market trends, growth factors, and opportunities
8.3.2.Market size and forecast, by region
8.3.3.Market analysis, by country
8.4.RETAIL
8.4.1.Key market trends, growth factors, and opportunities
8.4.2.Market size and forecast, by region
8.4.3.Market analysis, by country
8.5.TRANSPORTATION
8.5.1.Key market trends, growth factors, and opportunities
8.5.2.Market size and forecast, by region
8.5.3.Market analysis, by country
8.6.RESIDENTIAL
8.6.1.Key market trends, growth factors, and opportunities
8.6.2.Market size and forecast, by region
8.6.3.Market analysis, by country
8.7.IT AND TELECOM
8.7.1.Key market trends, growth factors, and opportunities
8.7.2.Market size and forecast, by region
8.7.3.Market analysis, by country
8.8.OTHERS
8.8.1.Key market trends, growth factors, and opportunities
8.8.2.Market size and forecast, by region
8.8.3.Market analysis, by country
CHAPTER 9:PHYSICAL SECURITYSTORAGE MARKET, BY REGION
9.1.OVERVIEW
9.2.ASIA-PACIFIC
9.2.1.Key market trends, growth factors and opportunities
9.2.2.Market size and forecast, by component
9.2.3.Market size and forecast, by solution type
9.2.4.Market size and forecast, by deployment type
9.2.5.Market size and forecast, by organization size
9.2.6.Market size and forecast, by industry verticals
9.2.7.Market analysis, by country
9.2.7.1.China
9.2.7.1.1.Market size and forecast, by component
9.2.7.1.2.Market size and forecast, by system type
9.2.7.1.3.Market size and forecast, by service type
9.2.7.1.4.Market size and forecast, by organization size
9.2.7.1.5.Market size and forecast, by industry verticals
9.2.7.2.India
9.2.7.2.1.Market size and forecast, by component
9.2.7.2.2.Market size and forecast, by system type
9.2.7.2.3.Market size and forecast, by service type
9.2.7.2.4.Market size and forecast, by organization size
9.2.7.2.5.Market size and forecast, by industry verticals
9.2.7.3.Japan
9.2.7.3.1.Market size and forecast, by component
9.2.7.3.2.Market size and forecast, by system type
9.2.7.3.3.Market size and forecast, by service type
9.2.7.3.4.Market size and forecast, by organization size
9.2.7.3.5.Market size and forecast, by industry verticals
9.2.7.4.Indonesia
9.2.7.4.1.Market size and forecast, by component
9.2.7.4.2.Market size and forecast, by system type
9.2.7.4.3.Market size and forecast, by service type
9.2.7.4.4.Market size and forecast, by organization size
9.2.7.4.5.Market size and forecast, by industry verticals
9.2.7.5.Australia
9.2.7.5.1.Market size and forecast, by component
9.2.7.5.2.Market size and forecast, by system type
9.2.7.5.3.Market size and forecast, by deployment type
9.2.7.5.4.Market size and forecast, by organization size
9.2.7.5.5.Market size and forecast, by industry verticals
9.2.7.6.Thailand
9.2.7.6.1.Market size and forecast, by component
9.2.7.6.2.Market size and forecast, by system type
9.2.7.6.3.Market size and forecast, by service type
9.2.7.6.4.Market size and forecast, by organization size
9.2.7.6.5.Market size and forecast, by industry verticals
9.2.7.7.Singapore
9.2.7.7.1.Market size and forecast, by component
9.2.7.7.2.Market size and forecast, by system type
9.2.7.7.3.Market size and forecast, by service type
9.2.7.7.4.Market size and forecast, by organization size
9.2.7.7.5.Market size and forecast, by industry verticals
9.2.7.8.Malaysia
9.2.7.8.1.Market size and forecast, by component
9.2.7.8.2.Market size and forecast, by system type
9.2.7.8.3.Market size and forecast, by service type
9.2.7.8.4.Market size and forecast, by organization size
9.2.7.8.5.Market size and forecast, by industry verticals
9.2.7.9.South Korea
9.2.7.9.1.Market size and forecast, by component
9.2.7.9.2.Market size and forecast, by system type
9.2.7.9.3.Market size and forecast, by service type
9.2.7.9.4.Market size and forecast, by organization size
9.2.7.9.5.Market size and forecast, by industry verticals
9.2.7.10.Vietnam
9.2.7.10.1.Market size and forecast, by component
9.2.7.10.2.Market size and forecast, by system type
9.2.7.10.3.Market size and forecast, by service type
9.2.7.10.4.Market size and forecast, by organization size
9.2.7.10.5.Market size and forecast, by industry verticals
9.2.7.11.New Zealand
9.2.7.11.1.Market size and forecast, by component
9.2.7.11.2.Market size and forecast, by solution type
9.2.7.11.3.Market size and forecast, by deployment type
9.2.7.11.4.Market size and forecast, by organization size
9.2.7.11.5.Market size and forecast, by industry verticals
9.2.7.12. Singapore
9.2.7.12.1.Market size and forecast, by component
9.2.7.12.2.Market size and forecast, by solution type
9.2.7.12.3.Market size and forecast, by deployment type
9.2.7.12.4.Market size and forecast, by organization size
9.2.7.12.5.Market size and forecast, by industry verticals
9.2.7.13.Rest of Asia-Pacific
9.2.7.13.1.Market size and forecast, by component
9.2.7.13.2.Market size and forecast, by solution type
9.2.7.13.3.Market size and forecast, by deployment type
9.2.7.13.4.Market size and forecast, by organization size
9.2.7.13.5.Market size and forecast, by industry verticals
CHAPTER 10:COMPETITIVE LANDSCAPE
10.1.KEY PLAYER POSITIONING ANALYSIS, 2019
10.2.TOP WINNING STRATEGIES
10.3.COMPETITIVE DASHBOARD
10.4.KEY DEVELOPMENTS
10.4.1.New product launches
10.4.2.Product development
10.4.3.Collaboration
10.4.4.Acquisition
10.4.5.Partnership
CHAPTER 11:COMPANY PROFILE
11.1.CISCO SYSTEMS INC.,
11.1.1.Company overview
11.1.2.Key executive
11.1.3.Company snapshot
11.1.4.Operating business segments
11.1.5.Product portfolio
11.1.6.Business performance
11.1.7.Key Strategic Move(s)s and developments
11.2.HONEYWELL INTERNATIONAL .
11.2.1.Company overview
11.2.2.Key executives
11.2.3.Company snapshot
11.2.4.Operating business segments
11.2.5.Product portfolio
11.2.6.R&D expenditure
11.2.7.Business performance
11.2.8.Key strategic moves and developments
11.3.HUAWEI
11.3.1.Company overview
11.3.2.Key executives
11.3.3.Company snapshot
11.3.4.Operating business segments
11.3.5.Product portfolio
11.3.6.R&D expenditure
11.3.7.Business performance
11.3.8.Key strategic moves and developments
11.4.NEC CORPORATION
11.4.1.Company overview
11.4.2.Key executives
11.4.3.Company snapshot
11.4.4.Operating business segments
11.4.5.Product portfolio
11.4.6.R&D expenditure
11.4.7.Business performance
11.4.8.Key strategic moves and developments
11.5.JOHNSON CONTROLS
11.5.1.Company overview
11.5.2.Key executives
11.5.3.Company snapshot
11.5.4.Operating business segments
11.5.5.Product portfolio
11.5.6.R&D expenditure
11.5.7.Business performance
11.5.8.Key strategic moves and developments
11.6.ANIXTER
11.6.1.Company overview
11.6.2.Key executives
11.6.3.Company snapshot
11.6.4.Product portfolio
11.6.5.R&D expenditure
11.6.6.Business performance
11.6.7.Key strategic moves and developments
11.7.GENETEC
11.7.1.Company overview
11.7.2.Key executives
11.7.3.Company snapshot
11.7.4.Operating business segments
11.7.5.Product portfolio
11.7.6.R&D expenditure
11.7.7.Business performance
11.7.8.Key strategic moves and developments
11.8.ADT CORPORATION
11.8.1.Company overview
11.8.2.Key executives
11.8.3.Company snapshot
11.8.4.Product portfolio
11.8.5.Business performance
11.8.6.Key strategic moves and developments
11.9.AXIS COMMUNICATION AB.
11.9.1.Company overview
11.9.2.Company snapshot
11.9.3.Operating business segments
11.9.4.Product portfolio
11.9.5.R&D expenditure
11.9.6.Business performance
11.9.7.Key strategic moves and developments
11.10. BOSCH SECURITY
11.10.1.Company overview
11.10.2.Key executives
11.10.3.Company snapshot
11.10.4.Product portfolio
11.10.5.R&D expenditure
11.10.6.Business performance
11.10.7.Key strategic moves and developments
LIST OF TABLES
TABLE 01. ASIA-PACIFIC PHYSICAL SECURITY MARKET, BY COMPONENT, 2019–2027 ($MILLION)
TABLE 02. ASIA-PACIFIC PHYSICAL SECURITY MARKET FOR SYSTEM, BY COUNTRY, 2019–2027 ($MILLION)
TABLE 03. ASIA-PACIFIC PHYSICAL SECURITY MARKET FOR SERVICE, BY COUNTRY, 2019–2027 ($MILLION)
TABLE 04. ASIA-PACIFIC PHYSICAL SECURITY MARKET, BY SYSTEM TYPE, 2019–2027 ($MILLION)
TABLE 05. ASIA-PACIFIC PHYSICAL SECURITY MARKET FOR PHYSICAL ACCESS SYSTEM BY COUNTRY, 2019–2027 ($MILLION)
TABLE 06. ASIA-PACIFIC PHYSICAL SECURITY MARKET FOR VIDEO SURVEILLANCE SYSTEM, BY COUNTRY, 2019–2027 ($MILLION)
TABLE 07. ASIA-PACIFIC PHYSICAL SECURITY MARKET FOR PERIMETER INTRUSION AND DETECTION, BY COUNTRY, 2019–2027 ($MILLION)
TABLE 08. ASIA-PACIFIC PHYSICAL SECURITY MARKET FOR PHYSICAL SECURITY INFORMATION MANAGEMENT, BY COUNTRY, 2019–2027 ($MILLION)
TABLE 09. ASIA-PACIFIC PHYSICAL SECURITY MARKET FOR OTHERS, BY COUNTRY, 2019 2027 ($MILLION)
TABLE 10. ASIA-PACIFIC PHYSICAL SECURITY MARKET, BY SERVICE TYPE, 2019–2027 ($MILLION)
TABLE 11. ASIA-PACIFIC PHYSICAL SECURITY MARKET FOR ACCESS CONTROL-AS-A-SERVICE SEGMENT, BY COUNTRY, 2019–2027 ($MILLION)
TABLE 12. ASIA-PACIFIC PHYSICAL SECURITY MARKET FOR VIDEO SURVEILLANCE-AS-A-SERVICE SEGMENT, BY COUNTRY, 2019–2027 ($MILLION)
TABLE 13. ASIA-PACIFIC PHYSICAL SECURITY MARKET FOR REMOTE MONITORING SERVICES SEGMENT, BY COUNTRY, 2019–2027 ($MILLION)
TABLE 14. ASIA-PACIFIC PHYSICAL SECURITY MARKET FOR SECURITY SYSTEMS INTEGRATION SERVICES SEGMENT, BY COUNTRY, 2019–2027 ($MILLION)
TABLE 15. ASIA-PACIFIC PHYSICAL SECURITY MARKET FOR OTHERS SEGMENT, BY COUNTRY, 2019–2027 ($MILLION)
TABLE 16. ASIA-PACIFIC PHYSICAL SECURITY MARKET, BY ORGANIZATION SIZE, 2019–2027 ($MILLION)
TABLE 17. ASIA-PACIFIC PHYSICAL SECURITY MARKET FOR LARGE ENTERPRISES, BY COUNTRY, 2019–2027 ($MILLION)
TABLE 18. ASIA-PACIFIC PHYSICAL SECURITY MARKET FOR SMALL AND MEDIUM ENTERPRISES, BY COUNTRY, 2019–2027 ($MILLION)
TABLE 19. ASIA-PACIFIC PHYSICAL SECURITY MARKET, BY INDUSTRY VERTICAL, 2019–2027 ($MILLION)
TABLE 20. ASIA-PACIFIC PHYSICAL SECURITY MARKET FOR BFSI , BY COUNTRY, 2019–2027 ($MILLION)
TABLE 21. ASIA-PACIFIC PHYSICAL SECURITY MARKET FOR GOVERNMENT, BY COUNTRY, 2019–2027 ($MILLION)
TABLE 22. ASIA-PACIFIC PHYSICAL SECURITY MARKET FOR RETAIL, BY COUNTRY, 2019–2027 ($MILLION)
TABLE 23. ASIA-PACIFIC PHYSICAL SECURITY MARKET FOR TRANSPORTATION, BY COUNTRY, 2019–2027 ($MILLION)
TABLE 24. ASIA-PACIFIC PHYSICAL SECURITY MARKET FOR RESIDENTIAL, BY COUNTRY, 2019–2027 ($MILLION)
TABLE 25. ASIA-PACIFIC PHYSICAL SECURITY MARKET FOR IT AND TELECOM, BY COUNTRY, 2019–2027 ($MILLION)
TABLE 26. ASIA-PACIFIC PHYSICAL SECURITY MARKET FOR OTHERS, BY COUNTRY, 2019 2027 ($MILLION)
TABLE 27. ASIA-PACIFIC PHYSICAL SECURITY MARKET, BY COUNTRY, 2019–2027 ($MILLION)
TABLE 28. CHINA PHYSICAL SECURITY MARKET, BY COMPONENT, 2019–2027 ($MILLION)
TABLE 29. CHINA PHYSICAL SECURITY MARKET, BY SYSTEM TYPE, 2019–2027 ($MILLION)
TABLE 30. CHINA PHYSICAL SECURITY MARKET, BY SERVICE TYPE, 2019–2027 ($MILLION)
TABLE 31. CHINA PHYSICAL SECURITY MARKET, BY ORGANIZATION SIZE, 2019–2027 ($MILLION)
TABLE 32. CHINA PHYSICAL SECURITY MARKET, BY INDUSTRY VERTICAL, 2019–2027 ($MILLION)
TABLE 33. JAPAN PHYSICAL SECURITY MARKET, BY COMPONENT, 2019–2027 ($MILLION)
TABLE 34. JAPAN PHYSICAL SECURITY MARKET, BY SYSTEM TYPE, 2019–2027 ($MILLION)
TABLE 35. JAPAN PHYSICAL SECURITY MARKET, BY SERVICE TYPE, 2019–2027 ($MILLION)
TABLE 36. JAPAN PHYSICAL SECURITY MARKET, BY ORGANIZATION SIZE, 2019–2027 ($MILLION)
TABLE 37. JAPAN PHYSICAL SECURITY MARKET, BY INDUSTRY VERTICAL, 2019–2027 ($MILLION)
TABLE 38. INDIA PHYSICAL SECURITY MARKET, BY COMPONENT, 2019–2027 ($MILLION)
TABLE 39. INDIA PHYSICAL SECURITY MARKET, BY SYSTEM TYPE, 2019–2027 ($MILLION)
TABLE 40. INDIA PHYSICAL SECURITY MARKET, BY SERVICE TYPE, 2019–2027 ($MILLION)
TABLE 41. INDIA PHYSICAL SECURITY MARKET, BY ORGANIZATION SIZE, 2019–2027 ($MILLION)
TABLE 42. INDIA PHYSICAL SECURITY MARKET, BY INDUSTRY VERTICAL, 2019–2027 ($MILLION)
TABLE 43. SOUTH KOREA PHYSICAL SECURITY MARKET, BY COMPONENT, 2019–2027 ($MILLION)
TABLE 44. SOUTH KOREA PHYSICAL SECURITY MARKET, BY SYSTEM TYPE, 2019–2027 ($MILLION)
TABLE 45. SOUTH KOREA PHYSICAL SECURITY MARKET, BY SERVICE TYPE, 2019–2027 ($MILLION)
TABLE 46. SOUTH KOREA PHYSICAL SECURITY MARKET, BY ORGANIZATION SIZE, 2019–2027 ($MILLION)
TABLE 47. SOUTH KOREA PHYSICAL SECURITY MARKET, BY INDUSTRY VERTICAL, 2019–2027 ($MILLION)
TABLE 48. AUSTRALIA PHYSICAL SECURITY MARKET, BY COMPONENT, 2019–2027 ($MILLION)
TABLE 49. AUSTRALIA PHYSICAL SECURITY MARKET, BY SYSTEM TYPE, 2019–2027 ($MILLION)
TABLE 50. AUSTRALIA PHYSICAL SECURITY MARKET, BY SERVICE TYPE, 2019–2027 ($MILLION)
TABLE 51. AUSTRALIA PHYSICAL SECURITY MARKET, BY ORGANIZATION SIZE, 2019–2027 ($MILLION)
TABLE 52. AUSTRALIA PHYSICAL SECURITY MARKET, BY INDUSTRY VERTICAL, 2019–2027 ($MILLION)
TABLE 53. THAILAND PHYSICAL SECURITY MARKET, BY COMPONENT, 2019–2027 ($MILLION)
TABLE 54. THAILAND PHYSICAL SECURITY MARKET, BY SYSTEM TYPE, 2019–2027 ($MILLION)
TABLE 55. THAILAND PHYSICAL SECURITY MARKET, BY SERVICE TYPE, 2019–2027 ($MILLION)
TABLE 56. THAILAND PHYSICAL SECURITY MARKET, BY ORGANIZATION SIZE, 2019–2027 ($MILLION)
TABLE 57. THAILAND PHYSICAL SECURITY MARKET, BY INDUSTRY VERTICAL, 2019–2027 ($MILLION)
TABLE 58. SINGAPORE PHYSICAL SECURITY MARKET, BY COMPONENT, 2019–2027 ($MILLION)
TABLE 59. SINGAPORE PHYSICAL SECURITY MARKET, BY SYSTEM TYPE, 2019–2027 ($MILLION)
TABLE 60. SINGAPORE PHYSICAL SECURITY MARKET, BY SERVICE TYPE, 2019–2027 ($MILLION)
TABLE 61. SINGAPORE PHYSICAL SECURITY MARKET, BY ORGANIZATION SIZE, 2019–2027 ($MILLION)
TABLE 62. SINGAPORE PHYSICAL SECURITY MARKET, BY INDUSTRY VERTICAL, 2019–2027 MILLION)
TABLE 63. MALAYSIA PHYSICAL SECURITY MARKET, BY COMPONENT, 2019–2027 ($MILLION)
TABLE 64. MALAYSIA PHYSICAL SECURITY MARKET, BY SYSTEM TYPE, 2019–2027 ($MILLION)
TABLE 65. MALAYSIA PHYSICAL SECURITY MARKET, BY SERVICE TYPE, 2019–2027 ($MILLION)
TABLE 66. MALAYSIA PHYSICAL SECURITY MARKET, BY ORGANIZATION SIZE, 2019–2027 ($MILLION)
TABLE 67. MALAYSIA PHYSICAL SECURITY MARKET, BY INDUSTRY VERTICAL, 2019–2027 ($MILLION)
TABLE 68. INDONESIA PHYSICAL SECURITY MARKET, BY COMPONENT, 2019–2027 ($MILLION)
TABLE 69. INDONESIA PHYSICAL SECURITY MARKET, BY SYSTEM TYPE, 2019–2027 ($MILLION)
TABLE 70. INDONESIA PHYSICAL SECURITY MARKET, BY SERVICE TYPE, 2019–2027 ($MILLION)
TABLE 71. INDONESIA PHYSICAL SECURITY MARKET, BY ORGANIZATION SIZE, 2019–2027 ($MILLION)
TABLE 72. INDONESIA PHYSICAL SECURITY MARKET, BY INDUSTRY VERTICAL, 2019–2027 ($MILLION)
TABLE 73. VIETNAM PHYSICAL SECURITY MARKET, BY COMPONENT, 2019–2027 ($MILLION)
TABLE 74. VIETNAM PHYSICAL SECURITY MARKET, BY SYSTEM TYPE, 2019–2027 ($MILLION)
TABLE 75. VIETNAM PHYSICAL SECURITY MARKET, BY SERVICE TYPE, 2019–2027 ($MILLION)
TABLE 76. VIETNAM PHYSICAL SECURITY MARKET, BY ORGANIZATION SIZE, 2019–2027 ($MILLION)
TABLE 77. VIETNAM PHYSICAL SECURITY MARKET, BY INDUSTRY VERTICAL, 2019–2027 ($MILLION)
TABLE 78. MYANMAR PHYSICAL SECURITY MARKET, BY COMPONENT, 2019–2027 ($MILLION)
TABLE 79. MYANMAR PHYSICAL SECURITY MARKET, BY SYSTEM TYPE, 2019–2027 ($MILLION)
TABLE 80. MYANMAR PHYSICAL SECURITY MARKET, BY SERVICE TYPE, 2019–2027 ($MILLION)
TABLE 81. MYANMAR PHYSICAL SECURITY MARKET, BY ORGANIZATION SIZE, 2019–2027 ($MILLION)
TABLE 82. MYANMAR PHYSICAL SECURITY MARKET, BY INDUSTRY VERTICAL, 2019–2027 ($MILLION)
TABLE 83. NEW ZEALAND PHYSICAL SECURITY MARKET, BY COMPONENT, 2019–2027 ($MILLION)
TABLE 84. NEW ZEALAND PHYSICAL SECURITY MARKET, BY SYSTEM TYPE, 2019–2027 ($MILLION)
TABLE 85. NEW ZEALAND PHYSICAL SECURITY MARKET, BY SERVICE TYPE, 2019–2027 ($MILLION)
TABLE 86. NEW ZEALAND PHYSICAL SECURITY MARKET, BY ORGANIZATION SIZE, 2019–2027 ($MILLION)
TABLE 87. NEW ZEALAND PHYSICAL SECURITY MARKET, BY INDUSTRY VERTICAL, 2019–2027 ($MILLION)
TABLE 88. REST OF ASIA-PACIFIC PHYSICAL SECURITY MARKET, BY COMPONENT, 2019–2027 ($MILLION)
TABLE 89. REST OF ASIA-PACIFIC PHYSICAL SECURITY MARKET, BY SYSTEM TYPE, 2019–2027 ($MILLION)
TABLE 90. REST OF ASIA-PACIFIC PHYSICAL SECURITY MARKET, BY SERVICE TYPE, 2019–2027 ($MILLION)
TABLE 91. REST OF ASIA-PACIFIC PHYSICAL SECURITY MARKET, BY ORGANIZATION SIZE, 2019–2027 ($MILLION)
TABLE 92. REST OF ASIA-PACIFIC PHYSICAL SECURITY MARKET, BY INDUSTRY VERTICAL, 2019–2027 ($MILLION)
TABLE 93. KEY NEW PRODUCT LAUNCHES (2017–2020)
TABLE 94. COLLABORATION (2017–2020)
TABLE 95. ACQUISTION (2017–2020)
TABLE 96. CISCO SYSTEMS INC.: KEY EXECUTIVES
TABLE 97. CISCO SYSTEMS INC.: COMPANY SNAPSHOT
TABLE 98. CISCO SYSTEMS INC.: OPERATING SEGMENTS
TABLE 99. CISCO SYSTEMS INC.: PRODUCT PORTFOLIO
TABLE 100. HONEYWELL INTERNATIONAL,INC.: KEY EXECUTIVES
TABLE 101. HONEYWELL INTERNATIONAL INC.: COMPANY SNAPSHOT
TABLE 102. HONEYWELL INTERNATIONAL INC.: OPERATING SEGMENTS
TABLE 103. HONEYWELL INTERNATIONAL INC.: PRODUCT PORTFOLIO
TABLE 104. HUAWEI: KEY EXECUTIVES
TABLE 105. HUAWEI.: COMPANY SNAPSHOT
TABLE 106. HUAWEI: OPERATING SEGMENTS
TABLE 107. HUAWEI: PRODUCT PORTFOLIO
TABLE 108. NEC CORPORATION: KEY EXECUTIVES
TABLE 109. NEC CORPORATION: COMPANY SNAPSHOT
TABLE 110. NEC CORPORATION: PRODUCT PORTFOLIO
TABLE 111. JOHNSON CONTROLS: KEY EXECUTIVES
TABLE 112. JOHNSON CONTROLS: COMPANY SNAPSHOT
TABLE 113. JOHNSON CONTROLS: OPERATING SEGMENTS
TABLE 114. JOHNSON CONTROLS: PRODUCT PORTFOLIO
TABLE 115. ANIXTER: KEY EXECUTIVES
TABLE 116. ANIXTER: COMPANY SNAPSHOT
TABLE 117. ANIXTER: OPERATING SEGMENTS
TABLE 118. ANIXTER: PRODUCT PORTFOLIO
TABLE 119. GENETEC: KEY EXECUTIVES
TABLE 120. GENETEC: COMPANY SNAPSHOT
TABLE 121. GENETEC: OPERATING SEGMENTS
TABLE 122. GENETEC: PRODUCT PORTFOLIO
TABLE 123. GENETEC: KEY STRATEGIC MOVES AND DEVELOPMENTS
TABLE 124. ADT CORPORATION: KEY EXECUTIVES
TABLE 125. ADT CORPORATION: COMPANY SNAPSHOT
TABLE 126. ADT CORPORATION.: OPERATING SEGMENTS
TABLE 127. PHYSICAL SECURITY MARKET: PRODUCT PORTFOLIO
TABLE 128. AXIS COMMUNICATIONS AB: KEY EXECUTIVES
TABLE 129. AXIS COMMUNICATION AB.: COMPANY SNAPSHOT
TABLE 130. AXIS COMMUNICATIONS AB: PRODUCT PORTFOLIO
TABLE 131. BOSCH SECURITY SYSTEMS INC.: KEY EXECUTIVES
TABLE 132. BOSCH SECURITY SYSTEMS INC.: COMPANY SNAPSHOT
TABLE 133. BOSCH SECURITY SYSTEMS INC.: PRODUCT PORTFOLIO
TABLE 134. DXC TECHNOLOGY: KEY EXECUTIVES
TABLE 135. DXC TECHNOLOGY: COMPANY SNAPSHOT
TABLE 136. DXC TECHNOLOGY: OPERATING SEGMENTS
TABLE 137. DXC TECHNOLOGY: PRODUCT PORTFOLIO
TABLE 138. DELL EMC CORPORATION: KEY EXECUTIVES
TABLE 139. DELL EMC CORPORATION: COMPANY SNAPSHOT
TABLE 140. DELL EMC CORPORATION: OPERATING SEGMENTS
TABLE 141. DELL EMC CORPORATION: PRODUCT PORTFOLIO
TABLE 142. FLIR SYSTEMS INC: KEY EXECUTIVES
TABLE 143. FLIR SYSTEMS INC.: COMPANY SNAPSHOT
TABLE 144. FLIR SYSTEMS INC.: OPERATING SEGMENTS
TABLE 145. FLIR SYSTEMS INC.: PRODUCT PORTFOLIO
TABLE 146. HEWLETT-PACKARD: KEY EXECUTIVES
TABLE 147. HEWLETT-PACKARD: COMPANY SNAPSHOT
TABLE 148. HEWLETT-PACKARD: PRODUCT PORTFOLIO
TABLE 149. L3 HARRIS TECHNOLOGY: KEY EXECUTIVES
TABLE 150. L3 HARRIS TECHNOLOGY: COMPANY SNAPSHOT
TABLE 151. L3 HARRIS TECHNOLOGY: OPERATING SEGMENTS
TABLE 152. L3 HARRIS TECHNOLOGY: PRODUCT PORTFOLIO
TABLE 153. MCAFEE INC.: KEY EXECUTIVES
TABLE 154. MCAFEE INC.: COMPANY SNAPSHOT
TABLE 155. MCAFEE INC.: OPERATING SEGMENTS
TABLE 156. MCAFEE INC.: PRODUCT PORTFOLIO
TABLE 157. MILLIVISION TECHNOLOGIES: COMPANY SNAPSHOT
TABLE 158. MILLIVISION TECHNOLOGIES: PRODUCT PORTFOLIO
TABLE 159. PELCO INC: KEY EXECUTIVES..
TABLE 160. PELCO INC.: COMPANY SNAPSHOT
TABLE 161. PELCO INC.: OPERATING SEGMENTS
TABLE 162. PHYSICAL SECURITY: PRODUCT PORTFOLIO
TABLE 163. SCHNEIDER ELECTRIC: KEY EXECUTIVES
TABLE 164. SCHNEIDER ELECTRIC: COMPANY SNAPSHOT
TABLE 165. SCHNEIDER ELECTRIC: PRODUCT PORTFOLIO
TABLE 166. SENSTAR CORPORATION: KEY EXECUTIVES
TABLE 167. SENSTAR CORPORATION: COMPANY SNAPSHOT
TABLE 168. SENSTAR CORPORATION: PRODUCT PORTFOLIO
TABLE 169. IDEMIA (MORPHO SA): KEY EXECUTIVES
TABLE 170. IDEMIA (MORPHO SA): COMPANY SNAPSHOT
TABLE 171. IDEMIA (MORPHO SA): PRODUCT PORTFOLIO
TABLE 172. SIEMENS AG: KEY EXECUTIVES
TABLE 173. SIEMENS AG: COMPANY SNAPSHOT
TABLE 174. SIEMENS AG: OPERATING SEGMENTS
TABLE 175. SIEMENS AG: PRODUCT PORTFOLIO
TABLE 176. SMITH’S DETECTION LLC: KEY EXECUTIVES
TABLE 177. SMITH’S DETECTION LLC.: COMPANY SNAPSHOT
TABLE 178. SMITH’S DETECTION LLC: PRODUCT PORTFOLIO
TABLE 179. CONVERGINT TECHNOLOGIES LLC: KEY EXECUTIVES
TABLE 180. CONVERGINT TECHNOLOGIES LLC: COMPANY SNAPSHOT
TABLE 181. CONVERGINT TECHNOLOGIES LLC: PRODUCT PORTFOLIO
TABLE 182. NORTHLAND CONTROL SYSTEMS, INC..: KEY EXECUTIVES
TABLE 183. NORTHLAND CONTROL SYSTEMS, INC.: COMPANY SNAPSHOT
TABLE 184. NORTHLAND CONTROL SYSTEMS, INC.: PRODUCT PORTFOLIO
TABLE 185. STANLEY SECURITY SOLUTIONS, INC: KEY EXECUTIVES
TABLE 186. STANLEY SECURITY SOLUTIONS, INC: COMPANY SNAPSHOT
TABLE 187. STANLEY SECURITY SOLUTIONS, INC: PRODUCT PORTFOLIO
TABLE 188. STANLEY SECURITY SOLUTIONS, INC: KEY STRATEGIC MOVES AND DEVELOPMENTS
TABLE 189. THALES GROUP.: KEY EXECUTIVES
TABLE 190. THALES GROUP.: COMPANY SNAPSHOT
TABLE 192. THALES GROUP PRODUCT PORTFOLIO
TABLE 193. TYCO INTERNATIONAL INC.: KEY EXECUTIVES
TABLE 194. TYCO INTERNATIONAL INC..: COMPANY SNAPSHOT
TABLE 195. JOHNSON CONTROLS.: PRODUCT PORTFOLIO
TABLE 196. TYCO INTERNATIONAL INC.: KEY STRATEGIC MOVES AND DEVELOPMENTS
TABLE 197. CGI INC.: KEY EXECUTIVES
TABLE 198. CGI INC. : COMPANY SNAPSHOT
TABLE 199. CGI INC..: PRODUCT PORTFOLIO
TABLE 200. SOPHOS GROUP LIMITED: KEY EXECUTIVES
TABLE 201. SOPHOS GROUP LIMITED: COMPANY SNAPSHOT
TABLE 202. SOPHOS GROUP LIMITED: PRODUCT PORTFOLIO
TABLE 203. BROADCOM INC.: KEY EXECUTIVES
TABLE 204. BROADCOM INC: COMPANY SNAPSHOT
TABLE 205. BROADCOM INC.: OPERATING SEGMENTS
TABLE 206. BROADCOM INC.: PRODUCT PORTFOLIO
TABLE 207. TIBCO SOFTWARE INC: KEY EXECUTIVES
TABLE 208. TIBCO SOFTWARE INC: COMPANY SNAPSHOT
TABLE 209. TIBCO SOFTWARE INC.: PRODUCT PORTFOLIO
TABLE 210. TIBCO SOFTWARE INC.: KEY STRATEGIC MOVES AND DEVELOPMENTS
TABLE 211. TREND MICRO INC,: KEY EXECUTIVES
TABLE 212. TREND MICRO INC,: COMPANY SNAPSHOT
TABLE 213. TREND MICRO INC,:PRODUCT PORTFOLIO
LIST OF FIGURES
FIGURE 01. KEY MARKET SEGMENTS
FIGURE 02. ASIA-PACIFIC PHYSICAL SECURITY MARKET SNAPSHOT, BY SEGMENT, 2019–2027
FIGURE 03. ASIA-PACIFIC PHYSICAL SECURITY MARKET SNAPSHOT, BY SEGMENT, 2019–2027
FIGURE 04. ASIA-PACIFIC PHYSICAL SECURITY MARKET SNAPSHOT, BY COUNTRY, 2019–2027
FIGURE 05. TOP IMPACTING FACTORS
FIGURE 06. TOP INVESTMENT POCKETS
FIGURE 07. MODERATE-TO-HIGH BARGAINING POWER OF SUPPLIERS
FIGURE 08. HIGH BARGAINING POWER OF BUYERS
FIGURE 09. MODERATE THREAT OF SUBSTITUTES
FIGURE 10. MODERATE-TO-HIGH THREAT OF NEW ENTRANTS
FIGURE 11. HIGH COMPETITIVE RIVALRY
FIGURE 12. MARKET DYNAMICS: ASIA-PACIFIC PHYSICAL SECURITY MARKET
FIGURE 13. VALUE CHAIN ANALYSIS
FIGURE 14. ASIA-PACIFIC PHYSICAL SECURITY MARKET, BY COMPONENT, 2019–2027 ($MILLION)
FIGURE 15. COMPARATIVE SHARE ANALYSIS OF ASIA-PACIFIC PHYSICAL SECURITY MARKET FOR SYSTEM,
BY COUNTRY, 2019 & 2027 (%)
FIGURE 16. COMPARATIVE SHARE ANALYSIS OF ASIA-PACIFIC PHYSICAL SECURITY MARKET FOR SERVICE,
BY COUNTRY, 2019 & 2027 (%)
FIGURE 17. ASIA-PACIFIC PHYSICAL SECURITY MARKET, BY SYSTEM TYPE, 2019–2027 ($MILLION)
FIGURE 18. COMPARATIVE SHARE ANALYSIS OF ASIA-PACIFIC PHYSICAL SECURITY MARKET FOR PHYSICAL ACCESS SYSTEM, BY COUNTRY 2019 & 2027 (%)
FIGURE 19. COMPARATIVE SHARE ANALYSIS OF ASIA-PACIFIC PHYSICAL SECURITY MARKET FOR VIDEO SURVEILLANCE SYSTEM, BY COUNTRY 2019 & 2027 (%)
FIGURE 20. COMPARATIVE SHARE ANALYSIS OF ASIA-PACIFIC PHYSICAL SECURITY MARKET FOR PERIMETER INTRUSION AND DETECTION, BY COUNTRY 2019 & 2027 (%)
FIGURE 21. COMPARATIVE SHARE ANALYSIS OF ASIA-PACIFIC PHYSICAL SECURITY MARKET FOR PHYSICAL SECURITY INFORMATION MANAGEMENT, BY COUNTRY, 2019 & 2027 (%)
FIGURE 22. COMPARATIVE SHARE ANALYSIS OF ASIA-PACIFIC PHYSICAL SECURITY MARKET FOR OTHERS, BY COUNTRY, 2019 & 2027 (%)
FIGURE 23. ASIA-PACIFIC PHYSICAL SECURITY MARKET, BY SERVICE TYPE, 2019–2027 ($MILLION)
FIGURE 24. COMPARATIVE SHARE ANALYSIS OF ASIA-PACIFIC PHYSICAL SECURITY MARKET FOR ACCESS CONTROL-AS-A-SERVICE, BY COUNTRY, 2019 & 2027 (%)
FIGURE 25. COMPARATIVE SHARE ANALYSIS OF ASIA-PACIFIC PHYSICAL SECURITY MARKET FOR VIDEO SURVEILLANCE-AS-A-SERVICE, BY COUNTRY, 2019 & 2027 (%)
FIGURE 26. COMPARATIVE SHARE ANALYSIS OF ASIA-PACIFIC PHYSICAL SECURITY MARKET FOR REMOTE MONITORING SERVICES SEGMENT, BY COUNTRY, 2019 & 2027 (%)
FIGURE 27. COMPARATIVE SHARE ANALYSIS OF ASIA-PACIFIC PHYSICAL SECURITY MARKET FOR SECURITY SYSTEMS INTEGRATION SERVICES, BY COUNTRY, 2019 & 2027 (%)
FIGURE 28. COMPARATIVE SHARE ANALYSIS OF ASIA-PACIFIC PHYSICAL SECURITY MARKET FOR OTHERS, BY COUNTRY, 2019 & 2027 (%)
FIGURE 29. ASIA-PACIFIC PHYSICAL SECURITY MARKET, BY ORGANIZATION SIZE, 2019–2027 ($MILLION)
FIGURE 30. COMPARATIVE SHARE ANALYSIS OF ASIA-PACIFIC PHYSICAL SECURITY MARKET FOR LARGE ENTERPRISES, BY COUNTRY, 2019 & 2027 (%)
FIGURE 31. COMPARATIVE SHARE ANALYSIS OF ASIA-PACIFIC PHYSICAL SECURITY MARKET FOR SMALL AND MEDIUM ENTERPRISES, BY COUNTRY 2019 & 2027 (%)
FIGURE 32. ASIA-PACIFIC PHYSICAL SECURITY MARKET, BY INDUSTRY VERTICAL, 2019–2027 ($MILLION)
FIGURE 33. COMPARATIVE SHARE ANALYSIS OF ASIA-PACIFIC PHYSICAL SECURITY MARKET FOR BFSI, BY COUNTRY, 2019 & 2027 (%)
FIGURE 34. COMPARATIVE SHARE ANALYSIS OF ASIA-PACIFIC PHYSICAL SECURITY MARKET FOR GOVERNMENT, BY COUNTRY, 2019 & 2027 (%)
FIGURE 35. COMPARATIVE SHARE ANALYSIS OF ASIA-PACIFIC PHYSICAL SECURITY MARKET FOR RETAIL, BY COUNTRY, 2019 & 2027 (%)
FIGURE 36. COMPARATIVE SHARE ANALYSIS OF ASIA-PACIFIC PHYSICAL SECURITY MARKET FOR TRANSPORTATION, BY COUNTRY, 2019 & 2027 (%)
FIGURE 37. COMPARATIVE SHARE ANALYSIS OF ASIA-PACIFIC PHYSICAL SECURITY MARKET FOR RESIDENTIAL, BY COUNTRY, 2019 & 2027 (%)
FIGURE 38. COMPARATIVE SHARE ANALYSIS OF ASIA-PACIFIC PHYSICAL SECURITY MARKET FOR IT AND TELECOM, BY COUNTRY, 2019 & 2027 (%)
FIGURE 39. COMPARATIVE SHARE ANALYSIS OF ASIA-PACIFIC PHYSICAL SECURITY MARKET FOR OTHERS, BY COUNTRY, 2019 & 2027 (%)
FIGURE 40. CHINA PHYSICAL SECURITY MARKET, 2019–2027 ($MILLION)
FIGURE 41. JAPAN PHYSICAL SECURITY MARKET, 2019–2027 ($MILLION)
FIGURE 42. INDIA PHYSICAL SECURITY MARKET, 2019–2027 ($MILLION)
FIGURE 43. SOUTH KOREA PHYSICAL SECURITY MARKET, 2019–2027 ($MILLION)
FIGURE 44. AUSTRALIA PHYSICAL SECURITY MARKET, 2019–2027 ($MILLION)
FIGURE 45. THAILAND PHYSICAL SECURITY MARKET, 2019–2027 ($MILLION)
FIGURE 46. SINGAPORE ASIA-PACIFIC PHYSICAL SECURITY MARKET, 2019–2027 ($MILLION)
FIGURE 47. MALAYSIA PHYSICAL SECURITY MARKET, 2019–2027 ($MILLION)
FIGURE 48. INDONESIA PHYSICAL SECURITY MARKET, 2019–2027 ($MILLION)
FIGURE 49. VIETNAM PHYSICAL SECURITY MARKET, 2019–2027 ($MILLION)
FIGURE 50. MYANMAR PHYSICAL SECURITY MARKET, 2019–2027 ($MILLION)
FIGURE 51. NEW ZEALAND PHYSICAL SECURITY MARKET, 2019–2027 ($MILLION)
FIGURE 52. REST OF ASIA-PACIFIC PHYSICAL SECURITY MARKET, 2019–2027 ($MILLION)
FIGURE 53. KEY PLAYER POSITIONING ANALYSIS: ASIA-PACIFIC PHYSICAL SECURITY MARKET
FIGURE 54. TOP WINNING STRATEGIES, BY YEAR, 2016-2021
FIGURE 55. TOP WINNING STRATEGIES, BY DEVELOPMENT, 2016-2021
FIGURE 56. TOP WINNING STRATEGIES, BY COMPANY, 2016-2021
FIGURE 57. COMPETITIVE DASHBOARD
FIGURE 58. COMPETITIVE DASHBOARD
FIGURE 59. COMPETITIVE HEATMAP OF KEY PLAYERS
FIGURE 60. CISCO SYSTEMS INC.: REVENUE, 2018–2020 ($MILLION)
FIGURE 61. CISCO SYSTEMS INC.: REVENUE SHARE BY SEGMENT, 2020 (%)
FIGURE 62. CISCO SYSTEMS INC.: REVENUE SHARE BY REGION, 2020 (%)
FIGURE 63. HONEYWELL INTERNATIONAL INC.: REVENUE, 2018–2020 ($MILLION)
FIGURE 64. HONEYWELL INTERNATIONAL INC.: REVENUE SHARE BY SEGMENT, 2020 (%)
FIGURE 65. HONEYWELL INTERNATIONAL INC.: REVENUE SHARE BY REGION, 2020 (%)
FIGURE 66. HUAWEI: REVENUE, 2017–2019 ($MILLION)
FIGURE 67. HUAWEI: REVENUE SHARE BY SEGMENT, 2019 (%)
FIGURE 68. HUAWEI: REVENUE SHARE BY REGION, 2019 (%)
FIGURE 69. NEC CORPORATION: REVENUE, 2018–2020($MILLION)
FIGURE 70. NEC CORPORATION: REVENUE BY REGION, 2020($MILLION)
FIGURE 71. JOHNSON CONTROLS: REVENUE, 2018–2020 ($MILLION)
FIGURE 72. JOHNSON CONTROLS REVENUE SHARE BY SEGMENT, 2020 (%)
FIGURE 73. JOHNSON CONTROLS REVENUE SHARE BY REGION, 2020 (%)
FIGURE 74. ANIXTER: NET SALES, 2017–2019 ($MILLION)
FIGURE 75. ANIXTER: REVENUE SHARE BY SEGMENT, 2019 (%)
FIGURE 76. ANIXTER: REVENUE SHARE BY REGION, 2019 (%)
FIGURE 77. ADT CORPORATION.: REVENUE, 2017–2019 ($MILLION)
FIGURE 78. ADT CORPORATION.: REVENUE SHARE, BY SEGMENT, 2019 (%)
FIGURE 79. ADT CORPORATION.: REVENUE SHARE, BY REGION, 2019 (%)
FIGURE 80. AXIS COMMUNICATIONS INC. NET SALES, 2017–2019 ($MILLION)
FIGURE 81. AXIS COMMUNICATIONS AB: REVENUE SHARE BY REGION, 2019 (%)
FIGURE 82. DXC TECHNOLOGY: REVENUE, 2018–2020 ($MILLION)
FIGURE 83. DXC TECHNOLOGY: REVENUE SHARE BY SEGMENT, 2020 (%)
FIGURE 84. DXC TECHNOLOGY: REVENUE SHARE BY REGION, 2020 (%)
FIGURE 85. DELL EMC CORPORATION: REVENUE, 2018–2020 ($MILLION)
FIGURE 86. DELL EMC CORPORATION: REVENUE SHARE BY SEGMENT, 2020 (%)
FIGURE 87. DELL EMC CORPORATION: REVENUE SHARE BY REGION, 2020 (%)
FIGURE 88. FLIR SYSTEMS INC: REVENUE, 2017–2019 ($MILLION)
FIGURE 89. FLIR SYSTEMS INC.: REVENUE SHARE BY SEGMENT, 2019 (%)
FIGURE 90. FLIR SYSTEMS INC.: REVENUE SHARE BY REGION, 2019 (%)
FIGURE 91. HEWLETT-PACKARD: REVENUE, 2017–2019 ($MILLION)
FIGURE 92. HEWLETT-PACKARD: REVENUE SHARE BY REGION, 2019 (%)
FIGURE 93. L3 TECHNOLOGIES: REVENUE, 2017–2019 ($MILLION)
FIGURE 94. L3 TECHNOLOGIES REVENUE SHARE BY SEGMENT, 2019 (%)
FIGURE 95. L3 HARRIS TECHNOLOGIES REVENUE SHARE BY REGION, 2019 (%)
FIGURE 96. SCHNEIDER ELECTRIC REVENUE, 2018–2019 ($MILLION)
FIGURE 97. SCHNEIDER ELECTRIC: REVENUE SHARE BY SEGMENT, 2019 (%)
FIGURE 98. SCHNEIDER ELECTRIC: REVENUE SHARE BY REGION, 2019 (%)
FIGURE 99. SIEMENS AG REVENUE, 2017–2019 ($MILLION)
FIGURE 100. SIMENS AG : REVENUE SHARE BY SEGMENT, 2019 (%)
FIGURE 101. SIMENS AG : REVENUE SHARE BY REGION, 2019 (%)
FIGURE 102. R&D EXPENDITURE, 2018–2020 ($MILLION)
FIGURE 103. THALES GROUP.: REVENUE, 2018–2020 ($MILLION)
FIGURE 104. THALES GROUP: REVENUE SHARE BY SEGMENT, 2020 (%)
FIGURE 105. THALES GROUP.: REVENUE SHARE BY REGION, 2020 (%)
FIGURE 106. CGI INC.: REVENUE, 2018–2020 ($MILLION)
FIGURE 107. CGI INC.: REVENUE SHARE BY REGION, 2019 (%)
FIGURE 108. BROADCOM INC. ; R&D EXPENDITURE, 2017–2019 ($MILLION)
FIGURE 109. BROADCOM INC.: REVENUE, 2017–2019 ($MILLION)
FIGURE 110. BROADCOM INC.: REVENUE SHARE BY SEGMENT, 2019 (%)
FIGURE 111. R&D EXPENDITURE, 2018–2020 ($MILLION)
FIGURE 112. TRENDS MICRO.: REVENUE, 2017–2019 ($MILLION)