Int'l : +1-503-894-6022 | Toll Free : +1-800-792-5285 | help@alliedmarketresearch.com
A07930 | Pages: 330 | Charts: 88 | Tables: 166 |
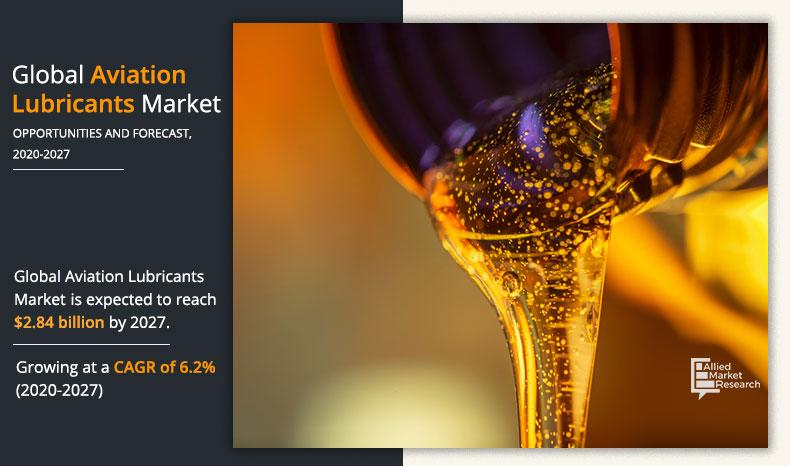
The global aviation lubricants market was valued at $2.24 billion in 2019, and is projected to reach $2.84 billion by 2027, registering a CAGR of 6.2%.Lubricants are used to reduce friction and wear between two moving parts/surface of aircrafts. Lubrication plays a vital role in safe operation of any type of aircraft and has to be replaced periodically as a part of maintenance process. In addition, use of lubricants allows aircrafts to operate at ultimate performance and efficiency.
Get more information on this report : Request Sample Pages
With the advent in COVID-19 pandemic across the globe, the aviation lubricants market has been affected as the aviation industry itself is one of the badly affected industries in most of countries across the globe, owing to the travel restrictions and government declared lockdowns. In addition, cancellation of domestic as well as international flights has affected the market growth.
The aviation lubricants market is driven by factors such as rise in number of airline passengers, coupled with increase in disposable income; increase in consumption of synthetic lubricants; and rise in number of airports. However, contamination of lubricants restrict the market growth. Moreover, rise in demand for low density lubricants for reduced weight and development of ecofriendly and safe aviation lubricants create lucrative growth opportunities for the market.
The global aviation lubricants market is segmented on the basis of type, technology, end user, application, platform, and region. By type, the market is segmented into hydraulic fluid, engine oil, grease, and special lubricants & additives. Further, by technology, it is segmented into mineral based and synthetic. By end user, it is bifurcated into OEM and aftermarket. Moreover, on the basis application, it is divided into hydraulic systems, engine, landing gear, airframe, and others. By platform, it is divided into commercial aviation, military aviation, and business & general aviation.
Region wise, the aviation lubricants market is segmented into North America, Europe, Asia-Pacific, and LAMEA including country level analysis for each region.
Some of the key players in the aviation lubricants market are Exxon Mobil Corporation, Aerospace Lubricants, Inc., The Chemours Company, Royal Dutch Shell plc, NYCO, LANXESS, LUKOIL, Nye Lubricants, Inc., Eastman Chemical Company, ROCOL, and JET-LUBE.
[TYPEGRAPH]
Get more information on this report : Request Sample Pages
Most passengers across the globe prefer to travel by air than other conventional modes of transportation such as road and sea as it is the safest and fastest mode of transportation with fewest cancelled flights. This makes air travel more reliable than other modes of transportation and offers comfortable experience during the journey. Though expensive, customers prefer air travel, owing to the rise in disposable income. Further, in accordance with data released by the International Civil Aviation Organization (ICAO), 4.3 billion passengers were carried by airlines in the year 2018. Moreover, number of airline passengers is expected to cross 10.0 billion by the year 2040, which would create need for additional aircrafts to transport passengers from point A to point B. This eventually results in increased aircraft fleet size as well as frequency of flights, which requires frequent maintenance services and in turn would boost growth of the global aviation lubricants market.
Synthetic lubricants ensure thermal stability, increased energy efficiency, better performances at extreme conditions, and resistance to oxidation, which drives growth of the global aviation lubricants market.
[TECHNOLOGYGRAPH]
Get more information on this report : Request Sample Pages
Moreover, synthetic lubricants also provide enhanced resistance to frictional wear of expensive aircraft components and higher lubricant service life, which propels growth of the global aviation lubricants market.
Air transportation is considered as the safest mode, when compared with other modes of transportation. In addition, global increase in population is anticipated to create demand for additional airports to facilitate ease for air transportation, which drives the market growth. In spite of poor sales stats of aircrafts in the year 2020, owing to the COVID-19 pandemic situation, the market conditions are expected to get back to normal and sales are expected to rise in the future. Moreover, it is anticipated that large investments in the industry would cater to needs of new airports, especially in developing countries/regions.
Moreover, most of developing countries have plans to open new airports to facilitate air transportation within and across countries. For instance, as a part of PM Narendra Modi’s vision to make India a $5 trillion economy by end of 2025, India is planning to open additional 100 airports by the end of 2024. Further, in year 2018, leading aircraft manufactures successfully delivered 1,606 commercial aircrafts and received new aircraft orders of 1,640 for year 2019. This clearly shows increase in commercial aircraft orders, which boosts growth of the market.
[REGIONGRAPH]
Get more information on this report : Request Sample Pages
Key Market Segments
Key Market Players
CHAPTER 1:INTRODUCTION
1.1.Report description
1.2.Key benefits for stakeholders
1.3.Key market segment
1.4.Research methodology
1.4.1.Primary research
1.4.2.Secondary research
1.4.3.Analyst tools and models
CHAPTER 2:EXECUTIVE SUMMARY
2.1.CXO perspective
CHAPTER 3:MARKET OVERVIEW
3.1.Market definition and scope
3.2.Key findings
3.2.1.Top impacting factors
3.2.2.Top investment pockets
3.2.3.Top winning strategies
3.3.Porter’s five forces analysis
3.4.Market share analysis (2019)
3.5.Market dynamics
3.5.1.Drivers
3.5.1.1.Rise in number of airline passengers, coupled with increased disposable income
3.5.1.2.Increase in consumption of synthetic lubricants
3.5.1.3.Rise in number of airports
3.5.2.Restraint
3.5.2.1.Contamination of lubricants
3.5.3.Opportunities
3.5.3.1.Rise in demand for low density lubricants for reduced weight
3.5.3.2.Development of ecofriendly and safe aviation lubricants
3.6.Impact of COVID-19 on the Market
3.6.1.Evolution of Outbreaks
3.6.1.1.SARS
3.6.1.2.COVID-19
3.6.2.Microeconomic Impact Analysis
3.6.2.1.Consumer trend
3.6.2.2.Technology trends
3.6.2.3.Regulatory trend
3.6.3.Macroeconomic Impact Analysis
3.6.3.1.GDP
3.6.3.2.Import/Export Analysis
3.6.3.3.Employment Index
3.6.4.Impact on the aviation industry analysis
3.6.5.Regulatory framework for solving market challenges faced by players
3.6.6.Key player strategies to tackle negative impacts in the industry
3.6.7.Opportunity analysis for players
3.7.Supply chain analysis:
3.8.Cost analysis
CHAPTER 4:GLOBAL AVIATION LUBRICANTS MARKET, BY TYPE
4.1.Overview
4.2.Hydraulic fluid
4.2.1.Key market trends, growth factors, and opportunities
4.2.2.Market size and forecast, by region
4.2.3.Market analysis, by country
4.3.Engine oil
4.3.1.Key market trends, growth factors, and opportunities
4.3.2.Market size and forecast, by region
4.3.3.Market analysis, by country
4.4.Grease
4.4.1.Key market trends, growth factors, and opportunities
4.4.2.Market size and forecast, by region
4.4.3.Market analysis, by country
4.5.Special lubricants & additives
4.5.1.Key market trends, growth factors, and opportunities
4.5.2.Market size and forecast, by region
4.5.3.Market analysis, by country
CHAPTER 5:GLOBAL AVIATION LUBRICANTS MARKET, BY TECHNOLOGY
5.1.Overview
5.2.Mineral Based
5.2.1.Key market trends, growth factors, and opportunities
5.2.2.Market size and forecast, by region
5.2.3.Market analysis, by country
5.3.Synthetic
5.3.1.Key market trends, growth factors, and opportunities
5.3.2.Market size and forecast, by region
5.3.3.Market analysis, by country
CHAPTER 6:GLOBAL AVIATION LUBRICANTS MARKET, BY END USER
6.1.Overview
6.2.OEM
6.2.1.Key market trends, growth factors, and opportunities
6.2.2.Market size and forecast, by region
6.2.3.Market analysis, by country
6.3.Aftermarket
6.3.1.Key market trends, growth factors, and opportunities
6.3.2.Market size and forecast, by region
6.3.3.Market analysis, by country
CHAPTER 7:GLOBAL AVIATION LUBRICANTS MARKET, BY APPLICATION
7.1.Overview
7.2.Hydraulic systems
7.2.1.Key market trends, growth factors, and opportunities
7.2.2.Market size and forecast, by region
7.2.3.Market analysis, by country
7.3.Engine
7.3.1.Key market trends, growth factors, and opportunities
7.3.2.Market size and forecast, by region
7.3.3.Market analysis, by country
7.4.Landing gear
7.4.1.Key market trends, growth factors, and opportunities
7.4.2.Market size and forecast, by region
7.4.3.Market analysis, by country
7.5.Airframe
7.5.1.Key market trends, growth factors, and opportunities
7.5.2.Market size and forecast, by region
7.5.3.Market analysis, by country
7.6.Others
7.6.1.Key market trends, growth factors, and opportunities
7.6.2.Market size and forecast, by region
7.6.3.Market analysis, by country
CHAPTER 8:GLOBAL AVIATION LUBRICANTS MARKET, BY PLATFORM
8.1.Overview
8.2.Commercial aviation
8.2.1.Key market trends, growth factors, and opportunities
8.2.2.Market size and forecast, by region
8.2.3.Market analysis, by country
8.3.Military aviation
8.3.1.Key market trends, growth factors, and opportunities
8.3.2.Market size and forecast, by region
8.3.3.Market analysis, by country
8.4.Business & general aviation
8.4.1.Key market trends, growth factors, and opportunities
8.4.2.Market size and forecast, by region
8.4.3.Market analysis, by country
CHAPTER 9:AVIATION LUBRICANTS MARKET, BY REGION
9.1.Overview
9.2.North America
9.2.1.Key market trends, growth factors, and opportunities
9.2.2.Market size and forecast, by type
9.2.3.Market size and forecast, by technology
9.2.4.Market size and forecast, by end user
9.2.5.Market size and forecast, by application
9.2.6.Market size and forecast, by platform
9.2.7.Market size and forecast, by country
9.2.7.1.U.S.
9.2.7.1.1.Market size and forecast, by type
9.2.7.1.2.Market size and forecast, by technology
9.2.7.1.3.Market size and forecast, by end user
9.2.7.1.4.Market size and forecast, by application
9.2.7.1.5.Market size and forecast, by platform
9.2.7.2.Canada
9.2.7.2.1.Market size and forecast, by type
9.2.7.2.2.Market size and forecast, by technology
9.2.7.2.3.Market size and forecast, by end user
9.2.7.2.4.Market size and forecast, by application
9.2.7.2.5.Market size and forecast, by platform
9.2.7.3.Mexico
9.2.7.3.1.Market size and forecast, by type
9.2.7.3.2.Market size and forecast, by technology
9.2.7.3.3.Market size and forecast, by end user
9.2.7.3.4.Market size and forecast, by application
9.2.7.3.5.Market size and forecast, by platform
9.3.Europe
9.3.1.Key market trends, growth factors, and opportunities
9.3.2.Market size and forecast, by type
9.3.3.Market size and forecast, by technology
9.3.4.Market size and forecast, by end user
9.3.5.Market size and forecast, by application
9.3.6.Market size and forecast, by platform
9.3.7.Market size and forecast, by country
9.3.7.1.U.K.
9.3.7.1.1.Market size and forecast, by type
9.3.7.1.2.Market size and forecast, by technology
9.3.7.1.3.Market size and forecast, by end user
9.3.7.1.4.Market size and forecast, by application
9.3.7.1.5.Market size and forecast, by platform
9.3.7.2.Germany
9.3.7.2.1.Market size and forecast, by type
9.3.7.2.2.Market size and forecast, by technology
9.3.7.2.3.Market size and forecast, by end user
9.3.7.2.4.Market size and forecast, by application
9.3.7.2.5.Market size and forecast, by platform
9.3.7.3.France
9.3.7.3.1.Market size and forecast, by type
9.3.7.3.2.Market size and forecast, by technology
9.3.7.3.3.Market size and forecast, by end user
9.3.7.3.4.Market size and forecast, by application
9.3.7.3.5.Market size and forecast, by platform
9.3.7.4.Italy
9.3.7.4.1.Market size and forecast, by type
9.3.7.4.2.Market size and forecast, by technology
9.3.7.4.3.Market size and forecast, by end user
9.3.7.4.4.Market size and forecast, by application
9.3.7.4.5.Market size and forecast, by platform
9.3.7.5.Russia
9.3.7.5.1.Market size and forecast, by type
9.3.7.5.2.Market size and forecast, by technology
9.3.7.5.3.Market size and forecast, by end user
9.3.7.5.4.Market size and forecast, by application
9.3.7.5.5.Market size and forecast, by platform
9.3.7.6.Rest of Europe
9.3.7.6.1.Market size and forecast, by type
9.3.7.6.2.Market size and forecast, by technology
9.3.7.6.3.Market size and forecast, by end user
9.3.7.6.4.Market size and forecast, by application
9.3.7.6.5.Market size and forecast, by platform
9.4.Asia-pacific
9.4.1.Key market trends, growth factors, and opportunities
9.4.2.Market size and forecast, by type
9.4.3.Market size and forecast, by technology
9.4.4.Market size and forecast, by end user
9.4.5.Market size and forecast, by application
9.4.6.Market size and forecast, by platform
9.4.7.Market size and forecast, by country
9.4.7.1.China
9.4.7.1.1.Market size and forecast, by type
9.4.7.1.2.Market size and forecast, by technology
9.4.7.1.3.Market size and forecast, by end user
9.4.7.1.4.Market size and forecast, by application
9.4.7.1.5.Market size and forecast, by platform
9.4.7.2.Japan
9.4.7.2.1.Market size and forecast, by type
9.4.7.2.2.Market size and forecast, by technology
9.4.7.2.3.Market size and forecast, by end user
9.4.7.2.4.Market size and forecast, by application
9.4.7.2.5.Market size and forecast, by platform
9.4.7.3.India
9.4.7.3.1.Market size and forecast, by type
9.4.7.3.2.Market size and forecast, by technology
9.4.7.3.3.Market size and forecast, by end user
9.4.7.3.4.Market size and forecast, by application
9.4.7.3.5.Market size and forecast, by platform
9.4.7.4.South Korea
9.4.7.4.1.Market size and forecast, by type
9.4.7.4.2.Market size and forecast, by technology
9.4.7.4.3.Market size and forecast, by end user
9.4.7.4.4.Market size and forecast, by application
9.4.7.4.5.Market size and forecast, by platform
9.4.7.5.Rest of Asia-Pacific
9.4.7.5.1.Market size and forecast, by type
9.4.7.5.2.Market size and forecast, by technology
9.4.7.5.3.Market size and forecast, by end user
9.4.7.5.4.Market size and forecast, by application
9.4.7.5.5.Market size and forecast, by platform
9.5.LAMEA
9.5.1.Key market trends, growth factors, and opportunities
9.5.2.Market size and forecast, by type
9.5.3.Market size and forecast, by technology
9.5.4.Market size and forecast, by end user
9.5.5.Market size and forecast, by application
9.5.6.Market size and forecast, by platform
9.5.7.Market size and forecast, by country
9.5.7.1.Latin America
9.5.7.1.1.Market size and forecast, by type
9.5.7.1.2.Market size and forecast, by technology
9.5.7.1.3.Market size and forecast, by end user
9.5.7.1.4.Market size and forecast, by application
9.5.7.1.5.Market size and forecast, by platform
9.5.7.2.Middle East
9.5.7.2.1.Market size and forecast, by type
9.5.7.2.2.Market size and forecast, by technology
9.5.7.2.3.Market size and forecast, by end user
9.5.7.2.4.Market size and forecast, by application
9.5.7.2.5.Market size and forecast, by platform
9.5.7.3.Africa
9.5.7.3.1.Market size and forecast, by type
9.5.7.3.2.Market size and forecast, by technology
9.5.7.3.3.Market size and forecast, by end user
9.5.7.3.4.Market size and forecast, by application
9.5.7.3.5.Market size and forecast, by platform
CHAPTER 10:COMPANY PROFILES
10.1.AEROSPACE LUBRICANTS, INC.
10.1.1.Company overview
10.1.2.Company snapshot
10.1.3.Product portfolio
10.1.4.Key strategic moves and developments
10.2.EASTMAN CHEMICAL COMPANY
10.2.1.Company overview
10.2.2.Company snapshot
10.2.3.Operating business segments
10.2.4.Product portfolio
10.2.5.Business performance
10.2.6.Key strategic moves and developments
10.3.EXXON MOBIL CORPORATION
10.3.1.Company overview
10.3.2.Company snapshot
10.3.3.Operating business segments
10.3.4.Product portfolio
10.3.5.Business performance
10.4.JET-LUBE (WHITMORE MANUFACTURING LLC)
10.4.1.Company overview
10.4.2.Company snapshot
10.4.3.Operating business segments
10.4.4.Product portfolio
10.4.5.Business performance
10.5.LANXESS
10.5.1.Company overview
10.5.2.Company snapshot
10.5.3.Operating business segments
10.5.4.Product portfolio
10.5.5.Business performance
10.5.6.Key strategic moves and developments
10.6.LUKOIL
10.6.1.Company overview
10.6.2.Company snapshot
10.6.3.Operating business segments
10.6.4.Business performance
10.6.5.Key strategic moves and developments
10.7.NYCO
10.7.1.Company overview
10.7.2.Company snapshot
10.7.3.Product portfolio
10.7.4.Key strategic moves and developments
10.8.NYE LUBRICANTS, INC. (FUCHS PETROLUB)
10.8.1.Company overview
10.8.2.Company snapshot
10.8.3.Operating business segments
10.8.4.Product portfolio
10.8.5.Business performance
10.8.6.Key strategic moves and developments
10.9.ROCOL
10.9.1.Company overview
10.9.2.Company snapshot
10.9.3.Operating business segments
10.9.4.Product portfolio
10.9.5.Business performance
10.10.ROYAL DUTCH SHELL PLC
10.10.1.Company overview
10.10.2.Company snapshot
10.10.3.Operating business segments
10.10.4.Product portfolio
10.10.5.Business performance
10.10.6.Key strategic moves and developments
10.11.THE CHEMOURS COMPANY
10.11.1.Company overview
10.11.2.Company snapshot
10.11.3.Operating business segments
10.11.4.Product portfolio
10.11.5.Business performance
LIST OF TABLES
TABLE 01.MACRO-ECONOMIC INDICATORS PROJECTIONS (1/2):
TABLE 02.MACRO-ECONOMIC INDICATORS PROJECTIONS (2/2):
TABLE 03.AVIATION LUBRICANTS MARKET, BY TYPE, 2019–2027 ($MILLION)
TABLE 04.AVIATION LUBRICANTS MARKET FOR HYDRAULIC FLUID, BY REGION 2019–2027 ($MILLION)
TABLE 05.AVIATION LUBRICANTS MARKET FOR ENGINE OIL, BY REGION 2019–2027 ($MILLION)
TABLE 06.AVIATION LUBRICANTS MARKET FOR GREASE, BY REGION 2019–2027 ($MILLION)
TABLE 07.AVIATION LUBRICANTS MARKET FOR SPECIAL LUBRICANTS & ADDITIVES, BY REGION 2019–2027 ($MILLION)
TABLE 08.AVIATION LUBRICANTS MARKET, BY TECHNOLOGY, 2019–2027 ($MILLION)
TABLE 09.MINERAL BASED AVIATION LUBRICANTS MARKET, BY REGION 2019–2027 ($MILLION)
TABLE 10.SYNTHETIC AVIATION LUBRICANTS MARKET, BY REGION 2019–2027 ($MILLION)
TABLE 11.AVIATION LUBRICANTS MARKET, BY END USER, 2019–2027 ($MILLION)
TABLE 12.AVIATION LUBRICANTS MARKET FOR OEM, BY REGION 2019–2027 ($MILLION)
TABLE 13.AVIATION LUBRICANTS MARKET FOR AFTERMARKET, BY REGION 2019–2027 ($MILLION)
TABLE 14.AVIATION LUBRICANTS MARKET, BY APPLICATION, 2019–2027 ($MILLION)
TABLE 15.AVIATION LUBRICANTS MARKET FOR HYDRAULIC SYSTEMS, BY REGION 2019–2027 ($MILLION)
TABLE 16.AVIATION LUBRICANTS MARKET FOR ENGINE, BY REGION 2019–2027 ($MILLION)
TABLE 17.AVIATION LUBRICANTS MARKET FOR LANDING GEAR, BY REGION 2019–2027 ($MILLION)
TABLE 18.AVIATION LUBRICANTS MARKET FOR AIRFRAME, BY REGION 2019–2027 ($MILLION)
TABLE 19.AVIATION LUBRICANTS MARKET FOR OTHERS, BY REGION 2019–2027 ($MILLION)
TABLE 20.AVIATION LUBRICANTS MARKET, BY PLATFORM, 2019–2027 ($MILLION)
TABLE 21.COMMERCIAL AVIATION LUBRICANTS MARKET, BY REGION 2019–2027 ($MILLION)
TABLE 22.MILITARY AVIATION LUBRICANTS MARKET, BY REGION 2019–2027 ($MILLION)
TABLE 23.BUSINESS & GENERAL AVIATION LUBRICANTS MARKET, BY REGION 2019–2027 ($MILLION)
TABLE 24.AVIATION LUBRICANTS MARKET, BY REGION 2019–2027 ($MILLION)
TABLE 25.NORTH AMERICA AVIATION LUBRICANTS MARKET, BY TYPE, 2019–2027 ($MILLION)
TABLE 26.NORTH AMERICA AVIATION LUBRICANTS MARKET, BY TECHNOLOGY, 2019–2027 ($MILLION)
TABLE 27.NORTH AMERICA AVIATION LUBRICANTS MARKET, BY END USER, 2019–2027 ($MILLION)
TABLE 28.NORTH AMERICA AVIATION LUBRICANTS MARKET, BY APPLICATION, 2019–2027 ($MILLION)
TABLE 29.NORTH AMERICA AVIATION LUBRICANTS MARKET, BY PLATFORM, 2019–2027 ($MILLION)
TABLE 30.U.S. AVIATION LUBRICANTS MARKET, BY TYPE, 2019–2027 ($MILLION)
TABLE 31.U.S. AVIATION LUBRICANTS MARKET, BY TECHNOLOGY, 2019–2027 ($MILLION)
TABLE 32.U.S. AVIATION LUBRICANTS MARKET, BY END USER, 2019–2027 ($MILLION)
TABLE 33.U.S. AVIATION LUBRICANTS MARKET, BY APPLICATION, 2019–2027 ($MILLION)
TABLE 34.U.S. AVIATION LUBRICANTS MARKET, BY PLATFORM, 2019–2027 ($MILLION)
TABLE 35.CANADA AVIATION LUBRICANTS MARKET, BY TYPE, 2019–2027 ($MILLION)
TABLE 36.CANADA AVIATION LUBRICANTS MARKET, BY TECHNOLOGY, 2019–2027 ($MILLION)
TABLE 37.CANADA AVIATION LUBRICANTS MARKET, BY END USER, 2019–2027 ($MILLION)
TABLE 38.CANADA AVIATION LUBRICANTS MARKET, BY APPLICATION, 2019–2027 ($MILLION)
TABLE 39.CANADA AVIATION LUBRICANTS MARKET, BY PLATFORM, 2019–2027 ($MILLION)
TABLE 40.MEXICO AVIATION LUBRICANTS MARKET, BY TYPE, 2019–2027 ($MILLION)
TABLE 41.MEXICO AVIATION LUBRICANTS MARKET, BY TECHNOLOGY, 2019–2027 ($MILLION)
TABLE 42.MEXICO AVIATION LUBRICANTS MARKET, BY END USER, 2019–2027 ($MILLION)
TABLE 43.MEXICO AVIATION LUBRICANTS MARKET, BY APPLICATION, 2019–2027 ($MILLION)
TABLE 44.MEXICO AVIATION LUBRICANTS MARKET, BY PLATFORM, 2019–2027 ($MILLION)
TABLE 45.EUROPE AVIATION LUBRICANTS MARKET, BY TYPE, 2019–2027 ($MILLION)
TABLE 46.EUROPE AVIATION LUBRICANTS MARKET, BY TECHNOLOGY, 2019–2027 ($MILLION)
TABLE 47.EUROPE AVIATION LUBRICANTS MARKET, BY END USER, 2019–2027 ($MILLION)
TABLE 48.EUROPE AVIATION LUBRICANTS MARKET, BY APPLICATION, 2019–2027 ($MILLION)
TABLE 49.EUROPE AVIATION LUBRICANTS MARKET, BY PLATFORM, 2019–2027 ($MILLION)
TABLE 50.UK AVIATION LUBRICANTS MARKET, BY TYPE, 2019–2027 ($MILLION)
TABLE 51.UK AVIATION LUBRICANTS MARKET, BY TECHNOLOGY, 2019–2027 ($MILLION)
TABLE 52.UK AVIATION LUBRICANTS MARKET, BY END USER, 2019–2027 ($MILLION)
TABLE 53.UK AVIATION LUBRICANTS MARKET, BY APPLICATION, 2019–2027 ($MILLION)
TABLE 54.UK AVIATION LUBRICANTS MARKET, BY PLATFORM, 2019–2027 ($MILLION)
TABLE 55.GERMANY AVIATION LUBRICANTS MARKET, BY TYPE, 2019–2027 ($MILLION)
TABLE 56.GERMANY AVIATION LUBRICANTS MARKET, BY TECHNOLOGY, 2019–2027 ($MILLION)
TABLE 57.GERMANY AVIATION LUBRICANTS MARKET, BY END USER, 2019–2027 ($MILLION)
TABLE 58.GERMANY AVIATION LUBRICANTS MARKET, BY APPLICATION, 2019–2027 ($MILLION)
TABLE 59.GERMANY AVIATION LUBRICANTS MARKET, BY PLATFORM, 2019–2027 ($MILLION)
TABLE 60.FRANCE AVIATION LUBRICANTS MARKET, BY TYPE, 2019–2027 ($MILLION)
TABLE 61.FRANCE AVIATION LUBRICANTS MARKET, BY TECHNOLOGY, 2019–2027 ($MILLION)
TABLE 62.FRANCE AVIATION LUBRICANTS MARKET, BY END USER, 2019–2027 ($MILLION)
TABLE 63.FRANCE AVIATION LUBRICANTS MARKET, BY APPLICATION, 2019–2027 ($MILLION)
TABLE 64.FRANCE AVIATION LUBRICANTS MARKET, BY PLATFORM, 2019–2027 ($MILLION)
TABLE 65.ITALY AVIATION LUBRICANTS MARKET, BY TYPE, 2019–2027 ($MILLION)
TABLE 66.ITALY AVIATION LUBRICANTS MARKET, BY TECHNOLOGY, 2019–2027 ($MILLION)
TABLE 67.ITALY AVIATION LUBRICANTS MARKET, BY END USER, 2019–2027 ($MILLION)
TABLE 68.ITALY AVIATION LUBRICANTS MARKET, BY APPLICATION, 2019–2027 ($MILLION)
TABLE 69.ITALY AVIATION LUBRICANTS MARKET, BY PLATFORM, 2019–2027 ($MILLION)
TABLE 70.RUSSIA AVIATION LUBRICANTS MARKET, BY TYPE, 2019–2027 ($MILLION)
TABLE 71.RUSSIA AVIATION LUBRICANTS MARKET, BY TECHNOLOGY, 2019–2027 ($MILLION)
TABLE 72.RUSSIA AVIATION LUBRICANTS MARKET, BY END USER, 2019–2027 ($MILLION)
TABLE 73.RUSSIA AVIATION LUBRICANTS MARKET, BY APPLICATION, 2019–2027 ($MILLION)
TABLE 74.RUSSIA AVIATION LUBRICANTS MARKET, BY PLATFORM, 2019–2027 ($MILLION)
TABLE 75.REST OF EUROPE AVIATION LUBRICANTS MARKET, BY TYPE, 2019–2027 ($MILLION)
TABLE 76.REST OF EUROPE AVIATION LUBRICANTS MARKET, BY TECHNOLOGY, 2019–2027 ($MILLION)
TABLE 77.REST OF EUROPE AVIATION LUBRICANTS MARKET, BY END USER, 2019–2027 ($MILLION)
TABLE 78.REST OF EUROPE AVIATION LUBRICANTS MARKET, BY APPLICATION, 2019–2027 ($MILLION)
TABLE 79.REST OF EUROPE AVIATION LUBRICANTS MARKET, BY PLATFORM, 2019–2027 ($MILLION)
TABLE 80.ASIA-PACIFIC AVIATION LUBRICANTS MARKET, BY TYPE, 2019–2027 ($MILLION)
TABLE 81.ASIA-PACIFIC AVIATION LUBRICANTS MARKET, BY TECHNOLOGY, 2019–2027 ($MILLION)
TABLE 82.ASIA-PACIFIC AVIATION LUBRICANTS MARKET, BY END USER, 2019–2027 ($MILLION)
TABLE 83.ASIA-PACIFIC AVIATION LUBRICANTS MARKET, BY APPLICATION, 2019–2027 ($MILLION)
TABLE 84.ASIA-PACIFIC AVIATION LUBRICANTS MARKET, BY PLATFORM, 2019–2027 ($MILLION)
TABLE 85.CHINA AVIATION LUBRICANTS MARKET, BY TYPE, 2019–2027 ($MILLION)
TABLE 86.CHINA AVIATION LUBRICANTS MARKET, BY TECHNOLOGY, 2019–2027 ($MILLION)
TABLE 87.CHINA AVIATION LUBRICANTS MARKET, BY END USER, 2019–2027 ($MILLION)
TABLE 88.CHINA AVIATION LUBRICANTS MARKET, BY APPLICATION, 2019–2027 ($MILLION)
TABLE 89.CHINA AVIATION LUBRICANTS MARKET, BY PLATFORM, 2019–2027 ($MILLION)
TABLE 90.JAPAN AVIATION LUBRICANTS MARKET, BY TYPE, 2019–2027 ($MILLION)
TABLE 91.JAPAN AVIATION LUBRICANTS MARKET, BY TECHNOLOGY, 2019–2027 ($MILLION)
TABLE 92.JAPAN AVIATION LUBRICANTS MARKET, BY END USER, 2019–2027 ($MILLION)
TABLE 93.JAPAN AVIATION LUBRICANTS MARKET, BY APPLICATION, 2019–2027 ($MILLION)
TABLE 94.JAPAN AVIATION LUBRICANTS MARKET, BY PLATFORM, 2019–2027 ($MILLION)
TABLE 95.INDIA AVIATION LUBRICANTS MARKET, BY TYPE, 2019–2027 ($MILLION)
TABLE 96.INDIA AVIATION LUBRICANTS MARKET, BY TECHNOLOGY, 2019–2027 ($MILLION)
TABLE 97.INDIA AVIATION LUBRICANTS MARKET, BY END USER, 2019–2027 ($MILLION)
TABLE 98.INDIA AVIATION LUBRICANTS MARKET, BY APPLICATION, 2019–2027 ($MILLION)
TABLE 99.INDIA AVIATION LUBRICANTS MARKET, BY PLATFORM, 2019–2027 ($MILLION)
TABLE 100.SOUTH KOREA AVIATION LUBRICANTS MARKET, BY TYPE, 2019–2027 ($MILLION)
TABLE 101.SOUTH KOREA AVIATION LUBRICANTS MARKET, BY TECHNOLOGY, 2019–2027 ($MILLION)
TABLE 102.SOUTH KOREA AVIATION LUBRICANTS MARKET, BY END USER, 2019–2027 ($MILLION)
TABLE 103.SOUTH KOREA AVIATION LUBRICANTS MARKET, BY APPLICATION, 2019–2027 ($MILLION)
TABLE 104.SOUTH KOREA AVIATION LUBRICANTS MARKET, BY PLATFORM, 2019–2027 ($MILLION)
TABLE 105.REST OF ASIA-PACIFIC AVIATION LUBRICANTS MARKET, BY TYPE, 2019–2027 ($MILLION)
TABLE 106.REST OF ASIA-PACIFIC AVIATION LUBRICANTS MARKET, BY TECHNOLOGY, 2019–2027 ($MILLION)
TABLE 107.REST OF ASIA-PACIFIC AVIATION LUBRICANTS MARKET, BY END USER, 2019–2027 ($MILLION)
TABLE 108.REST OF ASIA-PACIFIC AVIATION LUBRICANTS MARKET, BY APPLICATION, 2019–2027 ($MILLION)
TABLE 109.REST OF ASIA-PACIFIC AVIATION LUBRICANTS MARKET, BY PLATFORM, 2019–2027 ($MILLION)
TABLE 110.LAMEA AVIATION LUBRICANTS MARKET, BY TYPE, 2019–2027 ($MILLION)
TABLE 111.LAMEA AVIATION LUBRICANTS MARKET, BY TECHNOLOGY, 2019–2027 ($MILLION)
TABLE 112.LAMEA AVIATION LUBRICANTS MARKET, BY END USER, 2019–2027 ($MILLION)
TABLE 113.LAMEA AVIATION LUBRICANTS MARKET, BY APPLICATION, 2019–2027 ($MILLION)
TABLE 114.LAMEA AVIATION LUBRICANTS MARKET, BY PLATFORM, 2019–2027 ($MILLION)
TABLE 115.LATIN AMERICA AVIATION LUBRICANTS MARKET, BY TYPE, 2019–2027 ($MILLION)
TABLE 116.LATIN AMERICA AVIATION LUBRICANTS MARKET, BY TECHNOLOGY, 2019–2027 ($MILLION)
TABLE 117.LATIN AMERICA AVIATION LUBRICANTS MARKET, BY END USER, 2019–2027 ($MILLION)
TABLE 118.LATIN AMERICA AVIATION LUBRICANTS MARKET, BY APPLICATION, 2019–2027 ($MILLION)
TABLE 119.LATIN AMERICA AVIATION LUBRICANTS MARKET, BY PLATFORM, 2019–2027 ($MILLION)
TABLE 120.MIDDLE EAST AVIATION LUBRICANTS MARKET, BY TYPE, 2019–2027 ($MILLION)
TABLE 121.MIDDLE EAST AVIATION LUBRICANTS MARKET, BY TECHNOLOGY, 2019–2027 ($MILLION)
TABLE 122.MIDDLE EAST AVIATION LUBRICANTS MARKET, BY END USER, 2019–2027 ($MILLION)
TABLE 123.MIDDLE EAST AVIATION LUBRICANTS MARKET, BY APPLICATION, 2019–2027 ($MILLION)
TABLE 124.MIDDLE EAST AVIATION LUBRICANTS MARKET, BY PLATFORM, 2019–2027 ($MILLION)
TABLE 125.AFRICA AVIATION LUBRICANTS MARKET, BY TYPE, 2019–2027 ($MILLION)
TABLE 126.AFRICA AVIATION LUBRICANTS MARKET, BY TECHNOLOGY, 2019–2027 ($MILLION)
TABLE 127.AFRICA AVIATION LUBRICANTS MARKET, BY END USER, 2019–2027 ($MILLION)
TABLE 128.AFRICA AVIATION LUBRICANTS MARKET, BY APPLICATION, 2019–2027 ($MILLION)
TABLE 129.AFRICA AVIATION LUBRICANTS MARKET, BY PLATFORM, 2019–2027 ($MILLION)
TABLE 130.AEROSPACE LUBRICANTS, INC.: COMPANY SNAPSHOT
TABLE 131.AEROSPACE LUBRICANTS, INC.: PRODUCT PORTFOLIO
TABLE 132.AEROSPACE LUBRICANTS, INC.: KEY STRATEGIC MOVES AND DEVELOPMENTS
TABLE 133.EASTMAN CHEMICAL COMPANY: COMPANY SNAPSHOT
TABLE 134.EASTMAN CHEMICAL COMPANY: OPERATING SEGMENTS
TABLE 135.EASTMAN CHEMICAL COMPANY: PRODUCT PORTFOLIO
TABLE 136.EASTMAN CHEMICAL COMPANY: KEY STRATEGIC MOVES AND DEVELOPMENTS
TABLE 137.EXXON MOBIL CORPORATION: COMPANY SNAPSHOT
TABLE 138.EXXON MOBIL CORPORATION: OPERATING SEGMENTS
TABLE 139.EXXON MOBIL CORPORATION: PRODUCT PORTFOLIO
TABLE 140.JET-LUBE (WHITMORE MANUFACTURING LLC): COMPANY SNAPSHOT
TABLE 141.WHITMORE MANUFACTURING LLC (JET-LUBE): OPERATING SEGMENTS
TABLE 142.WHITMORE MANUFACTURING LLC (JET-LUBE): PRODUCT PORTFOLIO
TABLE 143.LANXESS: COMPANY SNAPSHOT
TABLE 144.LANXESS: OPERATING SEGMENTS
TABLE 145.LANXESS: PRODUCT PORTFOLIO
TABLE 146.LANXESS: KEY STRATEGIC MOVES AND DEVELOPMENTS
TABLE 147.LUKOIL: COMPANY SNAPSHOT
TABLE 148.LUKOIL: OPERATING SEGMENTS
TABLE 149.LUKOIL: KEY STRATEGIC MOVES AND DEVELOPMENTS
TABLE 150.NYCO: COMPANY SNAPSHOT
TABLE 151.NYCO: PRODUCT PORTFOLIO
TABLE 152.NYCO: KEY STRATEGIC MOVES AND DEVELOPMENTS
TABLE 153.NYE LUBRICANTS, INC.: COMPANY SNAPSHOT
TABLE 154.NYE LUBRICANTS, INC.: OPERATING SEGMENTS
TABLE 155.NYE LUBRICANTS, INC.: PRODUCT PORTFOLIO
TABLE 156.NYE LUBRICANTS, INC.: KEY STRATEGIC MOVES AND DEVELOPMENTS
TABLE 157.ROCOL: COMPANY SNAPSHOT
TABLE 158.ROCOL: OPERATING SEGMENTS
TABLE 159.ROCOL: PRODUCT PORTFOLIO
TABLE 160.ROYAL DUTCH SHELL PLC: COMPANY SNAPSHOT
TABLE 161.ROYAL DUTCH SHELL PLC: OPERATING SEGMENTS
TABLE 162.ROYAL DUTCH SHELL PLC: PRODUCT PORTFOLIO
TABLE 163.ROYAL DUTCH SHELL PLC: KEY STRATEGIC MOVES AND DEVELOPMENTS
TABLE 164.THE CHEMOURS COMPANY: COMPANY SNAPSHOT
TABLE 165.THE CHEMOURS COMPANY: OPERATING SEGMENTS
TABLE 166.ROYAL DUTCH SHELL PLC: PRODUCT PORTFOLIO
LIST OF FIGURES
FIGURE 01.KEY MARKET SEGMENT
FIGURE 02.EXECUTIVE SUMMARY, BY SEGMENT
FIGURE 03.EXECUTIVE SUMMARY, BY REGION
FIGURE 04.TOP IMPACTING FACTORS
FIGURE 05.TOP INVESTMENT POCKETS
FIGURE 06.TOP WINNING STRATEGIES, BY YEAR, 2017–2020*
FIGURE 07.TOP WINNING STRATEGIES, BY YEAR, 2017–2020*
FIGURE 08.TOP WINNING STRATEGIES, BY COMPANY, 2017–2020*
FIGURE 09.MODERATE-TO-HIGH BARGAINING POWER OF SUPPLIERS
FIGURE 10.HIGH-MODERATE-TO THREAT OF NEW ENTRANTS
FIGURE 11.MODERATE THREAT OF SUBSTITUTES
FIGURE 12.MODERATE-TO-HIGH INTENSITY OF RIVALRY
FIGURE 13.MODERATE BARGAINING POWER OF BUYERS
FIGURE 14.MARKET SHARE ANALYSIS (2019)
FIGURE 15.SUPPLY CHAIN ANALYSIS (PHASE 1):
FIGURE 16.SUPPLY CHAIN ANALYSIS (PHASE 2):
FIGURE 17.SUPPLY CHAIN ANALYSIS (PHASE 3):
FIGURE 18.GLOBAL COST BREAK-UP OF AIRLINES:
FIGURE 19.AVIATION LUBRICANTS MARKET SHARE, BY TYPE, 2019–2027 (%)
FIGURE 20.COMPARATIVE SHARE ANALYSIS OF AVIATION LUBRICANTS MARKET FOR HYDRAULIC FLUID, BY COUNTRY, 2019 & 2027 (%)
FIGURE 21.COMPARATIVE SHARE ANALYSIS OF AVIATION LUBRICANTS MARKET FOR ENGINE OIL, BY COUNTRY, 2019 & 2027 (%)
FIGURE 22.COMPARATIVE SHARE ANALYSIS OF AVIATION LUBRICANTS MARKET FOR GREASE, BY COUNTRY, 2019 & 2027 (%)
FIGURE 23.COMPARATIVE SHARE ANALYSIS OF AVIATION LUBRICANTS MARKET FOR SPECIAL LUBRICANTS & ADDITIVES, BY COUNTRY, 2019 & 2027 (%)
FIGURE 24.AVIATION LUBRICANTS MARKET SHARE, BY TECHNOLOGY, 2019–2027 (%)
FIGURE 25.COMPARATIVE SHARE ANALYSIS OF MINERAL BASED AVIATION LUBRICANTS MARKET, BY COUNTRY, 2019 & 2027 (%)
FIGURE 26.COMPARATIVE SHARE ANALYSIS OF SYNTHETIC AVIATION LUBRICANTS MARKET, BY COUNTRY, 2019 & 2027 (%)
FIGURE 27.AVIATION LUBRICANTS MARKET SHARE, BY END USER, 2019–2027 (%)
FIGURE 28.COMPARATIVE SHARE ANALYSIS OF AVIATION LUBRICANTS MARKET FOR OEM, BY COUNTRY, 2019 & 2027 (%)
FIGURE 29.COMPARATIVE SHARE ANALYSIS OF AVIATION LUBRICANTS MARKET FOR AFTERMARKET, BY COUNTRY, 2019 & 2027 (%)
FIGURE 30.AVIATION LUBRICANTS MARKET SHARE, BY APPLICATION, 2019–2027 (%)
FIGURE 31.COMPARATIVE SHARE ANALYSIS OF AVIATION LUBRICANTS MARKET FOR HYDRAULIC SYSTEMS, BY COUNTRY, 2019 & 2027 (%)
FIGURE 32.COMPARATIVE SHARE ANALYSIS OF AVIATION LUBRICANTS MARKET FOR ENGINE, BY COUNTRY, 2019 & 2027 (%)
FIGURE 33.COMPARATIVE SHARE ANALYSIS OF AVIATION LUBRICANTS MARKET FOR LANDING GEAR, BY COUNTRY, 2019 & 2027 (%)
FIGURE 34.COMPARATIVE SHARE ANALYSIS OF AVIATION LUBRICANTS MARKET FOR AIRFRAME, BY COUNTRY, 2019 & 2027 (%)
FIGURE 35.COMPARATIVE SHARE ANALYSIS OF AVIATION LUBRICANTS MARKET FOR OTHERS, BY COUNTRY, 2019 & 2027 (%)
FIGURE 36.AVIATION LUBRICANTS MARKET SHARE, BY PLATFORM, 2019–2027 (%)
FIGURE 37.COMPARATIVE SHARE ANALYSIS OF COMMERCIAL AVIATION LUBRICANTS MARKET, BY COUNTRY, 2019 & 2027 (%)
FIGURE 38.COMPARATIVE SHARE ANALYSIS OF MILITARY AVIATION LUBRICANTS MARKET, BY COUNTRY, 2019 & 2027 (%)
FIGURE 39.COMPARATIVE SHARE ANALYSIS OF BUSINESS & GENERAL AVIATION LUBRICANTS MARKET, BY COUNTRY, 2019 & 2027 (%)
FIGURE 40.AVIATION LUBRICANTS MARKET, BY REGION, 2019–2027 (%)
FIGURE 41.COMPARATIVE SHARE ANALYSIS OF AVIATION LUBRICANTS MARKET, BY COUNTRY, 2019–2027 (%)
FIGURE 42.U.S. AVIATION LUBRICANTS MARKET, 2019–2027 ($MILLION)
FIGURE 43.CANADA AVIATION LUBRICANTS MARKET, 2019–2027 ($MILLION)
FIGURE 44.MEXICO AVIATION LUBRICANTS MARKET, 2019–2027 ($MILLION)
FIGURE 45.COMPARATIVE SHARE ANALYSIS OF AVIATION LUBRICANTS MARKET, BY COUNTRY, 2019–2027 (%)
FIGURE 46.UK AVIATION LUBRICANTS MARKET, 2019–2027 ($MILLION)
FIGURE 47.GERMANY AVIATION LUBRICANTS MARKET, 2019–2027 ($MILLION)
FIGURE 48.FRANCE AVIATION LUBRICANTS MARKET, 2019–2027 ($MILLION)
FIGURE 49.ITALY AVIATION LUBRICANTS MARKET, 2019–2027 ($MILLION)
FIGURE 50.RUSSIA AVIATION LUBRICANTS MARKET, 2019–2027 ($MILLION)
FIGURE 51.REST OF EUROPE AVIATION LUBRICANTS MARKET, 2019–2027 ($MILLION)
FIGURE 52.COMPARATIVE SHARE ANALYSIS OF AVIATION LUBRICANTS MARKET, BY COUNTRY, 2019–2027 (%)
FIGURE 53.CHINA AVIATION LUBRICANTS MARKET, 2019–2027 ($MILLION)
FIGURE 54.JAPAN AVIATION LUBRICANTS MARKET, 2019–2027 ($MILLION)
FIGURE 55.INDIA AVIATION LUBRICANTS MARKET, 2019–2027 ($MILLION)
FIGURE 56.SOUTH KOREA AVIATION LUBRICANTS MARKET, 2019–2027 ($MILLION)
FIGURE 57.REST OF ASIA-PACIFIC AVIATION LUBRICANTS MARKET, 2019–2027 ($MILLION)
FIGURE 58.COMPARATIVE SHARE ANALYSIS OF AVIATION LUBRICANTS MARKET, BY COUNTRY, 2019–2027 (%)
FIGURE 59.LATIN AMERICA AVIATION LUBRICANTS MARKET, 2019–2027 ($MILLION)
FIGURE 60.MIDDLE EAST AVIATION LUBRICANTS MARKET, 2019–2027 ($MILLION)
FIGURE 61.AFRICA AVIATION LUBRICANTS MARKET, 2019–2027 ($MILLION)
FIGURE 62.EASTMAN CHEMICAL COMPANY: NET SALES, 2017–2019 ($MILLION)
FIGURE 63.EASTMAN CHEMICAL COMPANY: REVENUE SHARE, BY SEGMENT, 2019 (%)
FIGURE 64.EASTMAN CHEMICAL COMPANY: REVENUE SHARE, BY REGION, 2019 (%)
FIGURE 65.EXXON MOBIL CORPORATION: NET SALES, 2017–2019 ($MILLION)
FIGURE 66.EXXON MOBIL CORPORATION: REVENUE SHARE, BY SEGMENT, 2019 (%)
FIGURE 67.EXXON MOBIL CORPORATION: REVENUE SHARE, BY REGION, 2019 (%)
FIGURE 68.THE CHEMOURS COMPANY: NET SALES, 2018–2020 ($MILLION)
FIGURE 69.WHITMORE MANUFACTURING LLC (JET-LUBE): REVENUE SHARE, BY SEGMENT, 2020 (%)
FIGURE 70.WHITMORE MANUFACTURING LLC (JET-LUBE): REVENUE SHARE, BY REGION, 2020 (%)
FIGURE 71.LANXESS: NET SALES, 2017–2019 ($MILLION)
FIGURE 72.LANXESS: REVENUE SHARE, BY SEGMENT, 2019 (%)
FIGURE 73.LANXESS: REVENUE SHARE, BY REGION, 2019 (%)
FIGURE 74.LUKOIL: NET SALES, 2017–2019 ($MILLION)
FIGURE 75.LUKOIL: REVENUE SHARE, BY SEGMENT, 2019 (%)
FIGURE 76.LUKOIL: REVENUE SHARE, BY REGION, 2019 (%)
FIGURE 77.NYE LUBRICANTS, INC.: NET SALES, 2017–2019 ($MILLION)
FIGURE 78.NYE LUBRICANTS, INC.: REVENUE SHARE, BY SEGMENT, 2019 (%)
FIGURE 79.NYE LUBRICANTS, INC.: REVENUE SHARE, BY REGION, 2019 (%)
FIGURE 80.ROCOL: NET SALES, 2017–2019 ($MILLION)
FIGURE 81.ROCOL: REVENUE SHARE, BY SEGMENT, 2019 (%)
FIGURE 82.ROCOL: REVENUE SHARE, BY REGION, 2019 (%)
FIGURE 83.ROYAL DUTCH SHELL PLC: NET SALES, 2017–2019 ($MILLION)
FIGURE 84.ROYAL DUTCH SHELL PLC: REVENUE SHARE, BY SEGMENT, 2019 (%)
FIGURE 85.ROYAL DUTCH SHELL PLC: REVENUE SHARE, BY REGION, 2019 (%)
FIGURE 86.THE CHEMOURS COMPANY: NET SALES, 2017–2019 ($MILLION)
FIGURE 87.THE CHEMOURS COMPANY: REVENUE SHARE, BY SEGMENT, 2019 (%)
FIGURE 88.THE CHEMOURS COMPANY: REVENUE SHARE, BY REGION, 2019 (%)