Int'l : +1-503-894-6022 | Toll Free : +1-800-792-5285 | help@alliedmarketresearch.com
A06326 | Pages: 250 | Charts: 46 | Tables: 87 |
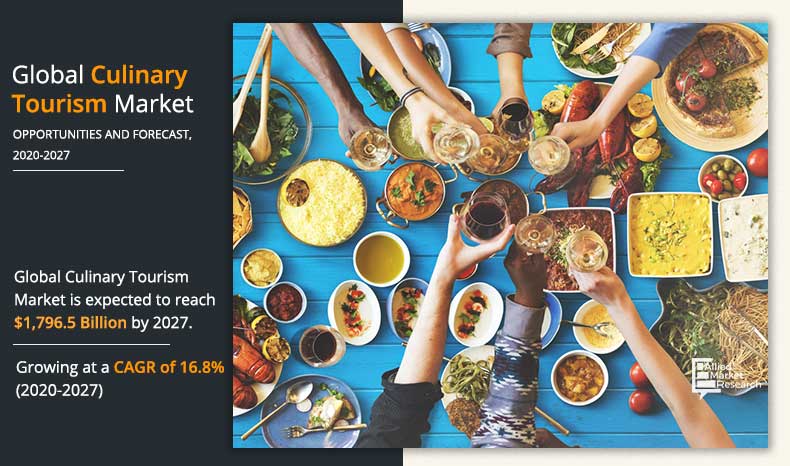
The global culinary tourism market size was valued at $1,116.7 billion in 2019, and is projected to reach $1,796.5 billion by 2027, registering a CAGR of 16.8% from 2020 to 2027. The food festival segment was the highest contributor to the market, with $338.6 billion in 2019, and is estimated to reach $560.3 billion by 2027, at a CAGR of 17.2% during the forecast period. The culinary tourism market growth can be attributed to rise in instances of people opting for unique and exotic holiday destinations, to get away from the daily hectic schedule and gain valuable experiences. Private, quite, serene, and exotic locations with a prevalent food culture are the major factors that people consider while choosing their travel location. Regions with large variety of food and drinks that taste unique have been voted as top preference by the travelers.
Social media is increasingly becoming a pseudo-travel agent. Customers are increasingly opting for travel services and products by taking advice from the people who have either stayed or traveled there before. They also refer to reviews and insights detailed on various social networking sites. Views and opinions shared on sites offer better transparency with respect to products and thus, encourage travelers to make bookings for their preferred travel location.
However, political unrest and terrorism have affected the overall volume of foreign trips and choice of destination and are the major restraining factors for the culinary tourism market. On the contrary, increase in affordability and convenience in finding accommodation is expected to encourage budget travelers to tour more often, and make way for growth of the culinary tourism market.
Get more information on this report : Request Sample Pages
The culinary tourism market is segmented based on activity type, age group, mode of booking, and region. By activity type, the market has been classified into culinary trials, cooking classes, restaurants, food festivals and others. By age group, it is categorized into Baby Boomers, Generation X, Generation Y, and Generation Z. The Mode of Booking segment includes OTA, traditional agents and direct travel. Based on region, the culinary tourism market is studied across North America, Europe, Asia-Pacific, and LAMEA.
[ACTIVITYTYPEGRAPH]
Get more information on this report : Request Sample Pages
Based on the culinary tourism market analysis, by activity type, the food festival segment was the most prominent segment accounting for the highest share in 2019 and is expected to continue this trend throughout the forecast period. The growth in this segment can be attributed to growing affinity of tourists in exotic cuisines and drinks.
Moreover, culinary trials allow the tourist to experience various tastes in a region while exploring different cities in a short amount of time by making most of their vacation time; hence, this segment is a preferred choice for tourists who want to experience more of the culture in a relatively short time. However, the cooking classes segment is expected to experience the fastest growth rate of 17.2% through the forecast period
[MODEOFBOOKINGGRAPH]
Get more information on this report : Request Sample Pages
Based on the culinary tourism market forecast, by age group the generation Y segment was the dominant segment with majority of the market share in 2019 and is estimated to remain dominant throughout the forecast period. This can be attributed to millennial being avid travelers comprising large number of people traveling worldwide. Millennial are driven by wanderlust and breaking life’s monotony, these group of youngsters prefer short trips to culturally rich and different countries, also local shopping and food are among major attractions for this demographic cohort. The generation z segment is estimated to grow at a notable growth rate of 17.6% through the forecast period.
[REGIONGRAPH]
Get more information on this report : Request Sample Pages
Based on the mode of booking, the OTA segment was the most prominent segment in 2019 and is expected to grow at the highest CAGR of 17.9% through the forecast period. This can be attributed to growing adoption of smartphones as a way to make travel arrangements. Moreover, this mode of booking is very convenient and various offers by the agencies encourage tourists to opt for the OTA mode of booking.
By region, Asia-Pacific was the most prominent region in the culinary tourism market and is expected to garner high growth rate in the forecast period. The North America culinary tourism market is also expected to witness steady growth rate through the forecast period owing to presence of a large number of traditional food outlets and easy availability of accommodation.
The players in the culinary tourism industry have adopted product launch as their key development strategy to increase profitability and improve their stance in the culinary tourism market share. The key players profiled in the report include Abercrombie & Kent USA, Classic Journeys, G Adventures, Greaves Travel, India Food Tour, ITC Travel Group Limited, The FTC4Lobe Group, The Travel Corporation, Topdeck Travel, and Tour Radar.
The report provides a quantitative analysis of the current culinary tourism market trends, estimations, and dynamics of the market size from 2019 to 2027 to identify the prevailing opportunities.
Porter’s five forces analysis highlights the potency of the buyers and suppliers to enable stakeholders to make profit-oriented business decisions and strengthen their supplier–buyer network.
In-depth analysis and the market size and segmentation assists in determining the prevailing culinary tourism market opportunities.
The major countries in each region are mapped according to their revenue contribution to the market.
The market player positioning segment facilitates benchmarking and provides a clear understanding of the present position of the market players in the industry.
Key Market Segments
Key Market Players
CHAPTER 1:INTRODUCTION
1.1.Report description
1.2.Key Benefits
1.3.Key Market Segments
1.4.Research Methodology
1.4.1.Secondary research
1.4.2.Primary research
1.4.3.Analyst tools and models
CHAPTER 2:EXECUTIVE SUMMARY
2.1.CXO perspective
CHAPTER 3:MARKET OVERVIEW
3.1.Market definition and scope
3.2.Key findings
3.2.1.Top investment pockets
3.2.2.Top impacting factors
3.3.Porter's five forces analysis
3.3.1.Bargaining power of suppliers
3.3.2.Bargaining power of buyers
3.3.3.Threat of substitution
3.3.4.Threat of new entrants
3.3.5.Intensity of competitive rivalry
3.4.Market dynamics
3.4.1.Drivers
3.4.1.1.Pursuit of unique experiences to augment the global tourism industry
3.4.1.2.Mobile applications, big data analytics, and artificial intelligence evolving together amidst proliferating tourism industry
3.4.1.3.Rise of social media positively impacting the travel industry
3.4.2.Restraint
3.4.2.1.Increase in terrorism & crime rate, political uncertainty, and natural calamities
3.4.2.2.Nature and tourism no longer in sync
3.4.3.Opportunity
3.4.3.1.Unique Destinations gaining high traction among tourists
3.4.3.2.Option for convenient and budget friendly accommodation
3.5.COVID Analysis
3.5.1.Introduction
3.5.2.Impact on the Food & Beverage Industry
3.5.3.Impact on the Culinary Tourism Market
3.6.Regulatory analysis
3.6.1.Overview
3.6.2.Culinary tourism regulatory analysis
3.6.2.1.Culinary Tourism Market: Policy Implication
3.6.2.2.Culinary Tourism Market: Quality Standards
3.6.2.3.Culinary Tourism Market: Food Safety & Hygiene
3.6.2.4.Culinary Tourism Market: Authenticity in Food Experiences
3.7.Consumer Preference Analysis
3.7.1.1.What motivates culinary travel among tourists?
3.7.1.2.What is most preferred channel of booking?
3.7.1.3.What are the different culinary traveler profiles?
3.7.1.4.What kind of culinary travel do tourists prefer?
CHAPTER 4:CULINARY TOURISM MARKET, BY ACTIVITY TYPE
4.1.Overview
4.1.1.Market size and forecast, by activity type
4.2.Culinary Trials
4.2.1.Key market trends, growth factors, and opportunities
4.2.2.Market size and forecast, by region
4.2.3.Market size and forecast, by country
4.3.Cooking Classes
4.3.1.Key market trends, growth factors, and opportunities
4.3.2.Market size and forecast, by region
4.3.3.Market size and forecast, by country
4.4.Restaurants
4.4.1.Key market trends, growth factors, and opportunities
4.4.2.Market size and forecast, by region
4.4.3.Market size and forecast, by country
4.5.Food Festival
4.5.1.Key market trends, growth factors, and opportunities
4.5.2.Market size and forecast, by region
4.5.3.Market size and forecast, by country
4.6.Others
4.6.1.Key market trends, growth factors, and opportunities
4.6.2.Market size and forecast, by region
4.6.3.Market size and forecast, by country
CHAPTER 5:CULINARY TOURISM MARKET, BY AGE GROUP
5.1.Overview
5.1.1.Market size and forecast, by age group
5.2.Baby Boomers
5.2.1.Key market trends, growth factors, and opportunities
5.2.2.Market size and forecast, by region
5.2.3.Market size and forecast, by country
5.3.Generation X
5.3.1.Key market trends, growth factors, and opportunities
5.3.2.Market size and forecast, by region
5.3.3.Market size and forecast, by country
5.4.Generation Y
5.4.1.Key market trends, growth factors, and opportunities
5.4.2.Market size and forecast, by region
5.4.3.Market size and forecast, by country
5.5.Generation Z
5.5.1.Key market trends, growth factors, and opportunities
5.5.2.Market size and forecast, by region
5.5.3.Market size and forecast, by country
CHAPTER 6:CULINARY TOURISM MARKET, BY MODE OF BOOKING
6.1.Overview
6.1.1.Market size and forecast, by Mode of Booking
6.2.(OTA) Online Travel Agents
6.2.1.Key market trends, growth factors, and opportunities
6.2.2.Market size and forecast, by region
6.2.3.Market size and forecast, by country
6.3.Traditional Agents
6.3.1.Key market trends, growth factors, and opportunities
6.3.2.Market size and forecast, by region
6.3.3.Market size and forecast, by country
6.4.Direct Booking
6.4.1.Key market trends, growth factors, and opportunities
6.4.2.Market size and forecast, by region
6.4.3.Market size and forecast, by country
CHAPTER 7:CULINARY TOURISM MARKET, BY REGION
7.1.Overview
7.1.1.Market size and forecast, by region
7.2.North America
7.2.1.Key market trends, growth factors, and opportunities
7.2.2.Market size and forecast, by activity type
7.2.3.Market size and forecast, by age group
7.2.4.Market size and forecast, by mode of booking
7.2.5.Market size and forecast, by country
7.2.5.1.U.S.
7.2.5.1.1.Market size and forecast, by activity type
7.2.5.1.2.Market size and forecast, by age group
7.2.5.1.3.Market size and forecast, by mode of booking
7.2.5.2.Canada
7.2.5.2.1.Market size and forecast, by activity type
7.2.5.2.2.Market size and forecast, by age group
7.2.5.2.3.Market size and forecast, by mode of booking
7.2.5.3.Mexico
7.2.5.3.1.Market size and forecast, by activity type
7.2.5.3.2.Market size and forecast, by age group
7.2.5.3.3.Market size and forecast, by mode of booking
7.3.Europe
7.3.1.Key market trends, growth factors, and opportunities
7.3.2.Market size and forecast, by activity type
7.3.3.Market size and forecast, by age group
7.3.4.Market size and forecast, by mode of booking
7.3.5.Market size and forecast, by country
7.3.5.1.Germany
7.3.5.1.1.Market size and forecast, by activity type
7.3.5.1.2.Market size and forecast, by age group
7.3.5.1.3.Market size and forecast, by mode of booking
7.3.5.2.UK
7.3.5.2.1.Market size and forecast, by activity type
7.3.5.2.2.Market size and forecast, by age group
7.3.5.2.3.Market size and forecast, by mode of booking
7.3.5.3.France
7.3.5.3.1.Market size and forecast, by activity type
7.3.5.3.2.Market size and forecast, by age group
7.3.5.3.3.Market size and forecast, by mode of booking
7.3.5.4.Italy
7.3.5.4.1.Market size and forecast, by activity type
7.3.5.4.2.Market size and forecast, by age group
7.3.5.4.3.Market size and forecast, by mode of booking
7.3.5.5.Spain
7.3.5.5.1.Market size and forecast, by activity type
7.3.5.5.2.Market size and forecast, by age group
7.3.5.5.3.Market size and forecast, by mode of booking
7.3.5.6.Rest of Europe
7.3.5.6.1.Market size and forecast, by activity type
7.3.5.6.2.Market size and forecast, by age group
7.3.5.6.3.Market size and forecast, by mode of booking
7.4.Asia-Pacific
7.4.1.Key market trends, growth factors, and opportunities
7.4.2.Market size and forecast, by activity type
7.4.3.Market size and forecast, by age group
7.4.4.Market size and forecast, by mode of booking
7.4.5.Market size and forecast, by country
7.4.5.1.China
7.4.5.1.1.Market size and forecast, by activity type
7.4.5.1.2.Market size and forecast, by age group
7.4.5.1.3.Market size and forecast, by mode of booking
7.4.5.2.India
7.4.5.2.1.Market size and forecast, by activity type
7.4.5.2.2.Market size and forecast, by age group
7.4.5.2.3.Market size and forecast, by mode of booking
7.4.5.3.Japan
7.4.5.3.1.Market size and forecast, by activity type
7.4.5.3.2.Market size and forecast, by age group
7.4.5.3.3.Market size and forecast, by mode of booking
7.4.5.4.ASEAN
7.4.5.4.1.Market size and forecast, by activity type
7.4.5.4.2.Market size and forecast, by age group
7.4.5.4.3.Market size and forecast, by mode of booking
7.4.5.5.South Korea
7.4.5.5.1.Market size and forecast, by activity type
7.4.5.5.2.Market size and forecast, by age group
7.4.5.5.3.Market size and forecast, by mode of booking
7.4.5.6.Rest of Asia-Pacific
7.4.5.6.1.Market size and forecast, by activity type
7.4.5.6.2.Market size and forecast, by age group
7.4.5.6.3.Market size and forecast, by mode of booking
7.5.LAMEA
7.5.1.Key market trends, growth factors, and opportunities
7.5.2.Market size and forecast, by activity type
7.5.3.Market size and forecast, by age group
7.5.4.Market size and forecast, by mode of booking
7.5.5.Market size and forecast, by country
7.5.5.1.Latin America
7.5.5.1.1.Market size and forecast, by activity type
7.5.5.1.2.Market size and forecast, by age group
7.5.5.1.3.Market size and forecast, by mode of booking
7.5.5.2.Middle East
7.5.5.2.1.Market size and forecast, by activity type
7.5.5.2.2.Market size and forecast, by age group
7.5.5.2.3.Market size and forecast, by mode of booking
7.5.5.3.Africa
7.5.5.3.1.Market size and forecast, by activity type
7.5.5.3.2.Market size and forecast, by age group
7.5.5.3.3.Market size and forecast, by mode of booking
CHAPTER 8:COMPETITION LANDSCAPE
8.1.Competitive dashboard
8.2.Competitive heatmap
CHAPTER 9:COMPANY PROFILES
9.1.ABERCROMBIE & KENT USA, LLC
9.1.1.Company overview
9.1.2.Key Executives
9.1.3.Company snapshot
9.1.4.Product portfolio
9.2.CLASSIC JOURNEYS, LLC
9.2.1.Company overview
9.2.2.Key Executive
9.2.3.Company snapshot
9.2.4.Product portfolio
9.3.G ADVENTURES
9.3.1.Company overview
9.3.2.Key Executive
9.3.3.Company snapshot
9.3.4.Product portfolio
9.4.GREAVES TRAVEL LTD
9.4.1.Company overview
9.4.2.Key Executives
9.4.3.Company snapshot
9.4.4.Product portfolio
9.5.INDIA FOOD TOUR
9.5.1.Company overview
9.5.2.Key Executives
9.5.3.Company snapshot
9.5.4.Product portfolio
9.6.ITC TRAVEL GROUP LIMITED
9.6.1.Company overview
9.6.2.Key Executives
9.6.3.Company snapshot
9.6.4.Product portfolio
9.7.FOOD TOUR CORPORATION
9.7.1.Company overview
9.7.2.Company snapshot
9.7.3.Product portfolio
9.8.THE TRAVEL CORPORATION
9.8.1.Company overview
9.8.2.Key Executive
9.8.3.Company snapshot
9.8.4.Product portfolio
9.9.TOPDECK TRAVEL [FLIGHT CENTRE (UK) LIMITED)]
9.9.1.Company overview
9.9.2.Company snapshot
9.9.3.Product portfolio
9.10.TOURRADAR GmbH
9.10.1.Company overview
9.10.2.Key Executives
9.10.3.Company snapshot
9.10.4.Product portfolio
LIST OF TABLES
TABLE 01.CULINARY TOURISM MARKET REVENUE, BY ACTIVITY TYPE, 2019-2027 ($BILLION)
TABLE 02.CULINARY TOURISM MARKET REVENUE FOR CULINARY TRIALS, BY REGION, 2019-2027 ($BILLION)
TABLE 03.CULINARY TOURISM MARKET REVENUE FOR COOKING CLASSES, BY REGION, 2019-2027 ($BILLION)
TABLE 04.CULINARY TOURISM MARKET REVENUE FOR RESTAURANTS, BY REGION, 2019-2027 ($BILLION)
TABLE 05.TOP FOOD FESTIVALS AROUND THE WORLD
TABLE 06.CULINARY TOURISM MARKET REVENUE FOR FOOD FESTIVAL, BY REGION, 2019-2027 ($BILLION)
TABLE 07.CULINARY TOURISM MARKET REVENUE FOR OTHERS, BY REGION, 2019-2027 ($BILLION)
TABLE 08.CULINARY TOURISM MARKET REVENUE, BY AGE GROUP, 2019-2027 ($BILLION)
TABLE 09.CULINARY TOURISM MARKET REVENUEFOR BABY BOOMERS, BY REGION, 2019-2027 ($BILLION)
TABLE 10.CULINARY TOURISM MARKET REVENUE FORGENERATION X, BY REGION, 2019-2027 ($BILLION)
TABLE 11.CULINARY TOURISM MARKET REVENUE FOR GENERATION Y, BY REGION, 2019-2027 ($BILLION)
TABLE 12.CULINARY TOURISM MARKET REVENUE FORGENERATION Z, BY REGION, 2019-2027 ($BILLION)
TABLE 13.CULINARY TOURISM MARKET, BY MODE OF BOOKING, 2019-2027 ($BILLION)
TABLE 14.CULINARY TOURISM MARKET REVENUE FROMOTA, BY REGION, 2019-2027 ($BILLION)
TABLE 15.CULINARY TOURISM MARKET REVENUE FROMTRADITIONAL AGENTS, BY REGION, 2019-2027 ($BILLION)
TABLE 16.CULINARY TOURISM MARKET REVENUE FROMDIRECT BOOKING, BY REGION, 2019-2027 ($BILLION)
TABLE 17.CULINARY TOURISM MARKET REVENUE, BY REGION, 2019-2027 ($BILLION)
TABLE 18.NORTH AMERICA CULINARY TOURISM MARKET REVENUE, BY ACTIVITY TYPE, 2019-2027 ($BILLION)
TABLE 19.NORTH AMERICA CULINARY TOURISM MARKET REVENUE, BY AGE GROUP, 2019-2027 ($BILLION)
TABLE 20.NORTH AMERICA CULINARY TOURISM MARKET REVENUE, BY MODE OF BOOKING, 2019-2027 ($BILLION)
TABLE 21.NORTH AMERICA CULINARY TOURISM MARKET, BY COUNTRY, 2019-2027 ($BILLION)
TABLE 22.U.S.CULINARY TOURISM MARKET REVENUE, BY ACTIVITY TYPE, 2019-2027 ($BILLION)
TABLE 23.U.S.CULINARY TOURISM MARKET REVENUE, BY AGE GROUP, 2019-2027 ($BILLION)
TABLE 24.U.S.CULINARY TOURISM MARKET REVENUE, BY MODE OF BOOKING, 2019-2027 ($BILLION)
TABLE 25.CANADA CULINARY TOURISM MARKET REVENUE, BY ACTIVITY TYPE, 2019-2027 ($BILLION)
TABLE 26.CANADACULINARY TOURISM MARKET REVENUE, BY AGE GROUP, 2019-2027 ($BILLION)
TABLE 27.CANADACULINARY TOURISM MARKET REVENUE, BY MODE OF BOOKING, 2019-2027 ($BILLION)
TABLE 28.MEXICOCULINARY TOURISM MARKET REVENUE, BY ACTIVITY TYPE, 2019-2027 ($BILLION)
TABLE 29.MEXICOCULINARY TOURISM MARKET REVENUE, BY AGE GROUP, 2019-2027 ($BILLION)
TABLE 30.MEXICOCULINARY TOURISM MARKET REVENUE, BY MODE OF BOOKING, 2019-2027 ($BILLION)
TABLE 31.EUROPECULINARY TOURISM MARKET REVENUE, BY ACTIVITY TYPE, 2019-2027 ($BILLION)
TABLE 32.EUROPE CULINARY TOURISM MARKET REVENUE, BY AGE GROUP, 2019-2027 ($BILLION)
TABLE 33.EUROPE CULINARY TOURISM MARKET REVENUE, BY MODE OF BOOKING, 2019-2027 ($BILLION)
TABLE 34.EUROPECULINARY TOURISM MARKET, BY COUNTRY, 2019-2027 ($BILLION)
TABLE 35.GERMANYCULINARY TOURISM MARKET REVENUE, BY ACTIVITY TYPE, 2019-2027 ($BILLION)
TABLE 36.GERMANYCULINARY TOURISM MARKET REVENUE, BY AGE GROUP, 2019-2027 ($BILLION)
TABLE 37.GERMANYCULINARY TOURISM MARKET REVENUE, BY MODE OF BOOKING, 2019-2027 ($BILLION)
TABLE 38.UKCULINARY TOURISM MARKET REVENUE, BY ACTIVITY TYPE, 2019-2027 ($BILLION)
TABLE 39.UKCULINARY TOURISM MARKET REVENUE, BY AGE GROUP, 2019-2027 ($BILLION)
TABLE 40.UKCULINARY TOURISM MARKET REVENUE, BY MODE OF BOOKING, 2019-2027 ($BILLION)
TABLE 41.FRANCECULINARY TOURISM MARKET REVENUE, BY ACTIVITY TYPE, 2019-2027 ($BILLION)
TABLE 42.FRANCECULINARY TOURISM MARKET REVENUE, BY AGE GROUP, 2019-2027 ($BILLION)
TABLE 43.FRANCECULINARY TOURISM MARKET REVENUE, BY MODE OF BOOKING, 2019-2027 ($BILLION)
TABLE 44.ITALYCULINARY TOURISM MARKET REVENUE, BY ACTIVITY TYPE, 2019-2027 ($BILLION)
TABLE 45.ITALYCULINARY TOURISM MARKET REVENUE, BY AGE GROUP, 2019-2027 ($BILLION)
TABLE 46.ITALYCULINARY TOURISM MARKET REVENUE, BY MODE OF BOOKING, 2019-2027 ($BILLION)
TABLE 47.SPAINCULINARY TOURISM MARKET REVENUE, BY ACTIVITY TYPE, 2019-2027 ($BILLION)
TABLE 48.SPAINCULINARY TOURISM MARKET REVENUE, BY AGE GROUP, 2019-2027 ($BILLION)
TABLE 49.SPAINCULINARY TOURISM MARKET REVENUE, BY MODE OF BOOKING, 2019-2027 ($BILLION)
TABLE 50.REST OF EUROPECULINARY TOURISM MARKET REVENUE, BY ACTIVITY TYPE, 2019-2027 ($BILLION)
TABLE 51.REST OF EUROPECULINARY TOURISM MARKET REVENUE, BY AGE GROUP, 2019-2027 ($BILLION)
TABLE 52.REST OF EUROPECULINARY TOURISM MARKET REVENUE, BY MODE OF BOOKING, 2019-2027 ($BILLION)
TABLE 53.ASIA-PACIFICCULINARY TOURISM MARKET REVENUE, BY ACTIVITY TYPE, 2019-2027 ($BILLION)
TABLE 54.ASIA-PACIFICCULINARY TOURISM MARKET REVENUE, BY AGE GROUP, 2019-2027 ($BILLION)
TABLE 55.ASIA-PACIFICCULINARY TOURISM MARKET REVENUE, BY MODE OF BOOKING, 2019-2027 ($BILLION)
TABLE 56.ASIA-PACIFICCULINARY TOURISM MARKET, BY COUNTRY, 2019-2027 ($BILLION)
TABLE 57.CHINACULINARY TOURISM MARKET REVENUE, BY ACTIVITY TYPE, 2019-2027 ($BILLION)
TABLE 58.CHINACULINARY TOURISM MARKET REVENUE, BY AGE GROUP, 2019-2027 ($BILLION)
TABLE 59.CHINACULINARY TOURISM MARKET REVENUE, BY MODE OF BOOKING, 2019-2027 ($BILLION)
TABLE 60.INDIACULINARY TOURISM MARKET REVENUE, BY ACTIVITY TYPE, 2019-2027 ($BILLION)
TABLE 61.INDIACULINARY TOURISM MARKET REVENUE, BY AGE GROUP, 2019-2027 ($BILLION)
TABLE 62.INDIACULINARY TOURISM MARKET REVENUE, BY MODE OF BOOKING, 2019-2027 ($BILLION)
TABLE 63.JAPANCULINARY TOURISM MARKET REVENUE, BY ACTIVITY TYPE, 2019-2027 ($BILLION)
TABLE 64.JAPANCULINARY TOURISM MARKET REVENUE, BY AGE GROUP, 2019-2027 ($BILLION)
TABLE 65.JAPANCULINARY TOURISM MARKET REVENUE, BY MODE OF BOOKING, 2019-2027 ($BILLION)
TABLE 66.ASEANCULINARY TOURISM MARKET REVENUE, BY ACTIVITY TYPE, 2019-2027 ($BILLION)
TABLE 67.ASEANCULINARY TOURISM MARKET REVENUE, BY AGE GROUP, 2019-2027 ($BILLION)
TABLE 68.ASEANCULINARY TOURISM MARKET REVENUE, BY MODE OF BOOKING, 2019-2027 ($BILLION)
TABLE 69.SOUTH KOREACULINARY TOURISM MARKET REVENUE, BY ACTIVITY TYPE, 2019-2027 ($BILLION)
TABLE 70.SOUTH KOREACULINARY TOURISM MARKET REVENUE, BY AGE GROUP, 2019-2027 ($BILLION)
TABLE 71.SOUTH KOREACULINARY TOURISM MARKET REVENUE, BY MODE OF BOOKING, 2019-2027 ($BILLION)
TABLE 72.REST OF ASIA-PACIFICCULINARY TOURISM MARKET REVENUE, BY ACTIVITY TYPE, 2019-2027 ($BILLION)
TABLE 73.REST OF ASIA-PACIFICCULINARY TOURISM MARKET REVENUE, BY AGE GROUP, 2019-2027 ($BILLION)
TABLE 74.REST OF ASIA-PACIFICCULINARY TOURISM MARKET REVENUE, BY MODE OF BOOKING, 2019-2027 ($BILLION)
TABLE 75.LAMEACULINARY TOURISM MARKET REVENUE, BY ACTIVITY TYPE, 2019-2027 ($BILLION)
TABLE 76.LAMEACULINARY TOURISM MARKET REVENUE, BY AGE GROUP, 2019-2027 ($BILLION)
TABLE 77.LAMEACULINARY TOURISM MARKET REVENUE, BY MODE OF BOOKING, 2019-2027 ($BILLION)
TABLE 78.LAMEACULINARY TOURISM MARKET, BY COUNTRY, 2019-2027 ($BILLION)
TABLE 79.LATIN AMERICACULINARY TOURISM MARKET REVENUE, BY ACTIVITY TYPE, 2019-2027 ($BILLION)
TABLE 80.LATIN AMERICACULINARY TOURISM MARKET REVENUE, BY AGE GROUP, 2019-2027 ($BILLION)
TABLE 81.LATIN AMERICACULINARY TOURISM MARKET REVENUE, BY MODE OF BOOKING, 2019-2027 ($BILLION)
TABLE 82.MIDDLE EASTCULINARY TOURISM MARKET REVENUE, BY ACTIVITY TYPE, 2019-2027 ($BILLION)
TABLE 83.MIDDLE EASTCULINARY TOURISM MARKET REVENUE, BY AGE GROUP, 2019-2027 ($BILLION)
TABLE 84.MIDDLE EASTCULINARY TOURISM MARKET REVENUE, BY MODE OF BOOKING, 2019-2027 ($BILLION)
TABLE 85.AFRICACULINARY TOURISM MARKET REVENUE, BY ACTIVITY TYPE, 2019-2027 ($BILLION)
TABLE 86.AFRICACULINARY TOURISM MARKET REVENUE, BY AGE GROUP, 2019-2027 ($BILLION)
TABLE 87.AFRICACULINARY TOURISM MARKET REVENUE, BY MODE OF BOOKING, 2019-2027 ($BILLION)
TABLE 88.ABERCROMBIE & KENT USA, LLC: KEY EXECUTIVES
TABLE 89.ABERCROMBIE & KENT USA, LLC: COMPANY SNAPSHOT
TABLE 90.ABERCROMBIE & KENT USA, LLC: PRODUCT PORTFOLIO
TABLE 91.CLASSIC JOURNEYS, LLC: KEY EXECUTIVE
TABLE 92.CLASSIC JOURNEYS, LLC: COMPANY SNAPSHOT
TABLE 93.CLASSIC JOURNEYS, LLC: PRODUCT PORTFOLIO
TABLE 94.G ADVENTURES: KEY EXECUTIVE
TABLE 95.G ADVENTURES: COMPANY SNAPSHOT
TABLE 96.G ADVENTURES: PRODUCT PORTFOLIO
TABLE 97.GREAVES TRAVEL LTD: KEY EXECUTIVES
TABLE 98.GREAVES TRAVEL LTD: COMPANY SNAPSHOT
TABLE 99.GREAVES TRAVEL LTD: PRODUCT PORTFOLIO
TABLE 100.INDIA FOOD TOUR: KEY EXECUTIVES
TABLE 101.INDIA FOOD TOUR: COMPANY SNAPSHOT
TABLE 102.INDIA FOOD TOUR: PRODUCT PORTFOLIO
TABLE 103.ITC TRAVEL GROUP LIMITED: KEY EXECUTIVES
TABLE 104.ITC TRAVEL GROUP LIMITED: COMPANY SNAPSHOT
TABLE 105.ITC TRAVEL GROUP LIMITED: PRODUCT PORTFOLIO
TABLE 106.FOOD TOUR CORPORATION: COMPANY SNAPSHOT
TABLE 107.FOOD TOUR CORPORATION: PRODUCT PORTFOLIO
TABLE 108.THE TRAVEL CORPORATION : KEY EXECUTIVE
TABLE 109.THE TRAVEL CORPORATION : COMPANY SNAPSHOT
TABLE 110.THE TRAVEL CORPORATION : PRODUCT PORTFOLIO
TABLE 111.TOPDECK TRAVEL: COMPANY SNAPSHOT
TABLE 112.TOPDECK TRAVEL: PRODUCT PORTFOLIO
TABLE 113.TOURRADAR GMBH: KEY EXECUTIVES
TABLE 114.TOURRADAR GMBH: COMPANY SNAPSHOT
TABLE 115.TOURRADAR GMBH: PRODUCT PORTFOLIO
LIST OF FIGURES
FIGURE 01.CULINARY TOURISM MARKET SNAPSHOT
FIGURE 02.CULINARY TOURISM MARKET SEGMENTATION
FIGURE 03.TOP INVESTMENT POCKETS
FIGURE 04.TOP IMPACTING FACTORS
FIGURE 05.MODERATE BARGAINING POWER OF SUPPLIERS
FIGURE 06.MODERATEBARGAINING POWER OF BUYERS
FIGURE 07.HIGH THREAT OF SUBSTITUTION
FIGURE 08.MODERATE THREAT OF NEW ENTRANTS
FIGURE 09.HIGH INTENSITY OF COMPETITIVE RIVALRY
FIGURE 10.IMPACT OF COVID-19 ON CULINARY TOURISM MARKET FORECAST
FIGURE 11.CULINARY TOURISM MARKET, BY ACTIVITY TYPE, 2019 (%)
FIGURE 12.COMPARATIVE SHARE ANALYSIS OF CULINARY TOURISM MARKET FOR CULINARY TRIALS, BY COUNTRY, 2019& 2027 (%)
FIGURE 13.COMPARATIVE SHARE ANALYSIS OF CULINARY TOURISM MARKET FORCOOKING CLASSES, BY COUNTRY, 2019& 2027 (%)
FIGURE 14.COMPARATIVE SHARE ANALYSIS OF CULINARY TOURISM MARKET FOR RESTAURANTS, BY COUNTRY, 2019& 2027 (%)
FIGURE 15.COMPARATIVE SHARE ANALYSIS OF CULINARY TOURISM MARKET FOR FOOD FESTIVAL, BY COUNTRY, 2019& 2027 (%)
FIGURE 16.COMPARATIVE SHARE ANALYSIS OF CULINARY TOURISM MARKET FOR OTHERS, BY COUNTRY, 2019& 2027 (%)
FIGURE 17.CULINARY TOURISM MARKET, BY AGE GROUP, 2019 (%)
FIGURE 18.COMPARATIVE SHARE ANALYSIS OF CULINARY TOURISM MARKET FORBABY BOOMERS, BY COUNTRY, 2019 & 2027 (%)
FIGURE 19.COMPARATIVE SHARE ANALYSIS OF CULINARY TOURISM MARKET FOR GENERATION X, BY COUNTRY, 2019 & 2027 (%)
FIGURE 20.COMPARATIVE SHARE ANALYSIS OF CULINARY TOURISM MARKET FOR GENERATION Y, BY COUNTRY, 2019 & 2027 (%)
FIGURE 21.COMPARATIVE SHARE ANALYSIS OF CULINARY TOURISM MARKET FOR GENERATION Z, BY COUNTRY, 2019 & 2027 (%)
FIGURE 22.CULINARY TOURISM MARKET, BY MODE OF BOOKING, 2019 (%)
FIGURE 23.CULINARY TOURISM MARKET FROMOTA, BY COUNTRY, 2019 & 2027 (%)
FIGURE 24.CULINARY TOURISM MARKET FROMTRADITIONAL AGENTS, BY COUNTRY, 2019 & 2027 (%)
FIGURE 25.CULINARY TOURISM MARKET FROMDIRECT BOOKING, BY COUNTRY, 2019 & 2027 (%)
FIGURE 26.CULINARY TOURISM MARKET, BY REGION, 2019 (%)
FIGURE 27.U.S. CULINARY TOURISM MARKET, 2019-2027 ($BILLION)
FIGURE 28.CANADACULINARY TOURISM MARKET, 2019-2027 ($BILLION)
FIGURE 29.MEXICOCULINARY TOURISM MARKET, 2019-2027 ($BILLION)
FIGURE 30.GERMANYCULINARY TOURISM MARKET, 2019-2027 ($BILLION)
FIGURE 31.UKCULINARY TOURISM MARKET, 2019-2027 ($BILLION)
FIGURE 32.FRANCECULINARY TOURISM MARKET, 2019-2027 ($BILLION)
FIGURE 33.ITALYCULINARY TOURISM MARKET, 2019-2027 ($BILLION)
FIGURE 34.SPAINCULINARY TOURISM MARKET, 2019-2027 ($BILLION)
FIGURE 35.REST OF EUROPECULINARY TOURISM MARKET, 2019-2027 ($BILLION)
FIGURE 36.CHINACULINARY TOURISM MARKET, 2019-2027 ($BILLION)
FIGURE 37.INDIACULINARY TOURISM MARKET, 2019-2027 ($BILLION)
FIGURE 38.JAPANCULINARY TOURISM MARKET, 2019-2027 ($BILLION)
FIGURE 39.ASEANCULINARY TOURISM MARKET, 2019-2027 ($BILLION)
FIGURE 40.SOUTH KOREACULINARY TOURISM MARKET, 2019-2027 ($BILLION)
FIGURE 41.REST OF ASIA-PACIFICCULINARY TOURISM MARKET, 2019-2027 ($BILLION)
FIGURE 42.LATIN AMERICACULINARY TOURISM MARKET, 2019-2027 ($BILLION)
FIGURE 43.MIDDLE EASTCULINARY TOURISM MARKET, 2019-2027 ($BILLION)
FIGURE 44.AFRICACULINARY TOURISM MARKET, 2019-2027 ($BILLION)
FIGURE 45.COMPETITIVE DASHBOARD OF TOP 10 KEY PLAYERS
FIGURE 46.COMPETITIVE HEATMAP OF TOP 10 KEY PLAYERS