Categories
Life Sciences Consumer Goods Materials and Chemicals Construction & Manufacturing Food and Beverages Energy and Power Semiconductor and Electronics Automotive and Transportation ICT & Media Aerospace & Defense BFSI

Int'l : +1-503-894-6022 | Toll Free : +1-800-792-5285 | help@alliedmarketresearch.com

Differential Pressure Sensor Market by Product Type (Analog, Digital), by Accuracy Type (1–2%, 2–5%, and5%), by Application (HVAC Systems, Process Control, Test and Measurement, Navigation, Others) and by Industry Vertical (Consumer electronics, Automotive, Industrial, Aerospace and Defense, Others): Global Opportunity Analysis and Industry Forecast, 2023-2032

A08022

Pages: NA

Charts: NA

Tables: NA

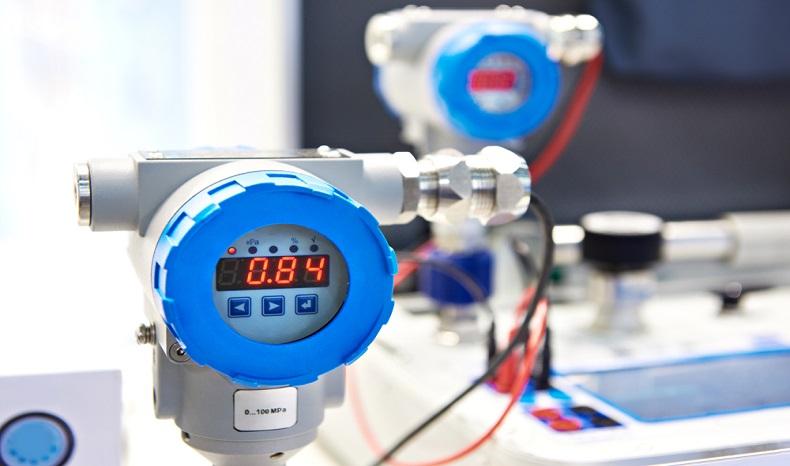
Differential pressure sensor is an electronic device designed to measure and calculate pressure difference between two points, one connected to each side of the sensor. Silicon-based board mounted differential pressure sensors are widely used in industrial sectors for measuring flow rates, fluid levels, pressure drops across oil filters, or air filters as they can be externally retrofitted to an existing vessel. Differential pressure sensor can be used for exhaust gas treatments as well as low pressure exhaust gas recirculation. In addition, these are used to measure total level in separator vessels and can be isolated safely from a process using block values for maintenance and testing. Differential pressure sensors are used in the automobile sector in engine management systems to enhance efficiency of car engines and accurately monitor engine conditions such as air volume and exhaust gas pressure.

Covid-19 Impact Analysis:

  • The ongoing COVID-19 pandemic is unsettling for people as well as organizations and business firms worldwide. With shutdown of manufacturing operations and travel and transportation ban worldwide, demand for pressure sensors has also plunged. The exact measure of the scale and scope of the challenge cannot be anticipated yet.
  • Robotics and machine vision incorporating wireless pressure sensors help to inspect, identify, recognize, diagnose, and provide assistance in treating COVID-19 patients. Robots are being deployed at medical service facilities to treat patients and bring supplies with a view to minimize human to human contact.  
  • In response to COVID-19 scenario, the differential pressure sensors market is expected to undergo temporary shortfall, owing to shutdown of operations of industries and manufacturing units globally. There is demand lapse accompanied by halt in production disrupting the supply chain. Contrarily, the market is expected to make fast rebound, owing to rise in demand for pressure sensor incorporated devices in healthcare and emergency services to combat the virus outbreak.

Top Impacting Factors: Market Scenario Analysis, Trends, Drivers, and Impact Analysis

Rise in inclusion of this compact, rugged equipment in hazardous environment of offshore or subsea gas & oil processing plants, effluent treatment plants, as well as remote heating systems that utilize heated water or steam is the major factor that fuels the differential pressure sensor market share. However, low cost of profit margins and errors in this device, owing to variations in liquid density by temperature changes tend to restrain the differential pressure sensor market growth.

On the other hand, growth in use of these devices to determine ventilation and suction pressure in respiration devices in the healthcare sector due to high resolution and accuracy accompanied by low noise performance further boosts the market revenue. Rapid level of industrialization followed by increase in production of motor vehicles is expected to pave new avenues to the differential pressure sensor industry.

New Product Launches to Flourish the Market

Leading differential pressure sensor market players are adopting necessary steps to improve design, production, and quality control processes with a view to enhance accuracy of differential pressure sensors, which presents innovative power-to-system solutions for applications that are set to power the world.

In June 2020, Robert Bosch GmbH, a German multinational engineering and technology company, introduced BMP390L, high performance longevity barometric pressure sensor. This pressure sensor offers high accuracy covering 300hPa to 1250hPa measurement range and provides interrupt functionality for simple access to data and storage. In addition, it includes FIFO functionality that eases use while reducing power consumption during full operation. BMP390L is available in 10-pin LGA package with metal lid and is integrated with I2C and SPI interfaces. The device is used for air-flow detection in home appliances, water-level detection in agriculture, and flight stabilization for drones as well as for navigation purposes.

Surge in Use of Industrial Sensors in Automotive and Industrial Applications

In June 2019, SMI Microelectronics, global developers and manufacturers of pressure sensors, introduced SM923X Series of ultra-low pressure sensor systems. It features industry-leading output accuracy and long-term stability by combination of MEMS pressure transducer with signal-conditioning IC in single package. SM923X series is a compact solution providing improved system efficiency over conventional bulky, costly devices. The overall accuracy error is less than 1% full scale and 16bit resolution enables to resolve signals as small as 0.0038Pa. SM923X sensors fully calibrated and digital I2C interface allows easy system integration. In addition, it integrates high order noise filtering and extremely low EMI susceptibility. Small SO16 package with dual vertical port allows easy system integration while MEMS sensor is robust with high burst pressure. This series of pressure sensor is used for accurate pressure sensing in industrial control systems such as pressure switches, pneumatic valves to measure gas pressure in vacuum pumps.

Key benefits of the stakeholders:

  • The study gives an analytical overview of the differential pressure sensor market forecast with current trends and future estimations to determine imminent investment pockets.
  • The report provides information related to key drivers, restraints, and opportunities along with detailed differential pressure sensor market analysis.
  • The current differential pressure sensor market trends are quantitatively analyzed.
  • Porter’s five forces analysis illustrates the potency of buyers & suppliers in the market. 

Questions answered in the differential pressure sensors market research report:

  • Who are the leading market players active in the differential pressure sensor market?
  • What would be the detailed impact of COVID-19 on the market?
  • What current trends would influence the market in the next few years?
  • What are the driving factors, restraints, and opportunities in the differential pressure sensors market?
  • What are the projections for the future that would help in taking further strategic steps?

Key Market Segments

  • By Product Type
    • Analog
    • Digital
  • By Accuracy Type
    • 1–2%
    • 2–5%
    • >5%
  • By Application
    • HVAC Systems
    • Process Control
    • Test and Measurement
    • Navigation
    • Others
  • By Industry Vertical
    • Consumer electronics
    • Automotive
    • Industrial
    • Aerospace and Defense
    • Others
  • By Region
    • North America
      • US
      • Canada
      • Mexico
    • Europe
      • Germany
      • UK
      • France
      • Russia
      • rest of Europe
    • Asia Pacific
      • India
      • Japan
      • China
      • rest of Asia Pacific
    • LAMEA
      • Latin America
      • Middle East
      • Africa


Key Market Players

  • NXP Semiconductors
  • Texas Instruments Inc.
  • Omron Corp.
  • ABB Ltd.
  • Amphenol Advanced Sensors
  • Yokogawa India Ltd.
  • STMicroelectronics
  • Honeywell International Inc.
  • Robert Bosch GmbH
  • Keller Corp.
  • CHAPTER 1: INTRODUCTION

    • 1.1. Report Description

    • 1.2. Key Market Segments

    • 1.3. Key Benefits

    • 1.4. Research Methodology

      • 1.4.1. Primary Research

      • 1.4.2. Secondary Research

      • 1.4.3. Analyst Tools and Models

  • CHAPTER 2: EXECUTIVE SUMMARY

    • 2.1. CXO Perspective

  • CHAPTER 3: MARKET LANDSCAPE

    • 3.1. Market Definition and Scope

    • 3.2. Key Findings

      • 3.2.1. Top Investment Pockets

      • 3.2.2. Top Winning Strategies

    • 3.3. Porter's Five Forces Analysis

      • 3.3.1. Bargaining Power of Suppliers

      • 3.3.2. Threat of New Entrants

      • 3.3.3. Threat of Substitutes

      • 3.3.4. Competitive Rivalry

      • 3.3.5. Bargaining Power among Buyers

    • 3.5. Market Dynamics

      • 3.5.1. Drivers

      • 3.5.2. Restraints

      • 3.5.3. Opportunities

  • CHAPTER 4: DIFFERENTIAL PRESSURE SENSOR MARKET, BY PRODUCT TYPE

    • 4.1. Market Overview

      • 4.1.1 Market Size and Forecast, By Product Type

    • 4.2. Analog

      • 4.2.1. Key Market Trends, Growth Factors and Opportunities

      • 4.2.2. Market Size and Forecast, By Region

      • 4.2.3. Market Share Analysis, By Country

    • 4.3. Digital

      • 4.3.1. Key Market Trends, Growth Factors and Opportunities

      • 4.3.2. Market Size and Forecast, By Region

      • 4.3.3. Market Share Analysis, By Country

  • CHAPTER 5: DIFFERENTIAL PRESSURE SENSOR MARKET, BY ACCURACY TYPE

    • 5.1. Market Overview

      • 5.1.1 Market Size and Forecast, By Accuracy Type

    • 5.2. 1–2%

      • 5.2.1. Key Market Trends, Growth Factors and Opportunities

      • 5.2.2. Market Size and Forecast, By Region

      • 5.2.3. Market Share Analysis, By Country

    • 5.3. 2–5%

      • 5.3.1. Key Market Trends, Growth Factors and Opportunities

      • 5.3.2. Market Size and Forecast, By Region

      • 5.3.3. Market Share Analysis, By Country

    • 5.4. >5%

      • 5.4.1. Key Market Trends, Growth Factors and Opportunities

      • 5.4.2. Market Size and Forecast, By Region

      • 5.4.3. Market Share Analysis, By Country

  • CHAPTER 6: DIFFERENTIAL PRESSURE SENSOR MARKET, BY APPLICATION

    • 6.1. Market Overview

      • 6.1.1 Market Size and Forecast, By Application

    • 6.2. HVAC Systems

      • 6.2.1. Key Market Trends, Growth Factors and Opportunities

      • 6.2.2. Market Size and Forecast, By Region

      • 6.2.3. Market Share Analysis, By Country

    • 6.3. Process Control

      • 6.3.1. Key Market Trends, Growth Factors and Opportunities

      • 6.3.2. Market Size and Forecast, By Region

      • 6.3.3. Market Share Analysis, By Country

    • 6.4. Test And Measurement

      • 6.4.1. Key Market Trends, Growth Factors and Opportunities

      • 6.4.2. Market Size and Forecast, By Region

      • 6.4.3. Market Share Analysis, By Country

    • 6.5. Navigation

      • 6.5.1. Key Market Trends, Growth Factors and Opportunities

      • 6.5.2. Market Size and Forecast, By Region

      • 6.5.3. Market Share Analysis, By Country

    • 6.6. Others

      • 6.6.1. Key Market Trends, Growth Factors and Opportunities

      • 6.6.2. Market Size and Forecast, By Region

      • 6.6.3. Market Share Analysis, By Country

  • CHAPTER 7: DIFFERENTIAL PRESSURE SENSOR MARKET, BY INDUSTRY VERTICAL

    • 7.1. Market Overview

      • 7.1.1 Market Size and Forecast, By Industry Vertical

    • 7.2. Consumer Electronics

      • 7.2.1. Key Market Trends, Growth Factors and Opportunities

      • 7.2.2. Market Size and Forecast, By Region

      • 7.2.3. Market Share Analysis, By Country

    • 7.3. Automotive

      • 7.3.1. Key Market Trends, Growth Factors and Opportunities

      • 7.3.2. Market Size and Forecast, By Region

      • 7.3.3. Market Share Analysis, By Country

    • 7.4. Industrial

      • 7.4.1. Key Market Trends, Growth Factors and Opportunities

      • 7.4.2. Market Size and Forecast, By Region

      • 7.4.3. Market Share Analysis, By Country

    • 7.5. Aerospace And Defense

      • 7.5.1. Key Market Trends, Growth Factors and Opportunities

      • 7.5.2. Market Size and Forecast, By Region

      • 7.5.3. Market Share Analysis, By Country

    • 7.6. Others

      • 7.6.1. Key Market Trends, Growth Factors and Opportunities

      • 7.6.2. Market Size and Forecast, By Region

      • 7.6.3. Market Share Analysis, By Country

  • CHAPTER 8: DIFFERENTIAL PRESSURE SENSOR MARKET, BY REGION

    • 8.1. Market Overview

      • 8.1.1 Market Size and Forecast, By Region

    • 8.2. North America

      • 8.2.1. Key Market Trends and Opportunities

      • 8.2.2. Market Size and Forecast, By Product Type

      • 8.2.3. Market Size and Forecast, By Accuracy Type

      • 8.2.4. Market Size and Forecast, By Application

      • 8.2.5. Market Size and Forecast, By Industry Vertical

      • 8.2.6. Market Size and Forecast, By Country

      • 8.2.7. U.S. Differential Pressure Sensor Market

        • 8.2.7.1. Market Size and Forecast, By Product Type
        • 8.2.7.2. Market Size and Forecast, By Accuracy Type
        • 8.2.7.3. Market Size and Forecast, By Application
        • 8.2.7.4. Market Size and Forecast, By Industry Vertical
      • 8.2.8. Canada Differential Pressure Sensor Market

        • 8.2.8.1. Market Size and Forecast, By Product Type
        • 8.2.8.2. Market Size and Forecast, By Accuracy Type
        • 8.2.8.3. Market Size and Forecast, By Application
        • 8.2.8.4. Market Size and Forecast, By Industry Vertical
      • 8.2.9. Mexico Differential Pressure Sensor Market

        • 8.2.9.1. Market Size and Forecast, By Product Type
        • 8.2.9.2. Market Size and Forecast, By Accuracy Type
        • 8.2.9.3. Market Size and Forecast, By Application
        • 8.2.9.4. Market Size and Forecast, By Industry Vertical
    • 8.3. Europe

      • 8.3.1. Key Market Trends and Opportunities

      • 8.3.2. Market Size and Forecast, By Product Type

      • 8.3.3. Market Size and Forecast, By Accuracy Type

      • 8.3.4. Market Size and Forecast, By Application

      • 8.3.5. Market Size and Forecast, By Industry Vertical

      • 8.3.6. Market Size and Forecast, By Country

      • 8.3.7. France Differential Pressure Sensor Market

        • 8.3.7.1. Market Size and Forecast, By Product Type
        • 8.3.7.2. Market Size and Forecast, By Accuracy Type
        • 8.3.7.3. Market Size and Forecast, By Application
        • 8.3.7.4. Market Size and Forecast, By Industry Vertical
      • 8.3.8. Germany Differential Pressure Sensor Market

        • 8.3.8.1. Market Size and Forecast, By Product Type
        • 8.3.8.2. Market Size and Forecast, By Accuracy Type
        • 8.3.8.3. Market Size and Forecast, By Application
        • 8.3.8.4. Market Size and Forecast, By Industry Vertical
      • 8.3.9. Italy Differential Pressure Sensor Market

        • 8.3.9.1. Market Size and Forecast, By Product Type
        • 8.3.9.2. Market Size and Forecast, By Accuracy Type
        • 8.3.9.3. Market Size and Forecast, By Application
        • 8.3.9.4. Market Size and Forecast, By Industry Vertical
      • 8.3.10. Spain Differential Pressure Sensor Market

        • 8.3.10.1. Market Size and Forecast, By Product Type
        • 8.3.10.2. Market Size and Forecast, By Accuracy Type
        • 8.3.10.3. Market Size and Forecast, By Application
        • 8.3.10.4. Market Size and Forecast, By Industry Vertical
      • 8.3.11. UK Differential Pressure Sensor Market

        • 8.3.11.1. Market Size and Forecast, By Product Type
        • 8.3.11.2. Market Size and Forecast, By Accuracy Type
        • 8.3.11.3. Market Size and Forecast, By Application
        • 8.3.11.4. Market Size and Forecast, By Industry Vertical
      • 8.3.12. Russia Differential Pressure Sensor Market

        • 8.3.12.1. Market Size and Forecast, By Product Type
        • 8.3.12.2. Market Size and Forecast, By Accuracy Type
        • 8.3.12.3. Market Size and Forecast, By Application
        • 8.3.12.4. Market Size and Forecast, By Industry Vertical
      • 8.3.13. Rest Of Europe Differential Pressure Sensor Market

        • 8.3.13.1. Market Size and Forecast, By Product Type
        • 8.3.13.2. Market Size and Forecast, By Accuracy Type
        • 8.3.13.3. Market Size and Forecast, By Application
        • 8.3.13.4. Market Size and Forecast, By Industry Vertical
    • 8.4. Asia-Pacific

      • 8.4.1. Key Market Trends and Opportunities

      • 8.4.2. Market Size and Forecast, By Product Type

      • 8.4.3. Market Size and Forecast, By Accuracy Type

      • 8.4.4. Market Size and Forecast, By Application

      • 8.4.5. Market Size and Forecast, By Industry Vertical

      • 8.4.6. Market Size and Forecast, By Country

      • 8.4.7. China Differential Pressure Sensor Market

        • 8.4.7.1. Market Size and Forecast, By Product Type
        • 8.4.7.2. Market Size and Forecast, By Accuracy Type
        • 8.4.7.3. Market Size and Forecast, By Application
        • 8.4.7.4. Market Size and Forecast, By Industry Vertical
      • 8.4.8. Japan Differential Pressure Sensor Market

        • 8.4.8.1. Market Size and Forecast, By Product Type
        • 8.4.8.2. Market Size and Forecast, By Accuracy Type
        • 8.4.8.3. Market Size and Forecast, By Application
        • 8.4.8.4. Market Size and Forecast, By Industry Vertical
      • 8.4.9. India Differential Pressure Sensor Market

        • 8.4.9.1. Market Size and Forecast, By Product Type
        • 8.4.9.2. Market Size and Forecast, By Accuracy Type
        • 8.4.9.3. Market Size and Forecast, By Application
        • 8.4.9.4. Market Size and Forecast, By Industry Vertical
      • 8.4.10. South Korea Differential Pressure Sensor Market

        • 8.4.10.1. Market Size and Forecast, By Product Type
        • 8.4.10.2. Market Size and Forecast, By Accuracy Type
        • 8.4.10.3. Market Size and Forecast, By Application
        • 8.4.10.4. Market Size and Forecast, By Industry Vertical
      • 8.4.11. Australia Differential Pressure Sensor Market

        • 8.4.11.1. Market Size and Forecast, By Product Type
        • 8.4.11.2. Market Size and Forecast, By Accuracy Type
        • 8.4.11.3. Market Size and Forecast, By Application
        • 8.4.11.4. Market Size and Forecast, By Industry Vertical
      • 8.4.12. Thailand Differential Pressure Sensor Market

        • 8.4.12.1. Market Size and Forecast, By Product Type
        • 8.4.12.2. Market Size and Forecast, By Accuracy Type
        • 8.4.12.3. Market Size and Forecast, By Application
        • 8.4.12.4. Market Size and Forecast, By Industry Vertical
      • 8.4.13. Malaysia Differential Pressure Sensor Market

        • 8.4.13.1. Market Size and Forecast, By Product Type
        • 8.4.13.2. Market Size and Forecast, By Accuracy Type
        • 8.4.13.3. Market Size and Forecast, By Application
        • 8.4.13.4. Market Size and Forecast, By Industry Vertical
      • 8.4.14. Indonesia Differential Pressure Sensor Market

        • 8.4.14.1. Market Size and Forecast, By Product Type
        • 8.4.14.2. Market Size and Forecast, By Accuracy Type
        • 8.4.14.3. Market Size and Forecast, By Application
        • 8.4.14.4. Market Size and Forecast, By Industry Vertical
      • 8.4.15. Rest of Asia Pacific Differential Pressure Sensor Market

        • 8.4.15.1. Market Size and Forecast, By Product Type
        • 8.4.15.2. Market Size and Forecast, By Accuracy Type
        • 8.4.15.3. Market Size and Forecast, By Application
        • 8.4.15.4. Market Size and Forecast, By Industry Vertical
    • 8.5. LAMEA

      • 8.5.1. Key Market Trends and Opportunities

      • 8.5.2. Market Size and Forecast, By Product Type

      • 8.5.3. Market Size and Forecast, By Accuracy Type

      • 8.5.4. Market Size and Forecast, By Application

      • 8.5.5. Market Size and Forecast, By Industry Vertical

      • 8.5.6. Market Size and Forecast, By Country

      • 8.5.7. Brazil Differential Pressure Sensor Market

        • 8.5.7.1. Market Size and Forecast, By Product Type
        • 8.5.7.2. Market Size and Forecast, By Accuracy Type
        • 8.5.7.3. Market Size and Forecast, By Application
        • 8.5.7.4. Market Size and Forecast, By Industry Vertical
      • 8.5.8. South Africa Differential Pressure Sensor Market

        • 8.5.8.1. Market Size and Forecast, By Product Type
        • 8.5.8.2. Market Size and Forecast, By Accuracy Type
        • 8.5.8.3. Market Size and Forecast, By Application
        • 8.5.8.4. Market Size and Forecast, By Industry Vertical
      • 8.5.9. Saudi Arabia Differential Pressure Sensor Market

        • 8.5.9.1. Market Size and Forecast, By Product Type
        • 8.5.9.2. Market Size and Forecast, By Accuracy Type
        • 8.5.9.3. Market Size and Forecast, By Application
        • 8.5.9.4. Market Size and Forecast, By Industry Vertical
      • 8.5.10. UAE Differential Pressure Sensor Market

        • 8.5.10.1. Market Size and Forecast, By Product Type
        • 8.5.10.2. Market Size and Forecast, By Accuracy Type
        • 8.5.10.3. Market Size and Forecast, By Application
        • 8.5.10.4. Market Size and Forecast, By Industry Vertical
      • 8.5.11. Argentina Differential Pressure Sensor Market

        • 8.5.11.1. Market Size and Forecast, By Product Type
        • 8.5.11.2. Market Size and Forecast, By Accuracy Type
        • 8.5.11.3. Market Size and Forecast, By Application
        • 8.5.11.4. Market Size and Forecast, By Industry Vertical
      • 8.5.12. Rest of LAMEA Differential Pressure Sensor Market

        • 8.5.12.1. Market Size and Forecast, By Product Type
        • 8.5.12.2. Market Size and Forecast, By Accuracy Type
        • 8.5.12.3. Market Size and Forecast, By Application
        • 8.5.12.4. Market Size and Forecast, By Industry Vertical
  • CHAPTER 9: COMPETITIVE LANDSCAPE

    • 9.1. Introduction

    • 9.2. Top Winning Strategies

    • 9.3. Product Mapping Of Top 10 Player

    • 9.4. Competitive Dashboard

    • 9.5. Competitive Heatmap

    • 9.6. Top Player Positioning, 2024

  • CHAPTER 10: COMPANY PROFILES

    • 10.1. ABB Ltd.

      • 10.1.1. Company Overview

      • 10.1.2. Key Executives

      • 10.1.3. Company Snapshot

      • 10.1.4. Operating Business Segments

      • 10.1.5. Product Portfolio

      • 10.1.6. Business Performance

      • 10.1.7. Key Strategic Moves and Developments

    • 10.2. Amphenol Advanced Sensors

      • 10.2.1. Company Overview

      • 10.2.2. Key Executives

      • 10.2.3. Company Snapshot

      • 10.2.4. Operating Business Segments

      • 10.2.5. Product Portfolio

      • 10.2.6. Business Performance

      • 10.2.7. Key Strategic Moves and Developments

    • 10.3. Keller Corp.

      • 10.3.1. Company Overview

      • 10.3.2. Key Executives

      • 10.3.3. Company Snapshot

      • 10.3.4. Operating Business Segments

      • 10.3.5. Product Portfolio

      • 10.3.6. Business Performance

      • 10.3.7. Key Strategic Moves and Developments

    • 10.4. Yokogawa India Ltd.

      • 10.4.1. Company Overview

      • 10.4.2. Key Executives

      • 10.4.3. Company Snapshot

      • 10.4.4. Operating Business Segments

      • 10.4.5. Product Portfolio

      • 10.4.6. Business Performance

      • 10.4.7. Key Strategic Moves and Developments

    • 10.5. Omron Corp.

      • 10.5.1. Company Overview

      • 10.5.2. Key Executives

      • 10.5.3. Company Snapshot

      • 10.5.4. Operating Business Segments

      • 10.5.5. Product Portfolio

      • 10.5.6. Business Performance

      • 10.5.7. Key Strategic Moves and Developments

    • 10.6. Honeywell International Inc.

      • 10.6.1. Company Overview

      • 10.6.2. Key Executives

      • 10.6.3. Company Snapshot

      • 10.6.4. Operating Business Segments

      • 10.6.5. Product Portfolio

      • 10.6.6. Business Performance

      • 10.6.7. Key Strategic Moves and Developments

    • 10.7. Texas Instruments Inc.

      • 10.7.1. Company Overview

      • 10.7.2. Key Executives

      • 10.7.3. Company Snapshot

      • 10.7.4. Operating Business Segments

      • 10.7.5. Product Portfolio

      • 10.7.6. Business Performance

      • 10.7.7. Key Strategic Moves and Developments

    • 10.8. STMicroelectronics

      • 10.8.1. Company Overview

      • 10.8.2. Key Executives

      • 10.8.3. Company Snapshot

      • 10.8.4. Operating Business Segments

      • 10.8.5. Product Portfolio

      • 10.8.6. Business Performance

      • 10.8.7. Key Strategic Moves and Developments

    • 10.9. Robert Bosch GmbH

      • 10.9.1. Company Overview

      • 10.9.2. Key Executives

      • 10.9.3. Company Snapshot

      • 10.9.4. Operating Business Segments

      • 10.9.5. Product Portfolio

      • 10.9.6. Business Performance

      • 10.9.7. Key Strategic Moves and Developments

    • 10.10. NXP Semiconductors

      • 10.10.1. Company Overview

      • 10.10.2. Key Executives

      • 10.10.3. Company Snapshot

      • 10.10.4. Operating Business Segments

      • 10.10.5. Product Portfolio

      • 10.10.6. Business Performance

      • 10.10.7. Key Strategic Moves and Developments

  • LIST OF TABLES

  • TABLE 1. GLOBAL DIFFERENTIAL PRESSURE SENSOR MARKET, BY PRODUCT TYPE, 2025-2033 ($MILLION)
  • TABLE 2. GLOBAL DIFFERENTIAL PRESSURE SENSOR MARKET FOR ANALOG, BY REGION, 2025-2033 ($MILLION)
  • TABLE 3. GLOBAL DIFFERENTIAL PRESSURE SENSOR MARKET FOR DIGITAL, BY REGION, 2025-2033 ($MILLION)
  • TABLE 4. GLOBAL DIFFERENTIAL PRESSURE SENSOR MARKET, BY ACCURACY TYPE, 2025-2033 ($MILLION)
  • TABLE 5. GLOBAL DIFFERENTIAL PRESSURE SENSOR MARKET FOR 1–2%, BY REGION, 2025-2033 ($MILLION)
  • TABLE 6. GLOBAL DIFFERENTIAL PRESSURE SENSOR MARKET FOR 2–5%, BY REGION, 2025-2033 ($MILLION)
  • TABLE 7. GLOBAL DIFFERENTIAL PRESSURE SENSOR MARKET FOR >5%, BY REGION, 2025-2033 ($MILLION)
  • TABLE 8. GLOBAL DIFFERENTIAL PRESSURE SENSOR MARKET, BY APPLICATION, 2025-2033 ($MILLION)
  • TABLE 9. GLOBAL DIFFERENTIAL PRESSURE SENSOR MARKET FOR HVAC SYSTEMS, BY REGION, 2025-2033 ($MILLION)
  • TABLE 10. GLOBAL DIFFERENTIAL PRESSURE SENSOR MARKET FOR PROCESS CONTROL, BY REGION, 2025-2033 ($MILLION)
  • TABLE 11. GLOBAL DIFFERENTIAL PRESSURE SENSOR MARKET FOR TEST AND MEASUREMENT, BY REGION, 2025-2033 ($MILLION)
  • TABLE 12. GLOBAL DIFFERENTIAL PRESSURE SENSOR MARKET FOR NAVIGATION, BY REGION, 2025-2033 ($MILLION)
  • TABLE 13. GLOBAL DIFFERENTIAL PRESSURE SENSOR MARKET FOR OTHERS, BY REGION, 2025-2033 ($MILLION)
  • TABLE 14. GLOBAL DIFFERENTIAL PRESSURE SENSOR MARKET, BY INDUSTRY VERTICAL, 2025-2033 ($MILLION)
  • TABLE 15. GLOBAL DIFFERENTIAL PRESSURE SENSOR MARKET FOR CONSUMER ELECTRONICS, BY REGION, 2025-2033 ($MILLION)
  • TABLE 16. GLOBAL DIFFERENTIAL PRESSURE SENSOR MARKET FOR AUTOMOTIVE, BY REGION, 2025-2033 ($MILLION)
  • TABLE 17. GLOBAL DIFFERENTIAL PRESSURE SENSOR MARKET FOR INDUSTRIAL, BY REGION, 2025-2033 ($MILLION)
  • TABLE 18. GLOBAL DIFFERENTIAL PRESSURE SENSOR MARKET FOR AEROSPACE AND DEFENSE, BY REGION, 2025-2033 ($MILLION)
  • TABLE 19. GLOBAL DIFFERENTIAL PRESSURE SENSOR MARKET FOR OTHERS, BY REGION, 2025-2033 ($MILLION)
  • TABLE 20. GLOBAL DIFFERENTIAL PRESSURE SENSOR MARKET, BY REGION, 2025-2033 ($MILLION)
  • TABLE 21. NORTH AMERICA DIFFERENTIAL PRESSURE SENSOR, BY REGION, 2025-2033 ($MILLION)
  • TABLE 22. NORTH AMERICA DIFFERENTIAL PRESSURE SENSOR, BY PRODUCT TYPE, 2025-2033 ($MILLION)
  • TABLE 23. NORTH AMERICA DIFFERENTIAL PRESSURE SENSOR, BY ACCURACY TYPE, 2025-2033 ($MILLION)
  • TABLE 24. NORTH AMERICA DIFFERENTIAL PRESSURE SENSOR, BY APPLICATION, 2025-2033 ($MILLION)
  • TABLE 25. NORTH AMERICA DIFFERENTIAL PRESSURE SENSOR, BY INDUSTRY VERTICAL, 2025-2033 ($MILLION)
  • TABLE 26. U.S. DIFFERENTIAL PRESSURE SENSOR, BY PRODUCT TYPE, 2025-2033 ($MILLION)
  • TABLE 27. U.S. DIFFERENTIAL PRESSURE SENSOR, BY ACCURACY TYPE, 2025-2033 ($MILLION)
  • TABLE 28. U.S. DIFFERENTIAL PRESSURE SENSOR, BY APPLICATION, 2025-2033 ($MILLION)
  • TABLE 29. U.S. DIFFERENTIAL PRESSURE SENSOR, BY INDUSTRY VERTICAL, 2025-2033 ($MILLION)
  • TABLE 30. CANADA DIFFERENTIAL PRESSURE SENSOR, BY PRODUCT TYPE, 2025-2033 ($MILLION)
  • TABLE 31. CANADA DIFFERENTIAL PRESSURE SENSOR, BY ACCURACY TYPE, 2025-2033 ($MILLION)
  • TABLE 32. CANADA DIFFERENTIAL PRESSURE SENSOR, BY APPLICATION, 2025-2033 ($MILLION)
  • TABLE 33. CANADA DIFFERENTIAL PRESSURE SENSOR, BY INDUSTRY VERTICAL, 2025-2033 ($MILLION)
  • TABLE 34. MEXICO DIFFERENTIAL PRESSURE SENSOR, BY PRODUCT TYPE, 2025-2033 ($MILLION)
  • TABLE 35. MEXICO DIFFERENTIAL PRESSURE SENSOR, BY ACCURACY TYPE, 2025-2033 ($MILLION)
  • TABLE 36. MEXICO DIFFERENTIAL PRESSURE SENSOR, BY APPLICATION, 2025-2033 ($MILLION)
  • TABLE 37. MEXICO DIFFERENTIAL PRESSURE SENSOR, BY INDUSTRY VERTICAL, 2025-2033 ($MILLION)
  • TABLE 38. EUROPE DIFFERENTIAL PRESSURE SENSOR, BY REGION, 2025-2033 ($MILLION)
  • TABLE 39. EUROPE DIFFERENTIAL PRESSURE SENSOR, BY PRODUCT TYPE, 2025-2033 ($MILLION)
  • TABLE 40. EUROPE DIFFERENTIAL PRESSURE SENSOR, BY ACCURACY TYPE, 2025-2033 ($MILLION)
  • TABLE 41. EUROPE DIFFERENTIAL PRESSURE SENSOR, BY APPLICATION, 2025-2033 ($MILLION)
  • TABLE 42. EUROPE DIFFERENTIAL PRESSURE SENSOR, BY INDUSTRY VERTICAL, 2025-2033 ($MILLION)
  • TABLE 43. FRANCE DIFFERENTIAL PRESSURE SENSOR, BY PRODUCT TYPE, 2025-2033 ($MILLION)
  • TABLE 44. FRANCE DIFFERENTIAL PRESSURE SENSOR, BY ACCURACY TYPE, 2025-2033 ($MILLION)
  • TABLE 45. FRANCE DIFFERENTIAL PRESSURE SENSOR, BY APPLICATION, 2025-2033 ($MILLION)
  • TABLE 46. FRANCE DIFFERENTIAL PRESSURE SENSOR, BY INDUSTRY VERTICAL, 2025-2033 ($MILLION)
  • TABLE 47. GERMANY DIFFERENTIAL PRESSURE SENSOR, BY PRODUCT TYPE, 2025-2033 ($MILLION)
  • TABLE 48. GERMANY DIFFERENTIAL PRESSURE SENSOR, BY ACCURACY TYPE, 2025-2033 ($MILLION)
  • TABLE 49. GERMANY DIFFERENTIAL PRESSURE SENSOR, BY APPLICATION, 2025-2033 ($MILLION)
  • TABLE 50. GERMANY DIFFERENTIAL PRESSURE SENSOR, BY INDUSTRY VERTICAL, 2025-2033 ($MILLION)
  • TABLE 51. ITALY DIFFERENTIAL PRESSURE SENSOR, BY PRODUCT TYPE, 2025-2033 ($MILLION)
  • TABLE 52. ITALY DIFFERENTIAL PRESSURE SENSOR, BY ACCURACY TYPE, 2025-2033 ($MILLION)
  • TABLE 53. ITALY DIFFERENTIAL PRESSURE SENSOR, BY APPLICATION, 2025-2033 ($MILLION)
  • TABLE 54. ITALY DIFFERENTIAL PRESSURE SENSOR, BY INDUSTRY VERTICAL, 2025-2033 ($MILLION)
  • TABLE 55. SPAIN DIFFERENTIAL PRESSURE SENSOR, BY PRODUCT TYPE, 2025-2033 ($MILLION)
  • TABLE 56. SPAIN DIFFERENTIAL PRESSURE SENSOR, BY ACCURACY TYPE, 2025-2033 ($MILLION)
  • TABLE 57. SPAIN DIFFERENTIAL PRESSURE SENSOR, BY APPLICATION, 2025-2033 ($MILLION)
  • TABLE 58. SPAIN DIFFERENTIAL PRESSURE SENSOR, BY INDUSTRY VERTICAL, 2025-2033 ($MILLION)
  • TABLE 59. UK DIFFERENTIAL PRESSURE SENSOR, BY PRODUCT TYPE, 2025-2033 ($MILLION)
  • TABLE 60. UK DIFFERENTIAL PRESSURE SENSOR, BY ACCURACY TYPE, 2025-2033 ($MILLION)
  • TABLE 61. UK DIFFERENTIAL PRESSURE SENSOR, BY APPLICATION, 2025-2033 ($MILLION)
  • TABLE 62. UK DIFFERENTIAL PRESSURE SENSOR, BY INDUSTRY VERTICAL, 2025-2033 ($MILLION)
  • TABLE 63. RUSSIA DIFFERENTIAL PRESSURE SENSOR, BY PRODUCT TYPE, 2025-2033 ($MILLION)
  • TABLE 64. RUSSIA DIFFERENTIAL PRESSURE SENSOR, BY ACCURACY TYPE, 2025-2033 ($MILLION)
  • TABLE 65. RUSSIA DIFFERENTIAL PRESSURE SENSOR, BY APPLICATION, 2025-2033 ($MILLION)
  • TABLE 66. RUSSIA DIFFERENTIAL PRESSURE SENSOR, BY INDUSTRY VERTICAL, 2025-2033 ($MILLION)
  • TABLE 67. REST OF EUROPE DIFFERENTIAL PRESSURE SENSOR, BY PRODUCT TYPE, 2025-2033 ($MILLION)
  • TABLE 68. REST OF EUROPE DIFFERENTIAL PRESSURE SENSOR, BY ACCURACY TYPE, 2025-2033 ($MILLION)
  • TABLE 69. REST OF EUROPE DIFFERENTIAL PRESSURE SENSOR, BY APPLICATION, 2025-2033 ($MILLION)
  • TABLE 70. REST OF EUROPE DIFFERENTIAL PRESSURE SENSOR, BY INDUSTRY VERTICAL, 2025-2033 ($MILLION)
  • TABLE 71. ASIA-PACIFIC DIFFERENTIAL PRESSURE SENSOR, BY REGION, 2025-2033 ($MILLION)
  • TABLE 72. ASIA-PACIFIC DIFFERENTIAL PRESSURE SENSOR, BY PRODUCT TYPE, 2025-2033 ($MILLION)
  • TABLE 73. ASIA-PACIFIC DIFFERENTIAL PRESSURE SENSOR, BY ACCURACY TYPE, 2025-2033 ($MILLION)
  • TABLE 74. ASIA-PACIFIC DIFFERENTIAL PRESSURE SENSOR, BY APPLICATION, 2025-2033 ($MILLION)
  • TABLE 75. ASIA-PACIFIC DIFFERENTIAL PRESSURE SENSOR, BY INDUSTRY VERTICAL, 2025-2033 ($MILLION)
  • TABLE 76. CHINA DIFFERENTIAL PRESSURE SENSOR, BY PRODUCT TYPE, 2025-2033 ($MILLION)
  • TABLE 77. CHINA DIFFERENTIAL PRESSURE SENSOR, BY ACCURACY TYPE, 2025-2033 ($MILLION)
  • TABLE 78. CHINA DIFFERENTIAL PRESSURE SENSOR, BY APPLICATION, 2025-2033 ($MILLION)
  • TABLE 79. CHINA DIFFERENTIAL PRESSURE SENSOR, BY INDUSTRY VERTICAL, 2025-2033 ($MILLION)
  • TABLE 80. JAPAN DIFFERENTIAL PRESSURE SENSOR, BY PRODUCT TYPE, 2025-2033 ($MILLION)
  • TABLE 81. JAPAN DIFFERENTIAL PRESSURE SENSOR, BY ACCURACY TYPE, 2025-2033 ($MILLION)
  • TABLE 82. JAPAN DIFFERENTIAL PRESSURE SENSOR, BY APPLICATION, 2025-2033 ($MILLION)
  • TABLE 83. JAPAN DIFFERENTIAL PRESSURE SENSOR, BY INDUSTRY VERTICAL, 2025-2033 ($MILLION)
  • TABLE 84. INDIA DIFFERENTIAL PRESSURE SENSOR, BY PRODUCT TYPE, 2025-2033 ($MILLION)
  • TABLE 85. INDIA DIFFERENTIAL PRESSURE SENSOR, BY ACCURACY TYPE, 2025-2033 ($MILLION)
  • TABLE 86. INDIA DIFFERENTIAL PRESSURE SENSOR, BY APPLICATION, 2025-2033 ($MILLION)
  • TABLE 87. INDIA DIFFERENTIAL PRESSURE SENSOR, BY INDUSTRY VERTICAL, 2025-2033 ($MILLION)
  • TABLE 88. SOUTH KOREA DIFFERENTIAL PRESSURE SENSOR, BY PRODUCT TYPE, 2025-2033 ($MILLION)
  • TABLE 89. SOUTH KOREA DIFFERENTIAL PRESSURE SENSOR, BY ACCURACY TYPE, 2025-2033 ($MILLION)
  • TABLE 90. SOUTH KOREA DIFFERENTIAL PRESSURE SENSOR, BY APPLICATION, 2025-2033 ($MILLION)
  • TABLE 91. SOUTH KOREA DIFFERENTIAL PRESSURE SENSOR, BY INDUSTRY VERTICAL, 2025-2033 ($MILLION)
  • TABLE 92. AUSTRALIA DIFFERENTIAL PRESSURE SENSOR, BY PRODUCT TYPE, 2025-2033 ($MILLION)
  • TABLE 93. AUSTRALIA DIFFERENTIAL PRESSURE SENSOR, BY ACCURACY TYPE, 2025-2033 ($MILLION)
  • TABLE 94. AUSTRALIA DIFFERENTIAL PRESSURE SENSOR, BY APPLICATION, 2025-2033 ($MILLION)
  • TABLE 95. AUSTRALIA DIFFERENTIAL PRESSURE SENSOR, BY INDUSTRY VERTICAL, 2025-2033 ($MILLION)
  • TABLE 96. THAILAND DIFFERENTIAL PRESSURE SENSOR, BY PRODUCT TYPE, 2025-2033 ($MILLION)
  • TABLE 97. THAILAND DIFFERENTIAL PRESSURE SENSOR, BY ACCURACY TYPE, 2025-2033 ($MILLION)
  • TABLE 98. THAILAND DIFFERENTIAL PRESSURE SENSOR, BY APPLICATION, 2025-2033 ($MILLION)
  • TABLE 99. THAILAND DIFFERENTIAL PRESSURE SENSOR, BY INDUSTRY VERTICAL, 2025-2033 ($MILLION)
  • TABLE 100. MALAYSIA DIFFERENTIAL PRESSURE SENSOR, BY PRODUCT TYPE, 2025-2033 ($MILLION)
  • TABLE 101. MALAYSIA DIFFERENTIAL PRESSURE SENSOR, BY ACCURACY TYPE, 2025-2033 ($MILLION)
  • TABLE 102. MALAYSIA DIFFERENTIAL PRESSURE SENSOR, BY APPLICATION, 2025-2033 ($MILLION)
  • TABLE 103. MALAYSIA DIFFERENTIAL PRESSURE SENSOR, BY INDUSTRY VERTICAL, 2025-2033 ($MILLION)
  • TABLE 104. INDONESIA DIFFERENTIAL PRESSURE SENSOR, BY PRODUCT TYPE, 2025-2033 ($MILLION)
  • TABLE 105. INDONESIA DIFFERENTIAL PRESSURE SENSOR, BY ACCURACY TYPE, 2025-2033 ($MILLION)
  • TABLE 106. INDONESIA DIFFERENTIAL PRESSURE SENSOR, BY APPLICATION, 2025-2033 ($MILLION)
  • TABLE 107. INDONESIA DIFFERENTIAL PRESSURE SENSOR, BY INDUSTRY VERTICAL, 2025-2033 ($MILLION)
  • TABLE 108. REST OF ASIA PACIFIC DIFFERENTIAL PRESSURE SENSOR, BY PRODUCT TYPE, 2025-2033 ($MILLION)
  • TABLE 109. REST OF ASIA PACIFIC DIFFERENTIAL PRESSURE SENSOR, BY ACCURACY TYPE, 2025-2033 ($MILLION)
  • TABLE 110. REST OF ASIA PACIFIC DIFFERENTIAL PRESSURE SENSOR, BY APPLICATION, 2025-2033 ($MILLION)
  • TABLE 111. REST OF ASIA PACIFIC DIFFERENTIAL PRESSURE SENSOR, BY INDUSTRY VERTICAL, 2025-2033 ($MILLION)
  • TABLE 112. LAMEA DIFFERENTIAL PRESSURE SENSOR, BY REGION, 2025-2033 ($MILLION)
  • TABLE 113. LAMEA DIFFERENTIAL PRESSURE SENSOR, BY PRODUCT TYPE, 2025-2033 ($MILLION)
  • TABLE 114. LAMEA DIFFERENTIAL PRESSURE SENSOR, BY ACCURACY TYPE, 2025-2033 ($MILLION)
  • TABLE 115. LAMEA DIFFERENTIAL PRESSURE SENSOR, BY APPLICATION, 2025-2033 ($MILLION)
  • TABLE 116. LAMEA DIFFERENTIAL PRESSURE SENSOR, BY INDUSTRY VERTICAL, 2025-2033 ($MILLION)
  • TABLE 117. BRAZIL DIFFERENTIAL PRESSURE SENSOR, BY PRODUCT TYPE, 2025-2033 ($MILLION)
  • TABLE 118. BRAZIL DIFFERENTIAL PRESSURE SENSOR, BY ACCURACY TYPE, 2025-2033 ($MILLION)
  • TABLE 119. BRAZIL DIFFERENTIAL PRESSURE SENSOR, BY APPLICATION, 2025-2033 ($MILLION)
  • TABLE 120. BRAZIL DIFFERENTIAL PRESSURE SENSOR, BY INDUSTRY VERTICAL, 2025-2033 ($MILLION)
  • TABLE 121. SOUTH AFRICA DIFFERENTIAL PRESSURE SENSOR, BY PRODUCT TYPE, 2025-2033 ($MILLION)
  • TABLE 122. SOUTH AFRICA DIFFERENTIAL PRESSURE SENSOR, BY ACCURACY TYPE, 2025-2033 ($MILLION)
  • TABLE 123. SOUTH AFRICA DIFFERENTIAL PRESSURE SENSOR, BY APPLICATION, 2025-2033 ($MILLION)
  • TABLE 124. SOUTH AFRICA DIFFERENTIAL PRESSURE SENSOR, BY INDUSTRY VERTICAL, 2025-2033 ($MILLION)
  • TABLE 125. SAUDI ARABIA DIFFERENTIAL PRESSURE SENSOR, BY PRODUCT TYPE, 2025-2033 ($MILLION)
  • TABLE 126. SAUDI ARABIA DIFFERENTIAL PRESSURE SENSOR, BY ACCURACY TYPE, 2025-2033 ($MILLION)
  • TABLE 127. SAUDI ARABIA DIFFERENTIAL PRESSURE SENSOR, BY APPLICATION, 2025-2033 ($MILLION)
  • TABLE 128. SAUDI ARABIA DIFFERENTIAL PRESSURE SENSOR, BY INDUSTRY VERTICAL, 2025-2033 ($MILLION)
  • TABLE 129. UAE DIFFERENTIAL PRESSURE SENSOR, BY PRODUCT TYPE, 2025-2033 ($MILLION)
  • TABLE 130. UAE DIFFERENTIAL PRESSURE SENSOR, BY ACCURACY TYPE, 2025-2033 ($MILLION)
  • TABLE 131. UAE DIFFERENTIAL PRESSURE SENSOR, BY APPLICATION, 2025-2033 ($MILLION)
  • TABLE 132. UAE DIFFERENTIAL PRESSURE SENSOR, BY INDUSTRY VERTICAL, 2025-2033 ($MILLION)
  • TABLE 133. ARGENTINA DIFFERENTIAL PRESSURE SENSOR, BY PRODUCT TYPE, 2025-2033 ($MILLION)
  • TABLE 134. ARGENTINA DIFFERENTIAL PRESSURE SENSOR, BY ACCURACY TYPE, 2025-2033 ($MILLION)
  • TABLE 135. ARGENTINA DIFFERENTIAL PRESSURE SENSOR, BY APPLICATION, 2025-2033 ($MILLION)
  • TABLE 136. ARGENTINA DIFFERENTIAL PRESSURE SENSOR, BY INDUSTRY VERTICAL, 2025-2033 ($MILLION)
  • TABLE 137. REST OF LAMEA DIFFERENTIAL PRESSURE SENSOR, BY PRODUCT TYPE, 2025-2033 ($MILLION)
  • TABLE 138. REST OF LAMEA DIFFERENTIAL PRESSURE SENSOR, BY ACCURACY TYPE, 2025-2033 ($MILLION)
  • TABLE 139. REST OF LAMEA DIFFERENTIAL PRESSURE SENSOR, BY APPLICATION, 2025-2033 ($MILLION)
  • TABLE 140. REST OF LAMEA DIFFERENTIAL PRESSURE SENSOR, BY INDUSTRY VERTICAL, 2025-2033 ($MILLION)
  • TABLE 141. ABB LTD.: KEY EXECUTIVES
  • TABLE 142. ABB LTD.: COMPANY SNAPSHOT
  • TABLE 143. ABB LTD.: OPERATING SEGMENTS
  • TABLE 144. ABB LTD.: PRODUCT PORTFOLIO
  • TABLE 145. ABB LTD.: KEY STRATEGIC MOVES AND DEVELOPMENTS
  • TABLE 146. AMPHENOL ADVANCED SENSORS: KEY EXECUTIVES
  • TABLE 147. AMPHENOL ADVANCED SENSORS: COMPANY SNAPSHOT
  • TABLE 148. AMPHENOL ADVANCED SENSORS: OPERATING SEGMENTS
  • TABLE 149. AMPHENOL ADVANCED SENSORS: PRODUCT PORTFOLIO
  • TABLE 150. AMPHENOL ADVANCED SENSORS: KEY STRATEGIC MOVES AND DEVELOPMENTS
  • TABLE 151. KELLER CORP.: KEY EXECUTIVES
  • TABLE 152. KELLER CORP.: COMPANY SNAPSHOT
  • TABLE 153. KELLER CORP.: OPERATING SEGMENTS
  • TABLE 154. KELLER CORP.: PRODUCT PORTFOLIO
  • TABLE 155. KELLER CORP.: KEY STRATEGIC MOVES AND DEVELOPMENTS
  • TABLE 156. YOKOGAWA INDIA LTD.: KEY EXECUTIVES
  • TABLE 157. YOKOGAWA INDIA LTD.: COMPANY SNAPSHOT
  • TABLE 158. YOKOGAWA INDIA LTD.: OPERATING SEGMENTS
  • TABLE 159. YOKOGAWA INDIA LTD.: PRODUCT PORTFOLIO
  • TABLE 160. YOKOGAWA INDIA LTD.: KEY STRATEGIC MOVES AND DEVELOPMENTS
  • TABLE 161. OMRON CORP.: KEY EXECUTIVES
  • TABLE 162. OMRON CORP.: COMPANY SNAPSHOT
  • TABLE 163. OMRON CORP.: OPERATING SEGMENTS
  • TABLE 164. OMRON CORP.: PRODUCT PORTFOLIO
  • TABLE 165. OMRON CORP.: KEY STRATEGIC MOVES AND DEVELOPMENTS
  • TABLE 166. HONEYWELL INTERNATIONAL INC.: KEY EXECUTIVES
  • TABLE 167. HONEYWELL INTERNATIONAL INC.: COMPANY SNAPSHOT
  • TABLE 168. HONEYWELL INTERNATIONAL INC.: OPERATING SEGMENTS
  • TABLE 169. HONEYWELL INTERNATIONAL INC.: PRODUCT PORTFOLIO
  • TABLE 170. HONEYWELL INTERNATIONAL INC.: KEY STRATEGIC MOVES AND DEVELOPMENTS
  • TABLE 171. TEXAS INSTRUMENTS INC.: KEY EXECUTIVES
  • TABLE 172. TEXAS INSTRUMENTS INC.: COMPANY SNAPSHOT
  • TABLE 173. TEXAS INSTRUMENTS INC.: OPERATING SEGMENTS
  • TABLE 174. TEXAS INSTRUMENTS INC.: PRODUCT PORTFOLIO
  • TABLE 175. TEXAS INSTRUMENTS INC.: KEY STRATEGIC MOVES AND DEVELOPMENTS
  • TABLE 176. STMICROELECTRONICS: KEY EXECUTIVES
  • TABLE 177. STMICROELECTRONICS: COMPANY SNAPSHOT
  • TABLE 178. STMICROELECTRONICS: OPERATING SEGMENTS
  • TABLE 179. STMICROELECTRONICS: PRODUCT PORTFOLIO
  • TABLE 180. STMICROELECTRONICS: KEY STRATEGIC MOVES AND DEVELOPMENTS
  • TABLE 181. ROBERT BOSCH GMBH: KEY EXECUTIVES
  • TABLE 182. ROBERT BOSCH GMBH: COMPANY SNAPSHOT
  • TABLE 183. ROBERT BOSCH GMBH: OPERATING SEGMENTS
  • TABLE 184. ROBERT BOSCH GMBH: PRODUCT PORTFOLIO
  • TABLE 185. ROBERT BOSCH GMBH: KEY STRATEGIC MOVES AND DEVELOPMENTS
  • TABLE 186. NXP SEMICONDUCTORS: KEY EXECUTIVES
  • TABLE 187. NXP SEMICONDUCTORS: COMPANY SNAPSHOT
  • TABLE 188. NXP SEMICONDUCTORS: OPERATING SEGMENTS
  • TABLE 189. NXP SEMICONDUCTORS: PRODUCT PORTFOLIO
  • TABLE 190. NXP SEMICONDUCTORS: KEY STRATEGIC MOVES AND DEVELOPMENTS
  • LIST OF FIGURES

  • FIGURE 1. GLOBAL DIFFERENTIAL PRESSURE SENSOR MARKET SEGMENTATION
  • FIGURE 2. GLOBAL DIFFERENTIAL PRESSURE SENSOR MARKET
  • FIGURE 3. SEGMENTATION DIFFERENTIAL PRESSURE SENSOR MARKET
  • FIGURE 4. TOP INVESTMENT POCKET IN DIFFERENTIAL PRESSURE SENSOR MARKET
  • FIGURE 5. MODERATE BARGAINING POWER OF BUYERS
  • FIGURE 6. MODERATE BARGAINING POWER OF SUPPLIERS
  • FIGURE 7. MODERATE THREAT OF NEW ENTRANTS
  • FIGURE 8. LOW THREAT OF SUBSTITUTION
  • FIGURE 9. HIGH COMPETITIVE RIVALRY
  • FIGURE 10. OPPORTUNITIES, RESTRAINTS AND DRIVERS: GLOBALDIFFERENTIAL PRESSURE SENSOR MARKET
  • FIGURE 11. DIFFERENTIAL PRESSURE SENSOR MARKET SEGMENTATION, BY BY PRODUCT TYPE
  • FIGURE 12. DIFFERENTIAL PRESSURE SENSOR MARKET FOR ANALOG, BY COUNTRY, 2025-2033 ($MILLION)
  • FIGURE 13. DIFFERENTIAL PRESSURE SENSOR MARKET FOR DIGITAL, BY COUNTRY, 2025-2033 ($MILLION)
  • FIGURE 14. DIFFERENTIAL PRESSURE SENSOR MARKET SEGMENTATION, BY BY ACCURACY TYPE
  • FIGURE 15. DIFFERENTIAL PRESSURE SENSOR MARKET FOR 1–2%, BY COUNTRY, 2025-2033 ($MILLION)
  • FIGURE 16. DIFFERENTIAL PRESSURE SENSOR MARKET FOR 2–5%, BY COUNTRY, 2025-2033 ($MILLION)
  • FIGURE 17. DIFFERENTIAL PRESSURE SENSOR MARKET FOR >5%, BY COUNTRY, 2025-2033 ($MILLION)
  • FIGURE 18. DIFFERENTIAL PRESSURE SENSOR MARKET SEGMENTATION, BY BY APPLICATION
  • FIGURE 19. DIFFERENTIAL PRESSURE SENSOR MARKET FOR HVAC SYSTEMS, BY COUNTRY, 2025-2033 ($MILLION)
  • FIGURE 20. DIFFERENTIAL PRESSURE SENSOR MARKET FOR PROCESS CONTROL, BY COUNTRY, 2025-2033 ($MILLION)
  • FIGURE 21. DIFFERENTIAL PRESSURE SENSOR MARKET FOR TEST AND MEASUREMENT, BY COUNTRY, 2025-2033 ($MILLION)
  • FIGURE 22. DIFFERENTIAL PRESSURE SENSOR MARKET FOR NAVIGATION, BY COUNTRY, 2025-2033 ($MILLION)
  • FIGURE 23. DIFFERENTIAL PRESSURE SENSOR MARKET FOR OTHERS, BY COUNTRY, 2025-2033 ($MILLION)
  • FIGURE 24. DIFFERENTIAL PRESSURE SENSOR MARKET SEGMENTATION, BY BY INDUSTRY VERTICAL
  • FIGURE 25. DIFFERENTIAL PRESSURE SENSOR MARKET FOR CONSUMER ELECTRONICS, BY COUNTRY, 2025-2033 ($MILLION)
  • FIGURE 26. DIFFERENTIAL PRESSURE SENSOR MARKET FOR AUTOMOTIVE, BY COUNTRY, 2025-2033 ($MILLION)
  • FIGURE 27. DIFFERENTIAL PRESSURE SENSOR MARKET FOR INDUSTRIAL, BY COUNTRY, 2025-2033 ($MILLION)
  • FIGURE 28. DIFFERENTIAL PRESSURE SENSOR MARKET FOR AEROSPACE AND DEFENSE, BY COUNTRY, 2025-2033 ($MILLION)
  • FIGURE 29. DIFFERENTIAL PRESSURE SENSOR MARKET FOR OTHERS, BY COUNTRY, 2025-2033 ($MILLION)
  • FIGURE 30. TOP WINNING STRATEGIES, BY YEAR, 2022-2024*
  • FIGURE 31. TOP WINNING STRATEGIES, BY DEVELOPMENT, 2022-2024*
  • FIGURE 32. TOP WINNING STRATEGIES, BY COMPANY, 2022-2024*
  • FIGURE 33. PRODUCT MAPPING OF TOP 10 PLAYERS
  • FIGURE 34. COMPETITIVE DASHBOARD
  • FIGURE 35. COMPETITIVE HEATMAP: DIFFERENTIAL PRESSURE SENSOR MARKET
  • FIGURE 36. TOP PLAYER POSITIONING, 2024
  • FIGURE 37. ABB LTD.: NET SALES, 2022-2024 ($MILLION)
  • FIGURE 38. ABB LTD.: REVENUE SHARE, BY SEGMENT, 2024 (%)
  • FIGURE 39. ABB LTD.: REVENUE SHARE, BY REGION, 2024 (%)
  • FIGURE 40. AMPHENOL ADVANCED SENSORS: NET SALES, 2022-2024 ($MILLION)
  • FIGURE 41. AMPHENOL ADVANCED SENSORS: REVENUE SHARE, BY SEGMENT, 2024 (%)
  • FIGURE 42. AMPHENOL ADVANCED SENSORS: REVENUE SHARE, BY REGION, 2024 (%)
  • FIGURE 43. KELLER CORP.: NET SALES, 2022-2024 ($MILLION)
  • FIGURE 44. KELLER CORP.: REVENUE SHARE, BY SEGMENT, 2024 (%)
  • FIGURE 45. KELLER CORP.: REVENUE SHARE, BY REGION, 2024 (%)
  • FIGURE 46. YOKOGAWA INDIA LTD.: NET SALES, 2022-2024 ($MILLION)
  • FIGURE 47. YOKOGAWA INDIA LTD.: REVENUE SHARE, BY SEGMENT, 2024 (%)
  • FIGURE 48. YOKOGAWA INDIA LTD.: REVENUE SHARE, BY REGION, 2024 (%)
  • FIGURE 49. OMRON CORP.: NET SALES, 2022-2024 ($MILLION)
  • FIGURE 50. OMRON CORP.: REVENUE SHARE, BY SEGMENT, 2024 (%)
  • FIGURE 51. OMRON CORP.: REVENUE SHARE, BY REGION, 2024 (%)
  • FIGURE 52. HONEYWELL INTERNATIONAL INC.: NET SALES, 2022-2024 ($MILLION)
  • FIGURE 53. HONEYWELL INTERNATIONAL INC.: REVENUE SHARE, BY SEGMENT, 2024 (%)
  • FIGURE 54. HONEYWELL INTERNATIONAL INC.: REVENUE SHARE, BY REGION, 2024 (%)
  • FIGURE 55. TEXAS INSTRUMENTS INC.: NET SALES, 2022-2024 ($MILLION)
  • FIGURE 56. TEXAS INSTRUMENTS INC.: REVENUE SHARE, BY SEGMENT, 2024 (%)
  • FIGURE 57. TEXAS INSTRUMENTS INC.: REVENUE SHARE, BY REGION, 2024 (%)
  • FIGURE 58. STMICROELECTRONICS: NET SALES, 2022-2024 ($MILLION)
  • FIGURE 59. STMICROELECTRONICS: REVENUE SHARE, BY SEGMENT, 2024 (%)
  • FIGURE 60. STMICROELECTRONICS: REVENUE SHARE, BY REGION, 2024 (%)
  • FIGURE 61. ROBERT BOSCH GMBH: NET SALES, 2022-2024 ($MILLION)
  • FIGURE 62. ROBERT BOSCH GMBH: REVENUE SHARE, BY SEGMENT, 2024 (%)
  • FIGURE 63. ROBERT BOSCH GMBH: REVENUE SHARE, BY REGION, 2024 (%)
  • FIGURE 64. NXP SEMICONDUCTORS: NET SALES, 2022-2024 ($MILLION)
  • FIGURE 65. NXP SEMICONDUCTORS: REVENUE SHARE, BY SEGMENT, 2024 (%)
  • FIGURE 66. NXP SEMICONDUCTORS: REVENUE SHARE, BY REGION, 2024 (%)

Purchase Full Report of
Differential Pressure Sensor Market

PURCHASE OPTIONS


* Taxes/Fees, If applicable will be added during checkout. All prices in USD.

Have a question ?

Need to add more ?

Avail up to 30% discount on subscription plans on


Avenue