Int'l : +1-503-894-6022 | Toll Free : +1-800-792-5285 | help@alliedmarketresearch.com
A06295 | Pages: 270 | Charts: 68 | Tables: 148 |
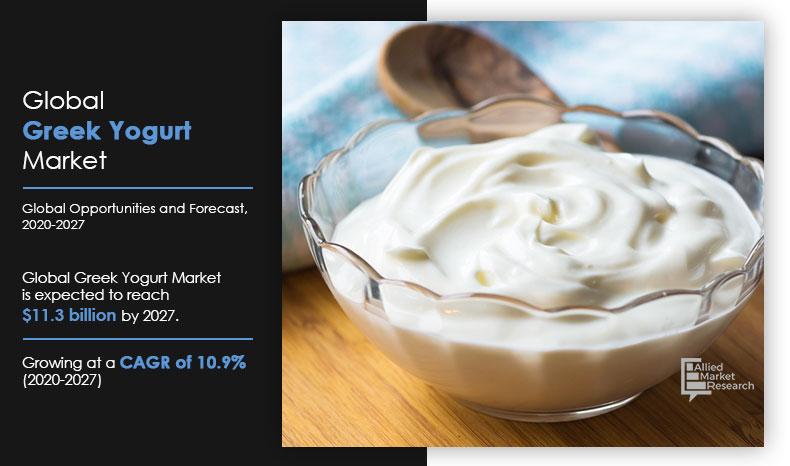
The Greek yogurt market size was valued at $7.2 billion in 2019, and is projected to reach $11.2 billion by 2027, growing at a CAGR of 10.9% from 2020 to 2027. Products made by fermented milk have enhanced digestibility, new and unique flavors, added probiotics, vitamins, and minerals. These act as preservation products for a food that normally has a very short shelf life. Fermented milk is prepared through inoculation of culture and enzyme, which converts lactose to lactic acid. This inoculation and fermentation process of milk offers various ranges of products such as butter, cheese, yogurt, Kefir, and others. Yogurt is a famous food in this category. Due to the above-mentioned properties yogurt offers an array of health benefits. It is a major source of probiotic bacteria. During the conversion process, various substances are released, which include diacetyl, acetic acid, and acetaldehyde that help impart characteristic taste and aroma to the yogurt. These fermented dairy products not only impart taste but also provide texture and consistency to certain products such as dips and sauces.
Get more information on this report : Request Sample Pages
Consumers who are intolerant to lactose prefer fermented yogurt as it is easy to digest as compared to unfermented milk. Hence, there is an increase in the demand for yogurt among people suffering from lactose intolerance. Changes in consumption pattern among the consumers contributes toward the growth of the Greek yogurt market. The most significant health benefits offered by Greek yogurt is improved digestibility and the probiotic bacteria present in the product, which helps to suppress certain pathogens through its antibacterial property. Thereby, propelling the market growth. Greek yogurt is also considered to have anti- carcinogenic effect and may protect against certain cancers. Apart from health benefits, fermentation process helps to prolong the shelf life of the Greek yogurt. It also enhances the taste and aroma of the products. Rise in number of product launches is expected to drive the Greek yogurt market forecast. Development of new products with improved taste and versatility, along with high marketing support, leads to the launch of several new products in the recent past. The Greek yogurt market outlook is positive with the launch of several new products during the forecast period, and the Greek yogurt market is expected to experience growth during the forecast period.
[PRODUCTTYPEGRAPH]
Get more information on this report : Request Sample Pages
However, selection of appropriate culture required for fermentation process of dairy products is a severe problem faced by the Greek yogurt manufacturers. As not every culture helps to extend the shelf life of the product. This restrains the Greek yogurt market growth. In addition, government regulation in certain countries regarding the permissible culture for fermentation process hampers the Greek yogurt market share.
The Greek yogurt market is segmented into type, flavor, distribution channel, source, and region. By product type, it is categorized into whole milk, low fat, and nonfat. By flavor, it is classified into plain, strawberry, blueberry, vanilla, and others. By distribution channel, the market is divided into supermarket/hypermarket, convenience stores, online stores, and others. By source, it is bifurcated into organic and conventional. By region, the Greek yogurt market is analyzed across North America, Europe, Asia-Pacific, and LAMEA.
[FLAVORGRAPH]
Get more information on this report : Request Sample Pages
North America and Europe are known to be the dominant regions in the Greek yogurt market analysis. European countries have witnessed higher rate of traction for Greek yogurt owing to the increased demand from the consumers. Some of the key macroeconomic factors such as rise in health awareness and surge in per-capita income also play an important role in contributing toward the overall growth of the Greek yogurt market.
[DISTRIBUTIONCHANNELGRAPH]
Get more information on this report : Request Sample Pages
However, Asia-Pacific Greek yogurt market is expected to exhibit significant growth in the future, owing to rise in demand for different types of fermented milk products such as yogurt, butter, and cheese consumed in fast food products. In addition, the region has witnessed considerable surge in the number of millennials, who are the forefront consumers of fermented milk products. Therefore, rise in millennial population is anticipated to offer remunerative opportunity for the growth of the Greek yogurt market.
[SOURCEGRAPH]
Get more information on this report : Request Sample Pages
Some of the key companies profiled in the Greek yogurt industry report include Chobani Global Holdings, Inc., FAGE International S.A, General Mills Inc.(Yoplait), Danone S.A., Stonyfield Farm (lactalis), Nestlé S.A., Unternehmensgruppe Theo Müller, The Hain Celestial Group (The Greek Gods), The Kroger Co., and Wallaby Organic.
[REGIONGRAPH]
Get more information on this report : Request Sample Pages
The report provides an extensive analysis of the current and emerging Greek yogurt market trends and opportunities in the market.
The report provides detailed qualitative and quantitative analysis of current trends and future estimations that help evaluate the prevailing market opportunities.
A comprehensive analysis of the factors that drive and restrict the growth of the market is provided.
An extensive analysis of the market is conducted by following key product positioning and monitoring the top competitors within the market framework.
The report provides extensive qualitative insights on the potential segments or regions exhibiting favorable growth.
Key Market Segments
Key Market Players
CHAPTER 1:INTRODUCTION
1.1.Report description
1.2.Key benefits for stakeholders
1.3.Key market segment
1.4.Research methodology
1.4.1.Primary research
1.4.2.Secondary research
1.4.3.Analyst tools and models
CHAPTER 2:EXECUTIVE SUMMARY
2.1.Key findings of the study
CHAPTER 3:MARKET OVERVIEW
3.1.Market definition and scope
3.2.Key findings
3.2.1.Top investment pockets
3.3.Porter's five forces analysis
3.4.Top player positioning
3.5.Market dynamics
3.5.1.Drivers
3.5.1.1.Increase in health consciousness among consumers
3.5.1.2.Growth in preference for clean-label snacking
3.5.1.3.Increase in application of Greek yogurt as a functional food
3.5.2.Restraint
3.5.2.1.Availability of dairy substitute products (plant-based food)
3.5.3.Opportunity
3.5.3.1.Surge in demand for organic dairy products
CHAPTER 4:GLOBAL GREEK YOGURT MARKET, BY TYPE
4.1.Overview
4.1.1.Market size and forecast
4.2.Whole Milk
4.2.1.Key market trends, growth factors and opportunities
4.2.2.Market size and forecast
4.2.3.Market analysis by country
4.3.Low-fat
4.3.1.Key market trends, growth factors and opportunities
4.3.2.Market size and forecast
4.3.3.Market analysis by country
4.4.Nonfat
4.4.1.Key market trends, growth factors and opportunities
4.4.2.Market size and forecast
4.4.3.Market analysis by country
CHAPTER 5:GLOBAL GREEK YOGURT MARKET, BY FLAVOR
5.1.Overview
5.1.1.Market size and forecast
5.2.Plain
5.2.1.Key market trends, growth factors and opportunities
5.2.2.Market size and forecast
5.2.3.Market analysis by country
5.3.Strawberry
5.3.1.Key market trends, growth factors and opportunities
5.3.2.Market size and forecast
5.3.3.Market analysis by country
5.4.Vanilla
5.4.1.Key market trends, growth factors and opportunities
5.4.2.Market size and forecast
5.4.3.Market analysis by country
5.5.Blueberry
5.5.1.Key market trends, growth factors and opportunities
5.5.2.Market size and forecast
5.5.3.Market analysis by country
5.6.Others
5.6.1.Key market trends, growth factors and opportunities
5.6.2.Market size and forecast
5.6.3.Market analysis by country
CHAPTER 6:GLOBAL GREEK YOGURT MARKET, BY DISTRIBUTION CHANNEL
6.1.Overview
6.1.1.Market size and forecast
6.2.Supermarket/Hypermarket
6.2.1.Key market trends, growth factors and opportunities
6.2.2.Market size and forecast
6.2.3.Market analysis by country
6.3.Convenience Stores
6.3.1.Key market trends, growth factors and opportunities
6.3.2.Market size and forecast
6.3.3.Market analysis by country
6.4.Online Stores
6.4.1.Key market trends, growth factors and opportunities
6.4.2.Market size and forecast
6.4.3.Market analysis by country
6.5.Others
6.5.1.Key market trends, growth factors and opportunities
6.5.2.Market size and forecast
6.5.3.Market analysis by country
CHAPTER 7:GLOBAL GREEK YOGURT MARKET, BY SOURCE
7.1.Overview
7.1.1.Market size and forecast
7.2.Organic
7.2.1.Key market trends, growth factors and opportunities
7.2.2.Market size and forecast
7.2.3.Market analysis by country
7.3.Conventional
7.3.1.Key market trends, growth factors and opportunities
7.3.2.Market size and forecast
7.3.3.Market analysis by country
CHAPTER 8:GREEK YOGURT MARKET, BY REGION
8.1.Overview
8.1.1.Market size and forecast, by region
8.2.North America
8.2.1.Key market trends, growth factors, and opportunities
8.2.2.Market size and forecast by type
8.2.3.Market size and forecast by flavor
8.2.4.Market size and forecast by distribution channel
8.2.5.Market size and forecast by source
8.2.6.Market analysis by country
8.2.6.1.U.S.
8.2.6.1.1.Market size and forecast by type
8.2.6.1.2.Market size and forecast by flavor
8.2.6.1.3.Market size and forecast by distribution channel
8.2.6.1.4.Market size and forecast by source
8.2.6.2.CANADA
8.2.6.2.1.Market size and forecast by type
8.2.6.2.2.Market size and forecast by flavor
8.2.6.2.3.Market size and forecast by distribution channel
8.2.6.2.4.Market size and forecast by source
8.2.6.3.MEXICO
8.2.6.3.1.Market size and forecast by type
8.2.6.3.2.Market size and forecast by flavor
8.2.6.3.3.Market size and forecast by distribution channel
8.2.6.3.4.Market size and forecast by source
8.3.Europe
8.3.1.Key market trends, growth factors, and opportunities
8.3.2.Market size and forecast by type
8.3.3.Market size and forecast by flavor
8.3.4.Market size and forecast by distribution channel
8.3.5.Market size and forecast by source
8.3.6.Market analysis by country
8.3.6.1.GERMANY
8.3.6.1.1.Market size and forecast by type
8.3.6.1.2.Market size and forecast by flavor
8.3.6.1.3.Market size and forecast by distribution channel
8.3.6.1.4.Market size and forecast by source
8.3.6.2.FRANCE
8.3.6.2.1.Market size and forecast by type
8.3.6.2.2.Market size and forecast by flavor
8.3.6.2.3.Market size and forecast by distribution channel
8.3.6.2.4.Market size and forecast by source
8.3.6.3.UK
8.3.6.3.1.Market size and forecast by type
8.3.6.3.2.Market size and forecast by flavor
8.3.6.3.3.Market size and forecast by distribution channel
8.3.6.3.4.Market size and forecast by source
8.3.6.4.ITALY
8.3.6.4.1.Market size and forecast by type
8.3.6.4.2.Market size and forecast by flavor
8.3.6.4.3.Market size and forecast by distribution channel
8.3.6.4.4.Market size and forecast by source
8.3.6.5.SPAIN
8.3.6.5.1.Market size and forecast by type
8.3.6.5.2.Market size and forecast by flavor
8.3.6.5.3.Market size and forecast by distribution channel
8.3.6.5.4.Market size and forecast by source
8.3.6.6.REST OF EUROPE
8.3.6.6.1.Market size and forecast by type
8.3.6.6.2.Market size and forecast by flavor
8.3.6.6.3.Market size and forecast by distribution channel
8.3.6.6.4.Market size and forecast by source
8.4.Asia-Pacific
8.4.1.Key market trends, growth factors, and opportunities
8.4.2.Market size and forecast by type
8.4.3.Market size and forecast by flavor
8.4.4.Market size and forecast by distribution channel
8.4.5.Market size and forecast by source
8.4.6.Market analysis by country
8.4.6.1.CHINA
8.4.6.1.1.Market size and forecast by type
8.4.6.1.2.Market size and forecast by flavor
8.4.6.1.3.Market size and forecast by distribution channel
8.4.6.1.4.Market size and forecast by source
8.4.6.2.INDIA
8.4.6.2.1.Market size and forecast by type
8.4.6.2.2.Market size and forecast by flavor
8.4.6.2.3.Market size and forecast by distribution channel
8.4.6.2.4.Market size and forecast by source
8.4.6.3.JAPAN
8.4.6.3.1.Market size and forecast by type
8.4.6.3.2.Market size and forecast by flavor
8.4.6.3.3.Market size and forecast by distribution channel
8.4.6.3.4.Market size and forecast by source
8.4.6.4.AUSTRALIA
8.4.6.4.1.Market size and forecast by type
8.4.6.4.2.Market size and forecast by flavor
8.4.6.4.3.Market size and forecast by distribution channel
8.4.6.4.4.Market size and forecast by source
8.4.6.5.REST OF ASIA-PACIFIC
8.4.6.5.1.Market size and forecast by type
8.4.6.5.2.Market size and forecast by flavor
8.4.6.5.3.Market size and forecast by distribution channel
8.4.6.5.4.Market size and forecast by source
8.5.LAMEA
8.5.1.Key market trends, growth factors, and opportunities
8.5.2.Market size and forecast by type
8.5.3.Market size and forecast by flavor
8.5.4.Market size and forecast by distribution channel
8.5.5.Market size and forecast by source
8.5.6.Market analysis by country
8.5.6.1.LATIN AMERICA
8.5.6.1.1.Market size and forecast by type
8.5.6.1.2.Market size and forecast by flavor
8.5.6.1.3.Market size and forecast by distribution channel
8.5.6.1.4.Market size and forecast by source
8.5.6.2.MIDDLE EAST
8.5.6.2.1.Market size and forecast by type
8.5.6.2.2.Market size and forecast by flavor
8.5.6.2.3.Market size and forecast by distribution channel
8.5.6.2.4.Market size and forecast by source
8.5.6.3.AFRICA
8.5.6.3.1.Market size and forecast by type
8.5.6.3.2.Market size and forecast by flavor
8.5.6.3.3.Market size and forecast by distribution channel
8.5.6.3.4.Market size and forecast by source
CHAPTER 9:COMPETITION LANDSCAPE
9.1.Product mapping
9.2.Competitive dashboard
9.3.Competitive Heat map
CHAPTER 10:COMPANY PROFILES
10.1.CHOBANI, LLC.
10.1.1.Company overview
10.1.2.Key Executive
10.1.3.Company snapshot
10.1.4.Product portfolio
10.1.5.Key strategic moves and developments
10.2.DANONE
10.2.1.Company overview
10.2.2.Key Executives
10.2.3.Company snapshot
10.2.4.Operating business segments
10.2.5.Product portfolio
10.2.6.Business performance
10.3.FAGE INTERNATIONAL S.A.
10.3.1.Company overview
10.3.2.Key Executives
10.3.3.Company snapshot
10.3.4.Product portfolio
10.3.5.Business performance
10.3.6.Key strategic moves and developments
10.4.GENERAL MILLS, INC. (YOPLAIT)
10.4.1.Company overview
10.4.2.Key Executives
10.4.3.Company snapshot
10.4.4.Operating business segments
10.4.5.Product portfolio
10.4.6.R&D Expenditure
10.4.7.Business performance
10.5.MULLER UK & IRELAND GROUP LLP
10.5.1.Company overview
10.5.2.Key Executive
10.5.3.Company snapshot
10.5.4.Product portfolio
10.6.NESTLE S.A.
10.6.1.Company overview
10.6.2.Key Executives
10.6.3.Company snapshot
10.6.4.Operating business segments
10.6.5.Product portfolio
10.6.6.Business performance
10.6.7.Key strategic moves and developments
10.7.PARMALAT S.P.A.
10.7.1.Company overview
10.7.2.Key Executives
10.7.3.Company snapshot
10.7.4.Product portfolio
10.7.5.Business performance
10.8.The Hain Celestial Group( The Greek Gods)
10.8.1.Company overview
10.8.2.Key Executives
10.8.3.Company snapshot
10.8.4.Product portfolio
10.8.5.R&D Expenditure
10.8.6.Business performance
10.9.THE KROGER CO.
10.9.1.Company overview
10.9.2.Key Executives
10.9.3.Company snapshot
10.9.4.Product portfolio
10.9.5.Business performance
10.10.WALLABY YOGURT COMPANY
10.10.1.Company overview
10.10.2.Company snapshot
10.10.3.Product portfolio
LIST OF TABLES
TABLE 01.GLOBAL GREEK YOGURT MARKET REVENUE, BY TYPE, 2019–2027 ($MILLION)
TABLE 02.WHOLE MILK GREEK YOGURT MARKET REVENUE, BY REGION, 2019–2027 ($MILLION)
TABLE 03.LOWFAT GREEK YOGURT MARKET REVENUELOWFAT, BY REGION, 2019–2027 ($MILLION)
TABLE 04.NONFAT GREEK YOGURT MARKET REVENUENONFAT, BY REGION, 2019–2027 ($MILLION)
TABLE 05.GLOBAL GREEK YOGURT MARKET REVENUE, BY FLAVOR, 2019–2027 ($MILLION)
TABLE 06.PLAIN GREEK YOGURT MARKET REVENUE, BY REGION, 2019–2027 ($MILLION)
TABLE 07.STRAWBERRY GREEK YOGURT MARKET REVENUE, BY REGION, 2019–2027 ($MILLION)
TABLE 08.VANILLA GREEK YOGURT MARKET REVENUE, BY REGION, 2019–2027 ($MILLION)
TABLE 09.BLUEBERRY GREEK YOGURT MARKET REVENUE, BY REGION, 2019–2027 ($MILLION)
TABLE 10.GREEK YOGURT MARKET REVENUE FOR OTHERS, BY REGION, 2019–2027 ($MILLION)
TABLE 11.GLOBAL GREEK YOGURT MARKET REVENUE, BY DISTRIBUTION CHANNEL, 2019–2027 ($MILLION)
TABLE 12.GREEK YOGURT MARKET REVENUE FOR SUPERMARKET/HYPERMARKET, BY REGION, 2019–2027 ($MILLION)
TABLE 13.GREEK YOGURT MARKET REVENUE FOR CONVENIENCE STORES, BY REGION, 2019–2027 ($MILLION)
TABLE 14.GREEK YOGURT MARKET REVENUE FOR ONLINE STORES, BY REGION, 2019–2027 ($MILLION)
TABLE 15.GREEK YOGURT MARKET REVENUE FOR OTHERS, BY REGION, 2019–2027 ($MILLION)
TABLE 16.GLOBAL GREEK YOGURT MARKET REVENUE, BY SOURCE, 2019–2027 ($MILLION)
TABLE 17.ORGANIC GREEK YOGURT MARKET REVENUE, BY REGION, 2019–2027 ($MILLION)
TABLE 18.CONVENTIONAL GREEK YOGURT MARKET REVENUE, BY REGION, 2019–2027 ($MILLION)
TABLE 19.GREEK YOGURT MARKET REVENUE, BY REGION, 2019–2027 ($MILLION)
TABLE 20.NORTH AMERICA GREEK YOGURT MARKET REVENUE, BY TYPE, 2019–2027 ($MILLION)
TABLE 21.NORTH AMERICA GREEK YOGURT MARKET, BY FLAVOR, 2019–2027 ($MILLION)
TABLE 22.NORTH AMERICA GREEK YOGURT MARKET, BY DISTRIBUTION CHANNEL, 2019–2027 ($MILLION)
TABLE 23.NORTH AMERICA GREEK YOGURT MARKET, BY SOURCE, 2019–2027 ($MILLION)
TABLE 24.NORTH AMERICA GREEK YOGURT MARKET, BY COUNTRY, 2019–2027 ($MILLION)
TABLE 25.U.S. GREEK YOGURT MARKET REVENUE, BY TYPE, 2019–2027 ($MILLION)
TABLE 26.U.S. GREEK YOGURT MARKET, BY FLAVOR, 2019–2027 ($MILLION)
TABLE 27.U.S. GREEK YOGURT MARKET REVENUE, BY DISTRIBUTION CHANNEL, 2019–2027 ($MILLION)
TABLE 28.U.S. GREEK YOGURT MARKET, BY SOURCE, 2019–2027 ($MILLION)
TABLE 29.CANADA GREEK YOGURT MARKET REVENUE, BY TYPE, 2019–2027 ($MILLION)
TABLE 30.CANADA GREEK YOGURT MARKET, BY FLAVOR, 2019–2027 ($MILLION)
TABLE 31.CANADA GREEK YOGURT MARKET REVENUE, BY DISTRIBUTION CHANNEL, 2019–2027 ($MILLION)
TABLE 32.CANADA GREEK YOGURT MARKET, BY SOURCE, 2019–2027 ($MILLION)
TABLE 33.MEXICO GREEK YOGURT MARKET REVENUE, BY TYPE, 2019–2027 ($MILLION)
TABLE 34.MEXICO GREEK YOGURT MARKET, BY FLAVOR, 2019–2027 ($MILLION)
TABLE 35.MEXICO GREEK YOGURT MARKET REVENUE, BY DISTRIBUTION CHANNEL, 2019–2027 ($MILLION)
TABLE 36.MEXICO GREEK YOGURT MARKET, BY SOURCE, 2019–2027 ($MILLION)
TABLE 37.EUROPE GREEK YOGURT MARKET REVENUE, BY TYPE, 2019–2027 ($MILLION)
TABLE 38.EUROPE GREEK YOGURT MARKET, BY FLAVOR, 2019–2027 ($MILLION)
TABLE 39.EUROPE GREEK YOGURT MARKET REVENUE, BY DISTRIBUTION CHANNEL, 2019–2027 ($MILLION)
TABLE 40.EUROPE GREEK YOGURT MARKET, BY SOURCE, 2019–2027 ($MILLION)
TABLE 41.EUROPE GREEK YOGURT MARKET, BY COUNTRY, 2019–2027 ($MILLION)
TABLE 42.GERMANY GREEK YOGURT MARKET REVENUE, BY TYPE, 2019–2027 ($MILLION)
TABLE 43.GERMANY GREEK YOGURT MARKET, BY FLAVOR, 2019–2027 ($MILLION)
TABLE 44.GERMANY GREEK YOGURT MARKET REVENUE, BY DISTRIBUTION CHANNEL, 2019–2027 ($MILLION)
TABLE 45.GERMANY GREEK YOGURT MARKET, BY SOURCE, 2019–2027 ($MILLION)
TABLE 46.FRANCE GREEK YOGURT MARKET REVENUE, BY TYPE, 2019–2027 ($MILLION)
TABLE 47.FRANCE GREEK YOGURT MARKET, BY FLAVOR, 2019–2027 ($MILLION)
TABLE 48.FRANCE GREEK YOGURT MARKET REVENUE, BY DISTRIBUTION CHANNEL, 2019–2027 ($MILLION)
TABLE 49.FRANCE GREEK YOGURT MARKET, BY SOURCE, 2019–2027 ($MILLION)
TABLE 50.UK GREEK YOGURT MARKET REVENUE, BY TYPE, 2019–2027 ($MILLION)
TABLE 51.UK GREEK YOGURT MARKET, BY FLAVOR, 2019–2027 ($MILLION)
TABLE 52.UK GREEK YOGURT MARKET REVENUE, BY DISTRIBUTION CHANNEL, 2019–2027 ($MILLION)
TABLE 53.UK GREEK YOGURT MARKET, BY SOURCE, 2019–2027 ($MILLION)
TABLE 54.ITALY GREEK YOGURT MARKET REVENUE, BY TYPE, 2019–2027 ($MILLION)
TABLE 55.ITALY GREEK YOGURT MARKET, BY FLAVOR, 2019–2027 ($MILLION)
TABLE 56.ITALY GREEK YOGURT MARKET REVENUE, BY DISTRIBUTION CHANNEL, 2019–2027 ($MILLION)
TABLE 57.ITALY GREEK YOGURT MARKET, BY SOURCE, 2019–2027 ($MILLION)
TABLE 58.SPAIN GREEK YOGURT MARKET REVENUE, BY TYPE, 2019–2027 ($MILLION)
TABLE 59.SPAIN GREEK YOGURT MARKET, BY FLAVOR, 2019–2027 ($MILLION)
TABLE 60.SPAIN GREEK YOGURT MARKET REVENUE, BY DISTRIBUTION CHANNEL, 2019–2027 ($MILLION)
TABLE 61.SPAIN GREEK YOGURT MARKET, BY SOURCE, 2019–2027 ($MILLION)
TABLE 62.REST OF EUROPE GREEK YOGURT MARKET REVENUE, BY TYPE, 2019–2027 ($MILLION)
TABLE 63.REST OF EUROPE GREEK YOGURT MARKET, BY FLAVOR, 2019–2027 ($MILLION)
TABLE 64.REST OF EUROPE GREEK YOGURT MARKET REVENUE, BY DISTRIBUTION CHANNEL, 2019–2027 ($MILLION)
TABLE 65.REST OF EUROPE GREEK YOGURT MARKET, BY SOURCE, 2019–2027 ($MILLION)
TABLE 66.ASIA-PACIFIC GREEK YOGURT MARKET REVENUE, BY TYPE, 2019–2027 ($MILLION)
TABLE 67.ASIA-PACIFIC GREEK YOGURT MARKET, BY FLAVOR, 2019–2027 ($MILLION)
TABLE 68.ASIA-PACIFIC GREEK YOGURT MARKET REVENUE, BY DISTRIBUTION CHANNEL, 2019–2027 ($MILLION)
TABLE 69.ASIA-PACIFIC GREEK YOGURT MARKET, BY SOURCE, 2019–2027 ($MILLION)
TABLE 70.ASIA-PACIFIC GREEK YOGURT MARKET, BY COUNTRY, 2019–2027 ($MILLION)
TABLE 71.CHINA GREEK YOGURT MARKET REVENUE, BY TYPE, 2019–2027 ($MILLION)
TABLE 72.CHINA GREEK YOGURT MARKET, BY FLAVOR, 2019–2027 ($MILLION)
TABLE 73.CHINA GREEK YOGURT MARKET REVENUE, BY DISTRIBUTION CHANNEL, 2019–2027 ($MILLION)
TABLE 74.CHINA GREEK YOGURT MARKET, BY SOURCE, 2019–2027 ($MILLION)
TABLE 75.INDIA GREEK YOGURT MARKET REVENUE, BY TYPE, 2019–2027 ($MILLION)
TABLE 76.INDIA GREEK YOGURT MARKET, BY FLAVOR, 2019–2027 ($MILLION)
TABLE 77.INDIA GREEK YOGURT MARKET REVENUE, BY DISTRIBUTION CHANNEL, 2019–2027 ($MILLION)
TABLE 78.INDIA GREEK YOGURT MARKET, BY SOURCE, 2019–2027 ($MILLION)
TABLE 79.JAPAN GREEK YOGURT MARKET REVENUE, BY TYPE, 2019–2027 ($MILLION)
TABLE 80.JAPAN GREEK YOGURT MARKET, BY FLAVOR, 2019–2027 ($MILLION)
TABLE 81.JAPAN GREEK YOGURT MARKET REVENUE, BY DISTRIBUTION CHANNEL, 2019–2027 ($MILLION)
TABLE 82.JAPAN GREEK YOGURT MARKET, BY SOURCE, 2019–2027 ($MILLION)
TABLE 83.AUSTRALIA GREEK YOGURT MARKET REVENUE, BY TYPE, 2019–2027 ($MILLION)
TABLE 84.AUSTRALIA GREEK YOGURT MARKET, BY FLAVOR, 2019–2027 ($MILLION)
TABLE 85.AUSTRALIA GREEK YOGURT MARKET REVENUE, BY DISTRIBUTION CHANNEL, 2019–2027 ($MILLION)
TABLE 86.AUSTRALIA GREEK YOGURT MARKET, BY SOURCE, 2019–2027 ($MILLION)
TABLE 87.REST OF ASIA-PACIFIC GREEK YOGURT MARKET REVENUE, BY TYPE, 2019–2027 ($MILLION)
TABLE 88.REST OF ASIA-PACIFIC GREEK YOGURT MARKET, BY FLAVOR, 2019–2027 ($MILLION)
TABLE 89.REST OF ASIA-PACIFIC GREEK YOGURT MARKET REVENUE, BY DISTRIBUTION CHANNEL, 2019–2027 ($MILLION)
TABLE 90.REST OF ASIA-PACIFIC GREEK YOGURT MARKET, BY SOURCE, 2019–2027 ($MILLION)
TABLE 91.LAMEA GREEK YOGURT MARKET REVENUE, BY TYPE, 2019–2027 ($MILLION)
TABLE 92.LAMEA GREEK YOGURT MARKET, BY FLAVOR, 2019–2027 ($MILLION)
TABLE 93.LAMEA GREEK YOGURT MARKET REVENUE, BY DISTRIBUTION CHANNEL, 2019–2027 ($MILLION)
TABLE 94.LAMEA GREEK YOGURT MARKET, BY SOURCE, 2019–2027 ($MILLION)
TABLE 95.LAMEA GREEK YOGURT MARKET, BY COUNTRY, 2019–2027 ($MILLION)
TABLE 96.LATIN AMERICA GREEK YOGURT MARKET REVENUE, BY TYPE, 2019–2027 ($MILLION)
TABLE 97.LATIN AMERICA GREEK YOGURT MARKET, BY FLAVOR, 2019–2027 ($MILLION)
TABLE 98.LATIN AMERICA GREEK YOGURT MARKET REVENUE, BY DISTRIBUTION CHANNEL, 2019–2027 ($MILLION)
TABLE 99.LATIN AMERICA GREEK YOGURT MARKET, BY SOURCE, 2019–2027 ($MILLION)
TABLE 100.MIDDLE EAST GREEK YOGURT MARKET REVENUE, BY TYPE, 2019–2027 ($MILLION)
TABLE 101.MIDDLE EAST GREEK YOGURT MARKET, BY FLAVOR, 2019–2027 ($MILLION)
TABLE 102.MIDDLE EAST GREEK YOGURT MARKET REVENUE, BY DISTRIBUTION CHANNEL, 2019–2027 ($MILLION)
TABLE 103.MIDDLE EAST GREEK YOGURT MARKET, BY SOURCE, 2019–2027 ($MILLION)
TABLE 104.AFRICA GREEK YOGURT MARKET REVENUE, BY TYPE, 2019–2027 ($MILLION)
TABLE 105.AFRICA GREEK YOGURT MARKET, BY FLAVOR, 2019–2027 ($MILLION)
TABLE 106.AFRICA GREEK YOGURT MARKET REVENUE, BY DISTRIBUTION CHANNEL, 2019–2027 ($MILLION)
TABLE 107.AFRICA GREEK YOGURT MARKET, BY SOURCE, 2019–2027 ($MILLION)
TABLE 108.CHOBANI, LLC: KEY EXECUTIVE
TABLE 109.CHOBANI, LLC: COMPANY SNAPSHOT
TABLE 110.CHOBANI, LLC: PRODUCT PORTFOLIO
TABLE 111.DANONE: KEY EXECUTIVES
TABLE 112.DANONE: COMPANY SNAPSHOT
TABLE 113.DANONE: KEY EXECUTIVES
TABLE 114.DANONE: PRODUCT PORTFOLIO
TABLE 115.DANONE: NET SALES, 2017–2019 ($MILLION)
TABLE 116.FAGE INTERNATIONAL S.A.: KEY EXECUTIVES
TABLE 117.FAGE INTERNATIONAL S.A.: COMPANY SNAPSHOT
TABLE 118.FAGE INTERNATIONAL S.A.: PRODUCT PORTFOLIO
TABLE 119.FAGE INTERNATIONAL S.A.: NET SALES, 2017–2019 ($MILLION)
TABLE 120.GENERAL MILLS. INC. (YOPLAIT): KEY EXECUTIVES
TABLE 121.GENERAL MILLS. INC. (YOPLAIT): COMPANY SNAPSHOT
TABLE 122.GENERAL MILLS. INC. (YOPLAIT): OPERATING SEGMENTS
TABLE 123.GENERAL MILLS. INC. (YOPLAIT): PRODUCT PORTFOLIO
TABLE 124.GENERAL MILLS. INC. (YOPLAIT): R&D EXPENDITURE, 2016–2018 ($MILLION)
TABLE 125.GENERAL MILLS. INC. (YOPLAIT): NET SALES, 2016–2018 ($MILLION)
TABLE 126.MULLER UK & IRELAND GROUP LLP: KEY EXECUTIVE
TABLE 127.MULLER UK & IRELAND GROUP LLP: COMPANY SNAPSHOT
TABLE 128.MULLER UK & IRELAND GROUP LLP: PRODUCT PORTFOLIO
TABLE 129.NESTLE S.A.: KEY EXECUTIVES
TABLE 130.NESTLE S.A.: COMPANY SNAPSHOT
TABLE 131.NESTLE S.A.: OPERATING SEGMENTS
TABLE 132.NESTLE S.A.: PRODUCT PORTFOLIO
TABLE 133.NESTLE S.A.: NET SALES, 2017–2019 ($MILLION)
TABLE 134.PARMALAT S.P.A.: KEY EXECUTIVES
TABLE 135.PARMALAT S.P.A.: COMPANY SNAPSHOT
TABLE 136.PARMALAT S.P.A.: PRODUCT PORTFOLIO
TABLE 137.PARMALAT S.P.A.: NET SALES, 2015–2017 ($MILLION)
TABLE 138.THE HAIN CELESTIAL GROUP (THE GREEK GODS): KEY EXECUTIVES
TABLE 139.THE HAIN CELESTIAL GROUP (THE GREEK GODS): COMPANY SNAPSHOT
TABLE 140.THE HAIN CELESTIAL GROUP (THE GREEK GODS): PRODUCT PORTFOLIO
TABLE 141.THE HAIN CELESTIAL GROUP (THE GREEK GODS): R&D EXPENDITURE, 2017–2019 ($MILLION)
TABLE 142.THE HAIN CELESTIAL GROUP (THE GREEK GODS): NET SALES, 2017–2019 ($MILLION)
TABLE 143.THE KROGER CO.: KEY EXECUTIVES
TABLE 144.THE KROGER CO.: COMPANY SNAPSHOT
TABLE 145.THE KROGER CO.: PRODUCT PORTFOLIO
TABLE 146.THE KROGER CO.: NET SALES, 2017–2019 ($MILLION)
TABLE 147.WALLABY YOGURT COMPANY: COMPANY SNAPSHOT
TABLE 148.WALLABY YOGURT COMPANY: PRODUCT PORTFOLIO
LIST OF FIGURES
FIGURE 01.KEY MARKET SEGMENTS
FIGURE 02.EXECUTIVE SUMMARY
FIGURE 03.TOP INVESTMENT POCKETS
FIGURE 04.LOW BARGAINING POWER OF SUPPLIERS
FIGURE 05.HIGH THREAT OF NEW ENTRANTS
FIGURE 06.HIGH THREAT OF SUBSTITUTES
FIGURE 07.MODERATE INTENSITY OF RIVALRY
FIGURE 08.HIGH BARGAINING POWER OF BUYERS
FIGURE 09.TOP PLAYER POSITIONING, 2019
FIGURE 10.GLOBAL GREEK YOGURT MARKET: DRIVERS, RESTRAINTS, AND OPPORTUNITIES
FIGURE 11.GLOBAL GREEK YOGURT MARKET, BY TYPE, 2019 (%)
FIGURE 12.COMPARATIVE SHARE ANALYSIS FOR WHOLE MILK GREEK YOGURT MARKET REVENUE, BY COUNTRY, 2019 & 2027 (%)
FIGURE 13.COMPARATIVE SHARE ANALYSIS FOR LOWFAT GREEK YOGURT MARKET REVENUELOWFAT, BY COUNTRY, 2019 & 2027 (%)
FIGURE 14.COMPARATIVE SHARE ANALYSIS FOR NONFAT GREEK YOGURT MARKET REVENUENONFAT, BY COUNTRY, 2019 & 2027 (%)
FIGURE 15.GLOBAL GREEK YOGURT MARKET, BY FLAVOR, 2019 (%)
FIGURE 16.COMPARATIVE SHARE ANALYSIS FOR PLAIN GREEK YOGURT MARKET REVENUE, BY COUNTRY, 2019 & 2027 (%)
FIGURE 17.COMPARATIVE SHARE ANALYSIS FOR STRAWBERRY GREEK YOGURT MARKET REVENUE, BY COUNTRY, 2019 & 2027 (%)
FIGURE 18.COMPARATIVE SHARE ANALYSIS FOR VANILLA GREEK YOGURT MARKET REVENUE, BY COUNTRY, 2019 & 2027 (%)
FIGURE 19.COMPARATIVE SHARE ANALYSIS FOR BLUEBERRY GREEK YOGURT MARKET REVENUE, BY COUNTRY, 2019 & 2027 (%)
FIGURE 20.COMPARATIVE SHARE ANALYSIS FOR GREEK YOGURT MARKET REVENUE FOR OTHERS, BY COUNTRY, 2019 & 2026 (%)
FIGURE 21.GLOBAL GREEK YOGURT MARKET, BY DISTRIBUTION CHANNEL, 2019 (%)
FIGURE 22.COMPARATIVE SHARE ANALYSIS FOR GREEK YOGURT MARKET REVENUE FOR SUPERMARKET/HYPERMARKET, BY COUNTRY, 2019 & 2027 (%)
FIGURE 23.COMPARATIVE SHARE ANALYSIS FOR GREEK YOGURT MARKET REVENUE FOR CONVENIENCE STORES, BY COUNTRY, 2019 & 2027 (%)
FIGURE 24.COMPARATIVE SHARE ANALYSIS FOR GREEK YOGURT MARKET REVENUE FOR ONLINE STORES, BY COUNTRY, 2019 & 2027 (%)
FIGURE 25.COMPARATIVE SHARE ANALYSIS FOR GREEK YOGURT MARKET REVENUE FOR OTHERS, BY COUNTRY, 2019 & 2027 (%)
FIGURE 26.GLOBAL GREEK YOGURT MARKET, BY SOURCE, 2019 (%)
FIGURE 27.COMPARATIVE SHARE ANALYSIS FOR ORGANIC GREEK YOGURT MARKET REVENUE, BY COUNTRY, 2019 & 2027 (%)
FIGURE 28.COMPARATIVE SHARE ANALYSIS FOR CONVENTIONAL GREEK YOGURT MARKET REVENUE, BY COUNTRY, 2019 & 2027 (%)
FIGURE 29.GREEK YOGURT MARKET, BY REGION, 2019 (%)
FIGURE 30.U.S GREEK YOGURT MARKET, 2019–2027 ($MILLION)
FIGURE 31.CANADA GREEK YOGURT MARKET, 2019–2027 ($MILLION)
FIGURE 32.MEXICO GREEK YOGURT MARKET, 2019–2027 ($MILLION)
FIGURE 33.GERMANY GREEK YOGURT MARKET, 2019–2027 ($MILLION)
FIGURE 34.FRANCE GREEK YOGURT MARKET, 2019–2027 ($MILLION)
FIGURE 35.UK GREEK YOGURT MARKET, 2019–2027 ($MILLION)
FIGURE 36.ITALY GREEK YOGURT MARKET, 2019–2027 ($MILLION)
FIGURE 37.SPAIN GREEK YOGURT MARKET, 2019–2027 ($MILLION)
FIGURE 38.REST OF EUROPE GREEK YOGURT MARKET, 2019–2027 ($MILLION)
FIGURE 39.CHINA GREEK YOGURT MARKET, 2019–2027 ($MILLION)
FIGURE 40.INDIA GREEK YOGURT MARKET, 2019–2027 ($MILLION)
FIGURE 41.JAPAN GREEK YOGURT MARKET, 2019–2027 ($MILLION)
FIGURE 42.AUSTRALIA GREEK YOGURT MARKET, 2019–2027 ($MILLION)
FIGURE 43.REST OF ASIA-PACIFIC GREEK YOGURT MARKET, 2019–2027 ($MILLION)
FIGURE 44.LATIN AMERICA GREEK YOGURT MARKET, 2019–2027 ($MILLION)
FIGURE 45.MIDDLE EAST GREEK YOGURT MARKET, 2019–2027 ($MILLION)
FIGURE 46.AFRICA GREEK YOGURT MARKET, 2019–2027 ($MILLION)
FIGURE 47.PRODUCT MAPPING OF TOP 10 KEY PLAYERS
FIGURE 48.COMPETITIVE DASHBOARD OF TOP 10 KEY PLAYERS
FIGURE 49.COMPETITIVE HEATMAP OF TOP 10 KEY PLAYERS
FIGURE 50.DANONE: NET SALES, 2017–2019 ($MILLION)
FIGURE 51.DANONE: REVENUE SHARE BY DIVISION, 2019 (%)
FIGURE 52.DANONE: REVENUE SHARE BY REGION, 2019 (%)
FIGURE 53.FAGE INTERNATIONAL S.A.: NET SALES, 2017–2019 ($MILLION)
FIGURE 54.FAGE INTERNATIONAL S.A.: REVENUE SHARE BY REGION, 2019 (%)
FIGURE 55.GENERAL MILLS. INC. (YOPLAIT): R&D EXPENDITURE, 2016–2018 ($MILLION)
FIGURE 56.GENERAL MILLS. INC. (YOPLAIT): NET SALES, 2016–2018 ($MILLION)
FIGURE 57.GENERAL MILLS. INC. (YOPLAIT): REVENUE SHARE BY SEGMENT, 2018 (%)
FIGURE 58.GENERAL MILLS. INC. (YOPLAIT): REVENUE SHARE BY REGION, 2019 (%)
FIGURE 59.NESTLE S.A.: NET SALES, 2017–2019 ($MILLION)
FIGURE 60.NESTLE S.A.: REVENUE SHARE BY SEGMENT, 2019 (%)
FIGURE 61.NESTLE S.A.: REVENUE SHARE BY REGION, 2019 (%)
FIGURE 62.PARMALAT S.P.A.: NET SALES, 2015–2017 ($MILLION)
FIGURE 63.PARMALAT S.P.A.: REVENUE SHARE BY SEGMENT, 2019 (%)
FIGURE 64.PARMALAT S.P.A.: REVENUE SHARE BY REGION, 2019 (%)
FIGURE 65.THE HAIN CELESTIAL GROUP (THE GREEK GODS): R&D EXPENDITURE, 2017–2019 ($MILLION)
FIGURE 66.THE HAIN CELESTIAL GROUP (THE GREEK GODS): NET SALES, 2017–2019 ($MILLION)
FIGURE 67.THE HAIN CELESTIAL GROUP (THE GREEK GODS): REVENUE SHARE BY SEGMENT, 2019 (%)
FIGURE 68.THE KROGER CO.: NET SALES, 2017–2019 ($MILLION)