Categories
Life Sciences Consumer Goods Materials and Chemicals Construction & Manufacturing Food and Beverages Energy and Power Semiconductor and Electronics Automotive and Transportation ICT & Media Aerospace & Defense BFSI

Int'l : +1-503-894-6022 | Toll Free : +1-800-792-5285 | help@alliedmarketresearch.com

Induced Pluripotent Stem Cells Market by Derived Cell Type (Hepatocytes, Fibroblasts, Keratinocytes, Amniotic Cells, Others), by Application (Academic Research, Drug Development And Discovery, Toxicity Screening, Regenerative Medicine) and by End-User (Hospitals, Research Laboratories): Global Opportunity Analysis and Industry Forecast, 2023-2032

A01200

Pages: NA

Charts: NA

Tables: NA

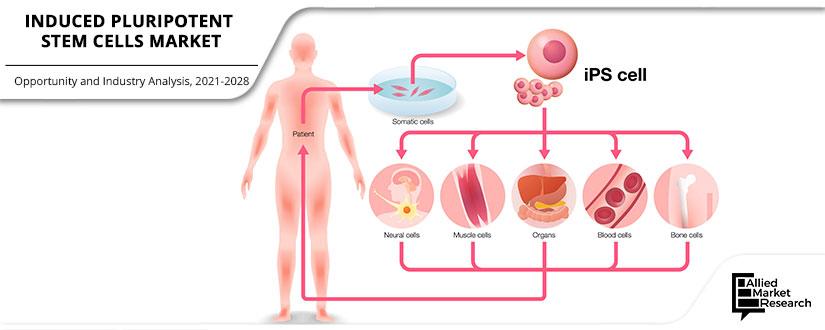
Pluripotent stem cells are embryonic stem cells that have the potential to form all adult cell types and help in repairing of damaged tissues in the human body. An induced pluripotent stem cells, or iPSCs, are taken from any tissue (usually skin or blood) from a child or an adult and is genetically modified to behave like pluripotent stem cells or embryonic stem cells.

Induced pluripotent stem cells market is in emerging state mainly due to its ability to make any cell or tissue the body might need to encounter wide range of diseases like diabetes, spinal cord injury, leukaemia or heart disease, these cells can potentially be customized to provide a perfect genetic match for any patient. Furthermore, these cells are very useful in understanding the earliest stage of human development and offer the opportunity to create customized, rejection-proof cells and tissues for transplantation. Also, government and private sectors are increasing funding and growing industry that focuses on different research work related to iPSCs and people are getting more aware about the stem cells through different organisations. However, factors such as high cost associated with the reprograming of cells, ethical issues and lengthy processes are impeding the induced pluripotent stem cells market growth. Low efficiency, potential tumor risk and incomplete programming are added factors limiting iPSCs market growth.

The global iPSCs market has been segmented based on derived cell type, application, end-user and geography. Based on derived cell type, the market is segmented into hepatocytes, fibroblasts, keratinocytes, amniotic cells and others. Based on application, the market is segmented into academic research, drug development and toxicity testing and regenerative medicine. Based on end-user, the market is segmented into hospitals and research laboratories. The market is analyzed on the basis of four regions, namely, North America, Europe, Asia-Pacific, and LAMEA.

Product launch, collaboration & merger, and acquisition are the key strategies adopted by market players. Healthcare giant such as Fujifilm Holding Corporation has acquired Cellular Dynamics International, Inc. in March 2019 creating a high growth in iPSCs market. Also, Juno Therapeutics and Fate Therapeutics collaborated to improve the products market.

Comprehensive competitive analysis and profiles of major market players such as Fujifilm Holding Corporation, Astellas Pharma Inc., Fate Therapeutics, Inc., Bristol-Myers Squibb Company, ViaCyte, Inc., Celgene Corporation, Aastrom Biosciences, Inc., Acelity Holdings, Inc., StemCells, Inc., Japan Tissue Engineering Co., Ltd. and Organogenesis Inc. is also provided in this report.

KEY MARKET BENEFITS:

  • Comprehensive analysis of factors that drive and restrict the growth of the global iPSCs market is provided in the report.
  • The projections in the report are based on the current market trends and future market potential in terms of value for the period.
  • Exhaustive analysis of the world iPSCs market by technique helps in understanding the different techniques of iPSCs that are currently used along with the variants that would gain prominence in future.
  • Competitive intelligence of leading manufacturers and distributors of iPSCs helps in understanding the competitive scenario across various geographies.
  • The key players operating in the global induced pluripotent stem cells market along their growth strategies have been provided in the report to understand the competitive outlook of the market.
  • Analysis of current research and clinical developments within iPSCs market is provided with key market dynamic factors that helps in understanding the behavior of the market

Key Market Segments

  • By Derived Cell Type
    • Hepatocytes
    • Fibroblasts
    • Keratinocytes
    • Amniotic Cells
    • Others
  • By Application
    • Academic Research
    • Drug Development And Discovery
    • Toxicity Screening
    • Regenerative Medicine
  • By End-User
    • Hospitals
    • Research Laboratories
  • By Region
    • North America
      • U.S.
      • Canada
      • Mexico
    • Europe
      • France
      • Germany
      • UK
      • Rest of Europe
    • Asia-Pacific
      • China
      • Japan
      • India
      • Rest of Asia-Pacific
    • LAMEA
      • Brazil
      • South Africa
      • UAE
      • Rest of LAMEA


Key Market Players

  • Acelity Holdings, Inc.
  • Aastrom Biosciences, Inc.
  • Bristol-Myers Squibb Company
  • StemCells, Inc.
  • Fate Therapeutics, Inc.
  • Japan Tissue Engineering Co., Ltd.
  • Astellas Pharma Inc.
  • Celgene Corporation
  • Organogenesis Inc.
  • ViaCyte, Inc.
  • Fujifilm Holding Corporation
  • CHAPTER 1: INTRODUCTION

    • 1.1. Report Description

    • 1.2. Key Market Segments

    • 1.3. Key Benefits

    • 1.4. Research Methodology

      • 1.4.1. Primary Research

      • 1.4.2. Secondary Research

      • 1.4.3. Analyst Tools and Models

  • CHAPTER 2: EXECUTIVE SUMMARY

    • 2.1. CXO Perspective

  • CHAPTER 3: MARKET LANDSCAPE

    • 3.1. Market Definition and Scope

    • 3.2. Key Findings

      • 3.2.1. Top Investment Pockets

      • 3.2.2. Top Winning Strategies

    • 3.3. Porter's Five Forces Analysis

      • 3.3.1. Bargaining Power of Suppliers

      • 3.3.2. Threat of New Entrants

      • 3.3.3. Threat of Substitutes

      • 3.3.4. Competitive Rivalry

      • 3.3.5. Bargaining Power among Buyers

    • 3.5. Market Dynamics

      • 3.5.1. Drivers

      • 3.5.2. Restraints

      • 3.5.3. Opportunities

  • CHAPTER 4: INDUCED PLURIPOTENT STEM CELLS MARKET, BY DERIVED CELL TYPE

    • 4.1. Market Overview

      • 4.1.1 Market Size and Forecast, By Derived Cell Type

    • 4.2. Hepatocytes

      • 4.2.1. Key Market Trends, Growth Factors and Opportunities

      • 4.2.2. Market Size and Forecast, By Region

      • 4.2.3. Market Share Analysis, By Country

    • 4.3. Fibroblasts

      • 4.3.1. Key Market Trends, Growth Factors and Opportunities

      • 4.3.2. Market Size and Forecast, By Region

      • 4.3.3. Market Share Analysis, By Country

    • 4.4. Keratinocytes

      • 4.4.1. Key Market Trends, Growth Factors and Opportunities

      • 4.4.2. Market Size and Forecast, By Region

      • 4.4.3. Market Share Analysis, By Country

    • 4.5. Amniotic Cells

      • 4.5.1. Key Market Trends, Growth Factors and Opportunities

      • 4.5.2. Market Size and Forecast, By Region

      • 4.5.3. Market Share Analysis, By Country

    • 4.6. Others

      • 4.6.1. Key Market Trends, Growth Factors and Opportunities

      • 4.6.2. Market Size and Forecast, By Region

      • 4.6.3. Market Share Analysis, By Country

  • CHAPTER 5: INDUCED PLURIPOTENT STEM CELLS MARKET, BY APPLICATION

    • 5.1. Market Overview

      • 5.1.1 Market Size and Forecast, By Application

    • 5.2. Academic Research

      • 5.2.1. Key Market Trends, Growth Factors and Opportunities

      • 5.2.2. Market Size and Forecast, By Region

      • 5.2.3. Market Share Analysis, By Country

    • 5.3. Drug Development And Discovery

      • 5.3.1. Key Market Trends, Growth Factors and Opportunities

      • 5.3.2. Market Size and Forecast, By Region

      • 5.3.3. Market Share Analysis, By Country

    • 5.4. Toxicity Screening

      • 5.4.1. Key Market Trends, Growth Factors and Opportunities

      • 5.4.2. Market Size and Forecast, By Region

      • 5.4.3. Market Share Analysis, By Country

    • 5.5. Regenerative Medicine

      • 5.5.1. Key Market Trends, Growth Factors and Opportunities

      • 5.5.2. Market Size and Forecast, By Region

      • 5.5.3. Market Share Analysis, By Country

  • CHAPTER 6: INDUCED PLURIPOTENT STEM CELLS MARKET, BY END-USER

    • 6.1. Market Overview

      • 6.1.1 Market Size and Forecast, By End-user

    • 6.2. Hospitals

      • 6.2.1. Key Market Trends, Growth Factors and Opportunities

      • 6.2.2. Market Size and Forecast, By Region

      • 6.2.3. Market Share Analysis, By Country

    • 6.3. Research Laboratories

      • 6.3.1. Key Market Trends, Growth Factors and Opportunities

      • 6.3.2. Market Size and Forecast, By Region

      • 6.3.3. Market Share Analysis, By Country

  • CHAPTER 7: INDUCED PLURIPOTENT STEM CELLS MARKET, BY REGION

    • 7.1. Market Overview

      • 7.1.1 Market Size and Forecast, By Region

    • 7.2. North America

      • 7.2.1. Key Market Trends and Opportunities

      • 7.2.2. Market Size and Forecast, By Derived Cell Type

      • 7.2.3. Market Size and Forecast, By Application

      • 7.2.4. Market Size and Forecast, By End-user

      • 7.2.5. Market Size and Forecast, By Country

      • 7.2.6. U.S. Induced Pluripotent Stem Cells Market

        • 7.2.6.1. Market Size and Forecast, By Derived Cell Type
        • 7.2.6.2. Market Size and Forecast, By Application
        • 7.2.6.3. Market Size and Forecast, By End-user
      • 7.2.7. Canada Induced Pluripotent Stem Cells Market

        • 7.2.7.1. Market Size and Forecast, By Derived Cell Type
        • 7.2.7.2. Market Size and Forecast, By Application
        • 7.2.7.3. Market Size and Forecast, By End-user
      • 7.2.8. Mexico Induced Pluripotent Stem Cells Market

        • 7.2.8.1. Market Size and Forecast, By Derived Cell Type
        • 7.2.8.2. Market Size and Forecast, By Application
        • 7.2.8.3. Market Size and Forecast, By End-user
    • 7.3. Europe

      • 7.3.1. Key Market Trends and Opportunities

      • 7.3.2. Market Size and Forecast, By Derived Cell Type

      • 7.3.3. Market Size and Forecast, By Application

      • 7.3.4. Market Size and Forecast, By End-user

      • 7.3.5. Market Size and Forecast, By Country

      • 7.3.6. France Induced Pluripotent Stem Cells Market

        • 7.3.6.1. Market Size and Forecast, By Derived Cell Type
        • 7.3.6.2. Market Size and Forecast, By Application
        • 7.3.6.3. Market Size and Forecast, By End-user
      • 7.3.7. Germany Induced Pluripotent Stem Cells Market

        • 7.3.7.1. Market Size and Forecast, By Derived Cell Type
        • 7.3.7.2. Market Size and Forecast, By Application
        • 7.3.7.3. Market Size and Forecast, By End-user
      • 7.3.8. Italy Induced Pluripotent Stem Cells Market

        • 7.3.8.1. Market Size and Forecast, By Derived Cell Type
        • 7.3.8.2. Market Size and Forecast, By Application
        • 7.3.8.3. Market Size and Forecast, By End-user
      • 7.3.9. Spain Induced Pluripotent Stem Cells Market

        • 7.3.9.1. Market Size and Forecast, By Derived Cell Type
        • 7.3.9.2. Market Size and Forecast, By Application
        • 7.3.9.3. Market Size and Forecast, By End-user
      • 7.3.10. UK Induced Pluripotent Stem Cells Market

        • 7.3.10.1. Market Size and Forecast, By Derived Cell Type
        • 7.3.10.2. Market Size and Forecast, By Application
        • 7.3.10.3. Market Size and Forecast, By End-user
      • 7.3.11. Russia Induced Pluripotent Stem Cells Market

        • 7.3.11.1. Market Size and Forecast, By Derived Cell Type
        • 7.3.11.2. Market Size and Forecast, By Application
        • 7.3.11.3. Market Size and Forecast, By End-user
      • 7.3.12. Rest Of Europe Induced Pluripotent Stem Cells Market

        • 7.3.12.1. Market Size and Forecast, By Derived Cell Type
        • 7.3.12.2. Market Size and Forecast, By Application
        • 7.3.12.3. Market Size and Forecast, By End-user
    • 7.4. Asia-Pacific

      • 7.4.1. Key Market Trends and Opportunities

      • 7.4.2. Market Size and Forecast, By Derived Cell Type

      • 7.4.3. Market Size and Forecast, By Application

      • 7.4.4. Market Size and Forecast, By End-user

      • 7.4.5. Market Size and Forecast, By Country

      • 7.4.6. China Induced Pluripotent Stem Cells Market

        • 7.4.6.1. Market Size and Forecast, By Derived Cell Type
        • 7.4.6.2. Market Size and Forecast, By Application
        • 7.4.6.3. Market Size and Forecast, By End-user
      • 7.4.7. Japan Induced Pluripotent Stem Cells Market

        • 7.4.7.1. Market Size and Forecast, By Derived Cell Type
        • 7.4.7.2. Market Size and Forecast, By Application
        • 7.4.7.3. Market Size and Forecast, By End-user
      • 7.4.8. India Induced Pluripotent Stem Cells Market

        • 7.4.8.1. Market Size and Forecast, By Derived Cell Type
        • 7.4.8.2. Market Size and Forecast, By Application
        • 7.4.8.3. Market Size and Forecast, By End-user
      • 7.4.9. South Korea Induced Pluripotent Stem Cells Market

        • 7.4.9.1. Market Size and Forecast, By Derived Cell Type
        • 7.4.9.2. Market Size and Forecast, By Application
        • 7.4.9.3. Market Size and Forecast, By End-user
      • 7.4.10. Australia Induced Pluripotent Stem Cells Market

        • 7.4.10.1. Market Size and Forecast, By Derived Cell Type
        • 7.4.10.2. Market Size and Forecast, By Application
        • 7.4.10.3. Market Size and Forecast, By End-user
      • 7.4.11. Thailand Induced Pluripotent Stem Cells Market

        • 7.4.11.1. Market Size and Forecast, By Derived Cell Type
        • 7.4.11.2. Market Size and Forecast, By Application
        • 7.4.11.3. Market Size and Forecast, By End-user
      • 7.4.12. Malaysia Induced Pluripotent Stem Cells Market

        • 7.4.12.1. Market Size and Forecast, By Derived Cell Type
        • 7.4.12.2. Market Size and Forecast, By Application
        • 7.4.12.3. Market Size and Forecast, By End-user
      • 7.4.13. Indonesia Induced Pluripotent Stem Cells Market

        • 7.4.13.1. Market Size and Forecast, By Derived Cell Type
        • 7.4.13.2. Market Size and Forecast, By Application
        • 7.4.13.3. Market Size and Forecast, By End-user
      • 7.4.14. Rest of Asia Pacific Induced Pluripotent Stem Cells Market

        • 7.4.14.1. Market Size and Forecast, By Derived Cell Type
        • 7.4.14.2. Market Size and Forecast, By Application
        • 7.4.14.3. Market Size and Forecast, By End-user
    • 7.5. LAMEA

      • 7.5.1. Key Market Trends and Opportunities

      • 7.5.2. Market Size and Forecast, By Derived Cell Type

      • 7.5.3. Market Size and Forecast, By Application

      • 7.5.4. Market Size and Forecast, By End-user

      • 7.5.5. Market Size and Forecast, By Country

      • 7.5.6. Brazil Induced Pluripotent Stem Cells Market

        • 7.5.6.1. Market Size and Forecast, By Derived Cell Type
        • 7.5.6.2. Market Size and Forecast, By Application
        • 7.5.6.3. Market Size and Forecast, By End-user
      • 7.5.7. South Africa Induced Pluripotent Stem Cells Market

        • 7.5.7.1. Market Size and Forecast, By Derived Cell Type
        • 7.5.7.2. Market Size and Forecast, By Application
        • 7.5.7.3. Market Size and Forecast, By End-user
      • 7.5.8. Saudi Arabia Induced Pluripotent Stem Cells Market

        • 7.5.8.1. Market Size and Forecast, By Derived Cell Type
        • 7.5.8.2. Market Size and Forecast, By Application
        • 7.5.8.3. Market Size and Forecast, By End-user
      • 7.5.9. UAE Induced Pluripotent Stem Cells Market

        • 7.5.9.1. Market Size and Forecast, By Derived Cell Type
        • 7.5.9.2. Market Size and Forecast, By Application
        • 7.5.9.3. Market Size and Forecast, By End-user
      • 7.5.10. Argentina Induced Pluripotent Stem Cells Market

        • 7.5.10.1. Market Size and Forecast, By Derived Cell Type
        • 7.5.10.2. Market Size and Forecast, By Application
        • 7.5.10.3. Market Size and Forecast, By End-user
      • 7.5.11. Rest of LAMEA Induced Pluripotent Stem Cells Market

        • 7.5.11.1. Market Size and Forecast, By Derived Cell Type
        • 7.5.11.2. Market Size and Forecast, By Application
        • 7.5.11.3. Market Size and Forecast, By End-user
  • CHAPTER 8: COMPETITIVE LANDSCAPE

    • 8.1. Introduction

    • 8.2. Top Winning Strategies

    • 8.3. Product Mapping Of Top 10 Player

    • 8.4. Competitive Dashboard

    • 8.5. Competitive Heatmap

    • 8.6. Top Player Positioning, 2024

  • CHAPTER 9: COMPANY PROFILES

    • 9.1. Fujifilm Holding Corporation

      • 9.1.1. Company Overview

      • 9.1.2. Key Executives

      • 9.1.3. Company Snapshot

      • 9.1.4. Operating Business Segments

      • 9.1.5. Product Portfolio

      • 9.1.6. Business Performance

      • 9.1.7. Key Strategic Moves and Developments

    • 9.2. Astellas Pharma Inc.

      • 9.2.1. Company Overview

      • 9.2.2. Key Executives

      • 9.2.3. Company Snapshot

      • 9.2.4. Operating Business Segments

      • 9.2.5. Product Portfolio

      • 9.2.6. Business Performance

      • 9.2.7. Key Strategic Moves and Developments

    • 9.3. Fate Therapeutics, Inc.

      • 9.3.1. Company Overview

      • 9.3.2. Key Executives

      • 9.3.3. Company Snapshot

      • 9.3.4. Operating Business Segments

      • 9.3.5. Product Portfolio

      • 9.3.6. Business Performance

      • 9.3.7. Key Strategic Moves and Developments

    • 9.4. Bristol-Myers Squibb Company

      • 9.4.1. Company Overview

      • 9.4.2. Key Executives

      • 9.4.3. Company Snapshot

      • 9.4.4. Operating Business Segments

      • 9.4.5. Product Portfolio

      • 9.4.6. Business Performance

      • 9.4.7. Key Strategic Moves and Developments

    • 9.5. ViaCyte, Inc.

      • 9.5.1. Company Overview

      • 9.5.2. Key Executives

      • 9.5.3. Company Snapshot

      • 9.5.4. Operating Business Segments

      • 9.5.5. Product Portfolio

      • 9.5.6. Business Performance

      • 9.5.7. Key Strategic Moves and Developments

    • 9.6. Celgene Corporation

      • 9.6.1. Company Overview

      • 9.6.2. Key Executives

      • 9.6.3. Company Snapshot

      • 9.6.4. Operating Business Segments

      • 9.6.5. Product Portfolio

      • 9.6.6. Business Performance

      • 9.6.7. Key Strategic Moves and Developments

    • 9.7. Aastrom Biosciences, Inc.

      • 9.7.1. Company Overview

      • 9.7.2. Key Executives

      • 9.7.3. Company Snapshot

      • 9.7.4. Operating Business Segments

      • 9.7.5. Product Portfolio

      • 9.7.6. Business Performance

      • 9.7.7. Key Strategic Moves and Developments

    • 9.8. Acelity Holdings, Inc.

      • 9.8.1. Company Overview

      • 9.8.2. Key Executives

      • 9.8.3. Company Snapshot

      • 9.8.4. Operating Business Segments

      • 9.8.5. Product Portfolio

      • 9.8.6. Business Performance

      • 9.8.7. Key Strategic Moves and Developments

    • 9.9. StemCells, Inc.

      • 9.9.1. Company Overview

      • 9.9.2. Key Executives

      • 9.9.3. Company Snapshot

      • 9.9.4. Operating Business Segments

      • 9.9.5. Product Portfolio

      • 9.9.6. Business Performance

      • 9.9.7. Key Strategic Moves and Developments

    • 9.10. Japan Tissue Engineering Co., Ltd.

      • 9.10.1. Company Overview

      • 9.10.2. Key Executives

      • 9.10.3. Company Snapshot

      • 9.10.4. Operating Business Segments

      • 9.10.5. Product Portfolio

      • 9.10.6. Business Performance

      • 9.10.7. Key Strategic Moves and Developments

    • 9.11. Organogenesis Inc.

      • 9.11.1. Company Overview

      • 9.11.2. Key Executives

      • 9.11.3. Company Snapshot

      • 9.11.4. Operating Business Segments

      • 9.11.5. Product Portfolio

      • 9.11.6. Business Performance

      • 9.11.7. Key Strategic Moves and Developments

  • LIST OF TABLES

  • TABLE 1. GLOBAL INDUCED PLURIPOTENT STEM CELLS MARKET, BY DERIVED CELL TYPE, 2025-2033 ($MILLION)
  • TABLE 2. GLOBAL INDUCED PLURIPOTENT STEM CELLS MARKET FOR HEPATOCYTES, BY REGION, 2025-2033 ($MILLION)
  • TABLE 3. GLOBAL INDUCED PLURIPOTENT STEM CELLS MARKET FOR FIBROBLASTS, BY REGION, 2025-2033 ($MILLION)
  • TABLE 4. GLOBAL INDUCED PLURIPOTENT STEM CELLS MARKET FOR KERATINOCYTES, BY REGION, 2025-2033 ($MILLION)
  • TABLE 5. GLOBAL INDUCED PLURIPOTENT STEM CELLS MARKET FOR AMNIOTIC CELLS, BY REGION, 2025-2033 ($MILLION)
  • TABLE 6. GLOBAL INDUCED PLURIPOTENT STEM CELLS MARKET FOR OTHERS, BY REGION, 2025-2033 ($MILLION)
  • TABLE 7. GLOBAL INDUCED PLURIPOTENT STEM CELLS MARKET, BY APPLICATION, 2025-2033 ($MILLION)
  • TABLE 8. GLOBAL INDUCED PLURIPOTENT STEM CELLS MARKET FOR ACADEMIC RESEARCH, BY REGION, 2025-2033 ($MILLION)
  • TABLE 9. GLOBAL INDUCED PLURIPOTENT STEM CELLS MARKET FOR DRUG DEVELOPMENT AND DISCOVERY, BY REGION, 2025-2033 ($MILLION)
  • TABLE 10. GLOBAL INDUCED PLURIPOTENT STEM CELLS MARKET FOR TOXICITY SCREENING, BY REGION, 2025-2033 ($MILLION)
  • TABLE 11. GLOBAL INDUCED PLURIPOTENT STEM CELLS MARKET FOR REGENERATIVE MEDICINE, BY REGION, 2025-2033 ($MILLION)
  • TABLE 12. GLOBAL INDUCED PLURIPOTENT STEM CELLS MARKET, BY END-USER, 2025-2033 ($MILLION)
  • TABLE 13. GLOBAL INDUCED PLURIPOTENT STEM CELLS MARKET FOR HOSPITALS, BY REGION, 2025-2033 ($MILLION)
  • TABLE 14. GLOBAL INDUCED PLURIPOTENT STEM CELLS MARKET FOR RESEARCH LABORATORIES, BY REGION, 2025-2033 ($MILLION)
  • TABLE 15. GLOBAL INDUCED PLURIPOTENT STEM CELLS MARKET, BY REGION, 2025-2033 ($MILLION)
  • TABLE 16. NORTH AMERICA INDUCED PLURIPOTENT STEM CELLS, BY REGION, 2025-2033 ($MILLION)
  • TABLE 17. NORTH AMERICA INDUCED PLURIPOTENT STEM CELLS, BY DERIVED CELL TYPE, 2025-2033 ($MILLION)
  • TABLE 18. NORTH AMERICA INDUCED PLURIPOTENT STEM CELLS, BY APPLICATION, 2025-2033 ($MILLION)
  • TABLE 19. NORTH AMERICA INDUCED PLURIPOTENT STEM CELLS, BY END-USER, 2025-2033 ($MILLION)
  • TABLE 20. U.S. INDUCED PLURIPOTENT STEM CELLS, BY DERIVED CELL TYPE, 2025-2033 ($MILLION)
  • TABLE 21. U.S. INDUCED PLURIPOTENT STEM CELLS, BY APPLICATION, 2025-2033 ($MILLION)
  • TABLE 22. U.S. INDUCED PLURIPOTENT STEM CELLS, BY END-USER, 2025-2033 ($MILLION)
  • TABLE 23. CANADA INDUCED PLURIPOTENT STEM CELLS, BY DERIVED CELL TYPE, 2025-2033 ($MILLION)
  • TABLE 24. CANADA INDUCED PLURIPOTENT STEM CELLS, BY APPLICATION, 2025-2033 ($MILLION)
  • TABLE 25. CANADA INDUCED PLURIPOTENT STEM CELLS, BY END-USER, 2025-2033 ($MILLION)
  • TABLE 26. MEXICO INDUCED PLURIPOTENT STEM CELLS, BY DERIVED CELL TYPE, 2025-2033 ($MILLION)
  • TABLE 27. MEXICO INDUCED PLURIPOTENT STEM CELLS, BY APPLICATION, 2025-2033 ($MILLION)
  • TABLE 28. MEXICO INDUCED PLURIPOTENT STEM CELLS, BY END-USER, 2025-2033 ($MILLION)
  • TABLE 29. EUROPE INDUCED PLURIPOTENT STEM CELLS, BY REGION, 2025-2033 ($MILLION)
  • TABLE 30. EUROPE INDUCED PLURIPOTENT STEM CELLS, BY DERIVED CELL TYPE, 2025-2033 ($MILLION)
  • TABLE 31. EUROPE INDUCED PLURIPOTENT STEM CELLS, BY APPLICATION, 2025-2033 ($MILLION)
  • TABLE 32. EUROPE INDUCED PLURIPOTENT STEM CELLS, BY END-USER, 2025-2033 ($MILLION)
  • TABLE 33. FRANCE INDUCED PLURIPOTENT STEM CELLS, BY DERIVED CELL TYPE, 2025-2033 ($MILLION)
  • TABLE 34. FRANCE INDUCED PLURIPOTENT STEM CELLS, BY APPLICATION, 2025-2033 ($MILLION)
  • TABLE 35. FRANCE INDUCED PLURIPOTENT STEM CELLS, BY END-USER, 2025-2033 ($MILLION)
  • TABLE 36. GERMANY INDUCED PLURIPOTENT STEM CELLS, BY DERIVED CELL TYPE, 2025-2033 ($MILLION)
  • TABLE 37. GERMANY INDUCED PLURIPOTENT STEM CELLS, BY APPLICATION, 2025-2033 ($MILLION)
  • TABLE 38. GERMANY INDUCED PLURIPOTENT STEM CELLS, BY END-USER, 2025-2033 ($MILLION)
  • TABLE 39. ITALY INDUCED PLURIPOTENT STEM CELLS, BY DERIVED CELL TYPE, 2025-2033 ($MILLION)
  • TABLE 40. ITALY INDUCED PLURIPOTENT STEM CELLS, BY APPLICATION, 2025-2033 ($MILLION)
  • TABLE 41. ITALY INDUCED PLURIPOTENT STEM CELLS, BY END-USER, 2025-2033 ($MILLION)
  • TABLE 42. SPAIN INDUCED PLURIPOTENT STEM CELLS, BY DERIVED CELL TYPE, 2025-2033 ($MILLION)
  • TABLE 43. SPAIN INDUCED PLURIPOTENT STEM CELLS, BY APPLICATION, 2025-2033 ($MILLION)
  • TABLE 44. SPAIN INDUCED PLURIPOTENT STEM CELLS, BY END-USER, 2025-2033 ($MILLION)
  • TABLE 45. UK INDUCED PLURIPOTENT STEM CELLS, BY DERIVED CELL TYPE, 2025-2033 ($MILLION)
  • TABLE 46. UK INDUCED PLURIPOTENT STEM CELLS, BY APPLICATION, 2025-2033 ($MILLION)
  • TABLE 47. UK INDUCED PLURIPOTENT STEM CELLS, BY END-USER, 2025-2033 ($MILLION)
  • TABLE 48. RUSSIA INDUCED PLURIPOTENT STEM CELLS, BY DERIVED CELL TYPE, 2025-2033 ($MILLION)
  • TABLE 49. RUSSIA INDUCED PLURIPOTENT STEM CELLS, BY APPLICATION, 2025-2033 ($MILLION)
  • TABLE 50. RUSSIA INDUCED PLURIPOTENT STEM CELLS, BY END-USER, 2025-2033 ($MILLION)
  • TABLE 51. REST OF EUROPE INDUCED PLURIPOTENT STEM CELLS, BY DERIVED CELL TYPE, 2025-2033 ($MILLION)
  • TABLE 52. REST OF EUROPE INDUCED PLURIPOTENT STEM CELLS, BY APPLICATION, 2025-2033 ($MILLION)
  • TABLE 53. REST OF EUROPE INDUCED PLURIPOTENT STEM CELLS, BY END-USER, 2025-2033 ($MILLION)
  • TABLE 54. ASIA-PACIFIC INDUCED PLURIPOTENT STEM CELLS, BY REGION, 2025-2033 ($MILLION)
  • TABLE 55. ASIA-PACIFIC INDUCED PLURIPOTENT STEM CELLS, BY DERIVED CELL TYPE, 2025-2033 ($MILLION)
  • TABLE 56. ASIA-PACIFIC INDUCED PLURIPOTENT STEM CELLS, BY APPLICATION, 2025-2033 ($MILLION)
  • TABLE 57. ASIA-PACIFIC INDUCED PLURIPOTENT STEM CELLS, BY END-USER, 2025-2033 ($MILLION)
  • TABLE 58. CHINA INDUCED PLURIPOTENT STEM CELLS, BY DERIVED CELL TYPE, 2025-2033 ($MILLION)
  • TABLE 59. CHINA INDUCED PLURIPOTENT STEM CELLS, BY APPLICATION, 2025-2033 ($MILLION)
  • TABLE 60. CHINA INDUCED PLURIPOTENT STEM CELLS, BY END-USER, 2025-2033 ($MILLION)
  • TABLE 61. JAPAN INDUCED PLURIPOTENT STEM CELLS, BY DERIVED CELL TYPE, 2025-2033 ($MILLION)
  • TABLE 62. JAPAN INDUCED PLURIPOTENT STEM CELLS, BY APPLICATION, 2025-2033 ($MILLION)
  • TABLE 63. JAPAN INDUCED PLURIPOTENT STEM CELLS, BY END-USER, 2025-2033 ($MILLION)
  • TABLE 64. INDIA INDUCED PLURIPOTENT STEM CELLS, BY DERIVED CELL TYPE, 2025-2033 ($MILLION)
  • TABLE 65. INDIA INDUCED PLURIPOTENT STEM CELLS, BY APPLICATION, 2025-2033 ($MILLION)
  • TABLE 66. INDIA INDUCED PLURIPOTENT STEM CELLS, BY END-USER, 2025-2033 ($MILLION)
  • TABLE 67. SOUTH KOREA INDUCED PLURIPOTENT STEM CELLS, BY DERIVED CELL TYPE, 2025-2033 ($MILLION)
  • TABLE 68. SOUTH KOREA INDUCED PLURIPOTENT STEM CELLS, BY APPLICATION, 2025-2033 ($MILLION)
  • TABLE 69. SOUTH KOREA INDUCED PLURIPOTENT STEM CELLS, BY END-USER, 2025-2033 ($MILLION)
  • TABLE 70. AUSTRALIA INDUCED PLURIPOTENT STEM CELLS, BY DERIVED CELL TYPE, 2025-2033 ($MILLION)
  • TABLE 71. AUSTRALIA INDUCED PLURIPOTENT STEM CELLS, BY APPLICATION, 2025-2033 ($MILLION)
  • TABLE 72. AUSTRALIA INDUCED PLURIPOTENT STEM CELLS, BY END-USER, 2025-2033 ($MILLION)
  • TABLE 73. THAILAND INDUCED PLURIPOTENT STEM CELLS, BY DERIVED CELL TYPE, 2025-2033 ($MILLION)
  • TABLE 74. THAILAND INDUCED PLURIPOTENT STEM CELLS, BY APPLICATION, 2025-2033 ($MILLION)
  • TABLE 75. THAILAND INDUCED PLURIPOTENT STEM CELLS, BY END-USER, 2025-2033 ($MILLION)
  • TABLE 76. MALAYSIA INDUCED PLURIPOTENT STEM CELLS, BY DERIVED CELL TYPE, 2025-2033 ($MILLION)
  • TABLE 77. MALAYSIA INDUCED PLURIPOTENT STEM CELLS, BY APPLICATION, 2025-2033 ($MILLION)
  • TABLE 78. MALAYSIA INDUCED PLURIPOTENT STEM CELLS, BY END-USER, 2025-2033 ($MILLION)
  • TABLE 79. INDONESIA INDUCED PLURIPOTENT STEM CELLS, BY DERIVED CELL TYPE, 2025-2033 ($MILLION)
  • TABLE 80. INDONESIA INDUCED PLURIPOTENT STEM CELLS, BY APPLICATION, 2025-2033 ($MILLION)
  • TABLE 81. INDONESIA INDUCED PLURIPOTENT STEM CELLS, BY END-USER, 2025-2033 ($MILLION)
  • TABLE 82. REST OF ASIA PACIFIC INDUCED PLURIPOTENT STEM CELLS, BY DERIVED CELL TYPE, 2025-2033 ($MILLION)
  • TABLE 83. REST OF ASIA PACIFIC INDUCED PLURIPOTENT STEM CELLS, BY APPLICATION, 2025-2033 ($MILLION)
  • TABLE 84. REST OF ASIA PACIFIC INDUCED PLURIPOTENT STEM CELLS, BY END-USER, 2025-2033 ($MILLION)
  • TABLE 85. LAMEA INDUCED PLURIPOTENT STEM CELLS, BY REGION, 2025-2033 ($MILLION)
  • TABLE 86. LAMEA INDUCED PLURIPOTENT STEM CELLS, BY DERIVED CELL TYPE, 2025-2033 ($MILLION)
  • TABLE 87. LAMEA INDUCED PLURIPOTENT STEM CELLS, BY APPLICATION, 2025-2033 ($MILLION)
  • TABLE 88. LAMEA INDUCED PLURIPOTENT STEM CELLS, BY END-USER, 2025-2033 ($MILLION)
  • TABLE 89. BRAZIL INDUCED PLURIPOTENT STEM CELLS, BY DERIVED CELL TYPE, 2025-2033 ($MILLION)
  • TABLE 90. BRAZIL INDUCED PLURIPOTENT STEM CELLS, BY APPLICATION, 2025-2033 ($MILLION)
  • TABLE 91. BRAZIL INDUCED PLURIPOTENT STEM CELLS, BY END-USER, 2025-2033 ($MILLION)
  • TABLE 92. SOUTH AFRICA INDUCED PLURIPOTENT STEM CELLS, BY DERIVED CELL TYPE, 2025-2033 ($MILLION)
  • TABLE 93. SOUTH AFRICA INDUCED PLURIPOTENT STEM CELLS, BY APPLICATION, 2025-2033 ($MILLION)
  • TABLE 94. SOUTH AFRICA INDUCED PLURIPOTENT STEM CELLS, BY END-USER, 2025-2033 ($MILLION)
  • TABLE 95. SAUDI ARABIA INDUCED PLURIPOTENT STEM CELLS, BY DERIVED CELL TYPE, 2025-2033 ($MILLION)
  • TABLE 96. SAUDI ARABIA INDUCED PLURIPOTENT STEM CELLS, BY APPLICATION, 2025-2033 ($MILLION)
  • TABLE 97. SAUDI ARABIA INDUCED PLURIPOTENT STEM CELLS, BY END-USER, 2025-2033 ($MILLION)
  • TABLE 98. UAE INDUCED PLURIPOTENT STEM CELLS, BY DERIVED CELL TYPE, 2025-2033 ($MILLION)
  • TABLE 99. UAE INDUCED PLURIPOTENT STEM CELLS, BY APPLICATION, 2025-2033 ($MILLION)
  • TABLE 100. UAE INDUCED PLURIPOTENT STEM CELLS, BY END-USER, 2025-2033 ($MILLION)
  • TABLE 101. ARGENTINA INDUCED PLURIPOTENT STEM CELLS, BY DERIVED CELL TYPE, 2025-2033 ($MILLION)
  • TABLE 102. ARGENTINA INDUCED PLURIPOTENT STEM CELLS, BY APPLICATION, 2025-2033 ($MILLION)
  • TABLE 103. ARGENTINA INDUCED PLURIPOTENT STEM CELLS, BY END-USER, 2025-2033 ($MILLION)
  • TABLE 104. REST OF LAMEA INDUCED PLURIPOTENT STEM CELLS, BY DERIVED CELL TYPE, 2025-2033 ($MILLION)
  • TABLE 105. REST OF LAMEA INDUCED PLURIPOTENT STEM CELLS, BY APPLICATION, 2025-2033 ($MILLION)
  • TABLE 106. REST OF LAMEA INDUCED PLURIPOTENT STEM CELLS, BY END-USER, 2025-2033 ($MILLION)
  • TABLE 107. FUJIFILM HOLDING CORPORATION: KEY EXECUTIVES
  • TABLE 108. FUJIFILM HOLDING CORPORATION: COMPANY SNAPSHOT
  • TABLE 109. FUJIFILM HOLDING CORPORATION: OPERATING SEGMENTS
  • TABLE 110. FUJIFILM HOLDING CORPORATION: PRODUCT PORTFOLIO
  • TABLE 111. FUJIFILM HOLDING CORPORATION: KEY STRATEGIC MOVES AND DEVELOPMENTS
  • TABLE 112. ASTELLAS PHARMA INC.: KEY EXECUTIVES
  • TABLE 113. ASTELLAS PHARMA INC.: COMPANY SNAPSHOT
  • TABLE 114. ASTELLAS PHARMA INC.: OPERATING SEGMENTS
  • TABLE 115. ASTELLAS PHARMA INC.: PRODUCT PORTFOLIO
  • TABLE 116. ASTELLAS PHARMA INC.: KEY STRATEGIC MOVES AND DEVELOPMENTS
  • TABLE 117. FATE THERAPEUTICS, INC.: KEY EXECUTIVES
  • TABLE 118. FATE THERAPEUTICS, INC.: COMPANY SNAPSHOT
  • TABLE 119. FATE THERAPEUTICS, INC.: OPERATING SEGMENTS
  • TABLE 120. FATE THERAPEUTICS, INC.: PRODUCT PORTFOLIO
  • TABLE 121. FATE THERAPEUTICS, INC.: KEY STRATEGIC MOVES AND DEVELOPMENTS
  • TABLE 122. BRISTOL-MYERS SQUIBB COMPANY: KEY EXECUTIVES
  • TABLE 123. BRISTOL-MYERS SQUIBB COMPANY: COMPANY SNAPSHOT
  • TABLE 124. BRISTOL-MYERS SQUIBB COMPANY: OPERATING SEGMENTS
  • TABLE 125. BRISTOL-MYERS SQUIBB COMPANY: PRODUCT PORTFOLIO
  • TABLE 126. BRISTOL-MYERS SQUIBB COMPANY: KEY STRATEGIC MOVES AND DEVELOPMENTS
  • TABLE 127. VIACYTE, INC.: KEY EXECUTIVES
  • TABLE 128. VIACYTE, INC.: COMPANY SNAPSHOT
  • TABLE 129. VIACYTE, INC.: OPERATING SEGMENTS
  • TABLE 130. VIACYTE, INC.: PRODUCT PORTFOLIO
  • TABLE 131. VIACYTE, INC.: KEY STRATEGIC MOVES AND DEVELOPMENTS
  • TABLE 132. CELGENE CORPORATION: KEY EXECUTIVES
  • TABLE 133. CELGENE CORPORATION: COMPANY SNAPSHOT
  • TABLE 134. CELGENE CORPORATION: OPERATING SEGMENTS
  • TABLE 135. CELGENE CORPORATION: PRODUCT PORTFOLIO
  • TABLE 136. CELGENE CORPORATION: KEY STRATEGIC MOVES AND DEVELOPMENTS
  • TABLE 137. AASTROM BIOSCIENCES, INC.: KEY EXECUTIVES
  • TABLE 138. AASTROM BIOSCIENCES, INC.: COMPANY SNAPSHOT
  • TABLE 139. AASTROM BIOSCIENCES, INC.: OPERATING SEGMENTS
  • TABLE 140. AASTROM BIOSCIENCES, INC.: PRODUCT PORTFOLIO
  • TABLE 141. AASTROM BIOSCIENCES, INC.: KEY STRATEGIC MOVES AND DEVELOPMENTS
  • TABLE 142. ACELITY HOLDINGS, INC.: KEY EXECUTIVES
  • TABLE 143. ACELITY HOLDINGS, INC.: COMPANY SNAPSHOT
  • TABLE 144. ACELITY HOLDINGS, INC.: OPERATING SEGMENTS
  • TABLE 145. ACELITY HOLDINGS, INC.: PRODUCT PORTFOLIO
  • TABLE 146. ACELITY HOLDINGS, INC.: KEY STRATEGIC MOVES AND DEVELOPMENTS
  • TABLE 147. STEMCELLS, INC.: KEY EXECUTIVES
  • TABLE 148. STEMCELLS, INC.: COMPANY SNAPSHOT
  • TABLE 149. STEMCELLS, INC.: OPERATING SEGMENTS
  • TABLE 150. STEMCELLS, INC.: PRODUCT PORTFOLIO
  • TABLE 151. STEMCELLS, INC.: KEY STRATEGIC MOVES AND DEVELOPMENTS
  • TABLE 152. JAPAN TISSUE ENGINEERING CO., LTD.: KEY EXECUTIVES
  • TABLE 153. JAPAN TISSUE ENGINEERING CO., LTD.: COMPANY SNAPSHOT
  • TABLE 154. JAPAN TISSUE ENGINEERING CO., LTD.: OPERATING SEGMENTS
  • TABLE 155. JAPAN TISSUE ENGINEERING CO., LTD.: PRODUCT PORTFOLIO
  • TABLE 156. JAPAN TISSUE ENGINEERING CO., LTD.: KEY STRATEGIC MOVES AND DEVELOPMENTS
  • TABLE 157. ORGANOGENESIS INC.: KEY EXECUTIVES
  • TABLE 158. ORGANOGENESIS INC.: COMPANY SNAPSHOT
  • TABLE 159. ORGANOGENESIS INC.: OPERATING SEGMENTS
  • TABLE 160. ORGANOGENESIS INC.: PRODUCT PORTFOLIO
  • TABLE 161. ORGANOGENESIS INC.: KEY STRATEGIC MOVES AND DEVELOPMENTS
  • LIST OF FIGURES

  • FIGURE 1. GLOBAL INDUCED PLURIPOTENT STEM CELLS MARKET SEGMENTATION
  • FIGURE 2. GLOBAL INDUCED PLURIPOTENT STEM CELLS MARKET
  • FIGURE 3. SEGMENTATION INDUCED PLURIPOTENT STEM CELLS MARKET
  • FIGURE 4. TOP INVESTMENT POCKET IN INDUCED PLURIPOTENT STEM CELLS MARKET
  • FIGURE 5. MODERATE BARGAINING POWER OF BUYERS
  • FIGURE 6. MODERATE BARGAINING POWER OF SUPPLIERS
  • FIGURE 7. MODERATE THREAT OF NEW ENTRANTS
  • FIGURE 8. LOW THREAT OF SUBSTITUTION
  • FIGURE 9. HIGH COMPETITIVE RIVALRY
  • FIGURE 10. OPPORTUNITIES, RESTRAINTS AND DRIVERS: GLOBALINDUCED PLURIPOTENT STEM CELLS MARKET
  • FIGURE 11. INDUCED PLURIPOTENT STEM CELLS MARKET SEGMENTATION, BY BY DERIVED CELL TYPE
  • FIGURE 12. INDUCED PLURIPOTENT STEM CELLS MARKET FOR HEPATOCYTES, BY COUNTRY, 2025-2033 ($MILLION)
  • FIGURE 13. INDUCED PLURIPOTENT STEM CELLS MARKET FOR FIBROBLASTS, BY COUNTRY, 2025-2033 ($MILLION)
  • FIGURE 14. INDUCED PLURIPOTENT STEM CELLS MARKET FOR KERATINOCYTES, BY COUNTRY, 2025-2033 ($MILLION)
  • FIGURE 15. INDUCED PLURIPOTENT STEM CELLS MARKET FOR AMNIOTIC CELLS, BY COUNTRY, 2025-2033 ($MILLION)
  • FIGURE 16. INDUCED PLURIPOTENT STEM CELLS MARKET FOR OTHERS, BY COUNTRY, 2025-2033 ($MILLION)
  • FIGURE 17. INDUCED PLURIPOTENT STEM CELLS MARKET SEGMENTATION, BY BY APPLICATION
  • FIGURE 18. INDUCED PLURIPOTENT STEM CELLS MARKET FOR ACADEMIC RESEARCH, BY COUNTRY, 2025-2033 ($MILLION)
  • FIGURE 19. INDUCED PLURIPOTENT STEM CELLS MARKET FOR DRUG DEVELOPMENT AND DISCOVERY, BY COUNTRY, 2025-2033 ($MILLION)
  • FIGURE 20. INDUCED PLURIPOTENT STEM CELLS MARKET FOR TOXICITY SCREENING, BY COUNTRY, 2025-2033 ($MILLION)
  • FIGURE 21. INDUCED PLURIPOTENT STEM CELLS MARKET FOR REGENERATIVE MEDICINE, BY COUNTRY, 2025-2033 ($MILLION)
  • FIGURE 22. INDUCED PLURIPOTENT STEM CELLS MARKET SEGMENTATION, BY BY END-USER
  • FIGURE 23. INDUCED PLURIPOTENT STEM CELLS MARKET FOR HOSPITALS, BY COUNTRY, 2025-2033 ($MILLION)
  • FIGURE 24. INDUCED PLURIPOTENT STEM CELLS MARKET FOR RESEARCH LABORATORIES, BY COUNTRY, 2025-2033 ($MILLION)
  • FIGURE 25. TOP WINNING STRATEGIES, BY YEAR, 2022-2024*
  • FIGURE 26. TOP WINNING STRATEGIES, BY DEVELOPMENT, 2022-2024*
  • FIGURE 27. TOP WINNING STRATEGIES, BY COMPANY, 2022-2024*
  • FIGURE 28. PRODUCT MAPPING OF TOP 10 PLAYERS
  • FIGURE 29. COMPETITIVE DASHBOARD
  • FIGURE 30. COMPETITIVE HEATMAP: INDUCED PLURIPOTENT STEM CELLS MARKET
  • FIGURE 31. TOP PLAYER POSITIONING, 2024
  • FIGURE 32. FUJIFILM HOLDING CORPORATION: NET SALES, 2022-2024 ($MILLION)
  • FIGURE 33. FUJIFILM HOLDING CORPORATION: REVENUE SHARE, BY SEGMENT, 2024 (%)
  • FIGURE 34. FUJIFILM HOLDING CORPORATION: REVENUE SHARE, BY REGION, 2024 (%)
  • FIGURE 35. ASTELLAS PHARMA INC.: NET SALES, 2022-2024 ($MILLION)
  • FIGURE 36. ASTELLAS PHARMA INC.: REVENUE SHARE, BY SEGMENT, 2024 (%)
  • FIGURE 37. ASTELLAS PHARMA INC.: REVENUE SHARE, BY REGION, 2024 (%)
  • FIGURE 38. FATE THERAPEUTICS, INC.: NET SALES, 2022-2024 ($MILLION)
  • FIGURE 39. FATE THERAPEUTICS, INC.: REVENUE SHARE, BY SEGMENT, 2024 (%)
  • FIGURE 40. FATE THERAPEUTICS, INC.: REVENUE SHARE, BY REGION, 2024 (%)
  • FIGURE 41. BRISTOL-MYERS SQUIBB COMPANY: NET SALES, 2022-2024 ($MILLION)
  • FIGURE 42. BRISTOL-MYERS SQUIBB COMPANY: REVENUE SHARE, BY SEGMENT, 2024 (%)
  • FIGURE 43. BRISTOL-MYERS SQUIBB COMPANY: REVENUE SHARE, BY REGION, 2024 (%)
  • FIGURE 44. VIACYTE, INC.: NET SALES, 2022-2024 ($MILLION)
  • FIGURE 45. VIACYTE, INC.: REVENUE SHARE, BY SEGMENT, 2024 (%)
  • FIGURE 46. VIACYTE, INC.: REVENUE SHARE, BY REGION, 2024 (%)
  • FIGURE 47. CELGENE CORPORATION: NET SALES, 2022-2024 ($MILLION)
  • FIGURE 48. CELGENE CORPORATION: REVENUE SHARE, BY SEGMENT, 2024 (%)
  • FIGURE 49. CELGENE CORPORATION: REVENUE SHARE, BY REGION, 2024 (%)
  • FIGURE 50. AASTROM BIOSCIENCES, INC.: NET SALES, 2022-2024 ($MILLION)
  • FIGURE 51. AASTROM BIOSCIENCES, INC.: REVENUE SHARE, BY SEGMENT, 2024 (%)
  • FIGURE 52. AASTROM BIOSCIENCES, INC.: REVENUE SHARE, BY REGION, 2024 (%)
  • FIGURE 53. ACELITY HOLDINGS, INC.: NET SALES, 2022-2024 ($MILLION)
  • FIGURE 54. ACELITY HOLDINGS, INC.: REVENUE SHARE, BY SEGMENT, 2024 (%)
  • FIGURE 55. ACELITY HOLDINGS, INC.: REVENUE SHARE, BY REGION, 2024 (%)
  • FIGURE 56. STEMCELLS, INC.: NET SALES, 2022-2024 ($MILLION)
  • FIGURE 57. STEMCELLS, INC.: REVENUE SHARE, BY SEGMENT, 2024 (%)
  • FIGURE 58. STEMCELLS, INC.: REVENUE SHARE, BY REGION, 2024 (%)
  • FIGURE 59. JAPAN TISSUE ENGINEERING CO., LTD.: NET SALES, 2022-2024 ($MILLION)
  • FIGURE 60. JAPAN TISSUE ENGINEERING CO., LTD.: REVENUE SHARE, BY SEGMENT, 2024 (%)
  • FIGURE 61. JAPAN TISSUE ENGINEERING CO., LTD.: REVENUE SHARE, BY REGION, 2024 (%)
  • FIGURE 62. ORGANOGENESIS INC.: NET SALES, 2022-2024 ($MILLION)
  • FIGURE 63. ORGANOGENESIS INC.: REVENUE SHARE, BY SEGMENT, 2024 (%)
  • FIGURE 64. ORGANOGENESIS INC.: REVENUE SHARE, BY REGION, 2024 (%)

Purchase Full Report of
Induced Pluripotent Stem Cells Market

PURCHASE OPTIONS


* Taxes/Fees, If applicable will be added during checkout. All prices in USD.

Have a question ?

Need to add more ?

Avail up to 30% discount on subscription plans on


Avenue