Int'l : +1-503-894-6022 | Toll Free : +1-800-792-5285 | help@alliedmarketresearch.com
A10566 | Pages: 314 | Charts: 77 | Tables: 173 |
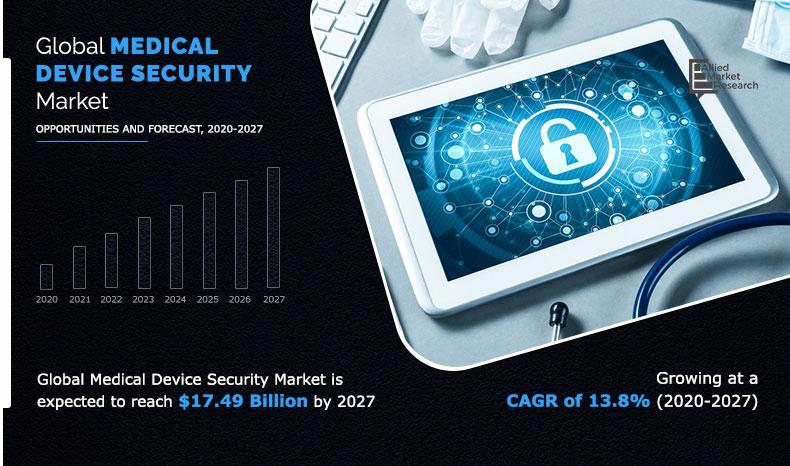
The global medical device security market size was valued at $6.23 billion in 2019, and is projected to reach $17.49 billion by 2027, growing at a CAGR of 13.8% from 2020 to 2027.
[COVIDIMPACTSTATEMENT]
Medical devices used in healthcare industries are increasingly connected to hospital network, internet, and other devices to provide features that increase the ability of healthcare organization to treat patients. This same features also increase the risk of various unauthorized access and cyber-attacks to critical data of the hospitals. Thus, to reduce the risk of cyber-attacks and to enhance the security of medical devices, healthcare organizations are using medical device security system that drives the growth of the market.
Get more information on this report : Request Sample Pages
The key factors that drive the growth of the global medical device security market trends include rise in demand for connected medical devices in the healthcare sector and increase in cyberattacks on connected medical devices. In addition, surge in adoption of IoT based medical devices in the healthcare sector positively impacts the growth of the market. However, lack of awareness regarding the medical security devices among the emerging countries and limited healthcare security budgets is expected to hamper the market growth. On the contrary, rise in adoption of cloud-based medical device security across the globe is expected to offer remunerative opportunities for the expansion of the global market during the forecast period.
The endpoint security segment is expected to garner a significant share during the forecast period, owing to increase in need to provide high security to growing number of connected medical devices across the globe. However, the application security segment is expected to grow at the highest rate during the forecast period, owing to rise in demand for application security solution among the developing nations of Asia-Pacific.
[COMPONENTGRAPH]
Get more information on this report : Request Sample Pages
Region wise, the medical device security market was dominated by North America in 2019, and is expected to retain its position during the forecast period. This is attributed to growing adoption of cloud-based technology across the region and rise in data breaches across various healthcare organization. However, Asia-Pacific is expected to witness significant growth rate during the forecast period, owing to rise in adoption of connected medical devices in hospitals and growing awareness about medical device security solution in developing nations of Asia-Pacific.
The report focuses on the growth prospects, restraints, and trends of the global medical device security market analysis. The study provides Porter’s five forces analysis to understand the impact of various factors such as bargaining power of suppliers, competitive intensity of competitors, threat of new entrants, threat of substitutes, and bargaining power of buyers on the global medical device security market.
[DEPLOYMENTMODELGRAPH]
Get more information on this report : Request Sample Pages
The global medical device security market is segmented on the basis of component, deployment model, security type, device type, end user, and region. In terms of component, the market is fragmented into solution and services. On the basis of deployment model, the market is bifurcated into on-premise and cloud. Depending on security type, it is classified into endpoint security, network security, application security, cloud security and other. On the basis of device type, it is categorized into stationery medical devices, internally embedded medical devices and external medical devices & consumer wearable. According to end user, it is classified into healthcare institutions, medical device manufacturers, and others. Region wise, it is analyzed across North America, Europe, Asia-Pacific, and LAMEA.
The key players operating in the global medical device security market industry include Cisco Systems, Inc., CA Technologies, Check Point Software Technologies, DXC Technology, Fortinet Inc., IBM Corporation, McAfee, LLC, Palo Alto Networks, Sophos Ltd, and Symantec Corporation. These players have adopted various strategies to increase their market penetration and strengthen their foothold in the medical security device security market industry.
[SECURITYTYPEGRAPH]
Get more information on this report : Request Sample Pages
The emergence of COVID-19 is expected to have a considerable impact on the growth of the medical device security market. The spending on the medical device security industry is expected to increase as compared to the spending planned before this pandemic, owing to increase in need for connected devices among various healthcare organization to fight against the pandemic situation. Furthermore, COVID-19 pandemic has brought radical changes to daily lives of people, work, and the surrounding environment. The current estimation of 2027 is projected to be significantly higher than pre-COVID-19 estimates. The medical device security market growth is expected to increase by the end of 2020; however, it is expected to grow significantly at a higher CAGR in the coming years, owing growing patients across the globe and rising need of connected devices in healthcare organization. These factors have become the key components in the emergence of business messaging as the ideal channel to communicate with consumers.
[DEVICETYPEGRAPH]
Get more information on this report : Request Sample Pages
Healthcare organization across the globe are using connected devices, owing to its various benefits which include monitoring of patient’s health, tracking of patients, staff and objects and for automatically collecting and storing data of the organization. In addition, various connected devices involve critical information of the organizations which need enhanced security; thus, healthcare organization are adopting medical device security solution, which drives the growth of the market. Furthermore, growing adoption of connected devices in various hospitals for enhancing patients care, decreasing errors in operations, and reducing the overall expenses of the hospitals also drives the growth of the market. In addition, many developing nations across the globe have limited access to healthcare facilities. The patients in these locations need to travel a significant distance for routine checkups or disease diagnosis at a healthcare facility. Thus, growing adoption of Telemedicine or connected medical devices in such countries will enable patients to communicate to healthcare facilities through their home which is positively impacting the growth of the market.
[ENDUSERGRAPH]
Get more information on this report : Request Sample Pages
The healthcare sector across the globe is using cloud computing services to store electronic records, patient data, and other data of the hospitals on private cloud. In addition, cloud computing helps the healthcare sector to increase or decrease their data storage capacity, owing to which many healthcare service providers are shifting from traditional storage system to cloud based system. Thus, to provide enhance security features to the storage system and to ensure a safe and secure transmission system to cloud storage, various healthcare service providers are adopting cloud-based medical devices storage system, which is expected to fuel the growth of the market. Furthermore, the adoption of medical device security systems among healthcare organizations helps hospitals to securely exchange data among all the relevant healthcare stakeholders like doctors, nurses, and care-givers that, too, in real-time. In addition, large healthcare organizations deal with thousands of connected devices, which are more prone to cyber-attacks and data threat issues, providing lucrative opportunity for the market.
[REGIONGRAPH]
Get more information on this report : Request Sample Pages
Key Benefits For Stakeholders
Key Market Segments
Key Market Players
CHAPTER 1:INTRODUCTION
1.1.Report description
1.2.Key benefits for stakeholders
1.3.Key market segments
1.4.Research methodology
1.4.1.Secondary research
1.4.2.Primary research
1.4.3.Analyst tools & models
CHAPTER 2:EXECUTIVE SUMMARY
2.1.Key findings
2.1.1.Top impacting factors
2.1.2.Top investment pockets
2.2.CXO perspective
CHAPTER 3:MARKET OVERVIEW
3.1.Market definition and scope
3.2.Key forces shaping global medical device security
3.3.Market dynamics
3.3.1.Drivers
3.3.1.1.Increasing cyber-attacks and threats to healthcare industry
3.3.1.2.Growing demand for connected medical devices
3.3.1.3.Stringent government guidelines
3.3.2.Restraints
3.3.2.1.Limited budgets for healthcare security
3.3.3.Opportunity
3.3.3.1.Increase in adoption of Internet of Medical Things (IoMT) in healthcare industry
3.3.3.2.Rise in adoption of cloud-based medical device security across the globe
3.4.COVID-19 impact analysis on medical device security
3.4.1.Impact on market size
3.4.2.Consumer trends, preferences, and budget impact
3.4.3.Economic impact
3.4.4.Strategies to tackle negative impact
3.4.5.Opportunity window
CHAPTER 4:MEDICAL DEVICE SECURITY , BY COMPONENT
4.1.Overview
4.2.Solution
4.2.1.Key market trends, growth factors, and opportunities
4.2.2.By Solution Type
4.2.2.1.Identity & Access Management Solutions
4.2.2.2.Antivirus/Antimalware Solutions
4.2.2.3.Encryption Solutions
4.2.2.4.Data Loss Prevention Solutions
4.2.2.5.Risk & Compliance Management
4.2.2.6.Intrusion Detection Systems/Intrusion Prevention Systems
4.2.2.7.Disaster Recovery Solutions
4.2.2.8.Distributed Denial of Service Solutions
4.2.2.9.Others
4.2.3.Market size and forecast, by region
4.2.4.Market analysis, by country
4.3.Services
4.3.1.Key market trends, growth factors, and opportunities
4.3.2.Market size and forecast, by region
4.3.3.Market analysis, by country
CHAPTER 5:MEDICAL DEVICE SECURITY , BY DEPLOYMENT MODEL
5.1.Overview
5.2.On-premise
5.2.1.Key market trends, growth factors, and opportunities
5.2.2.Market size and forecast, by region
5.2.3.Market analysis, by country
5.3.Cloud-based
5.3.1.Key market trends, growth factors, and opportunities
5.3.2.Market size and forecast, by region
5.3.3.Market analysis, by country
CHAPTER 6:MEDICAL DEVICE SECURITY , BY SECURITY TYPE
6.1.Overview
6.2.Endpoint Security
6.2.1.Key market trends, growth factors, and opportunities
6.2.2.Market size and forecast, by region
6.2.3.Market analysis, by country
6.3.Network Security
6.3.1.Key market trends, growth factors, and opportunities
6.3.2.Market size and forecast, by region
6.3.3.Market analysis, by country
6.4.Application Security
6.4.1.Key market trends, growth factors, and opportunities
6.4.2.Market size and forecast, by region
6.4.3.Market analysis, by country
6.5.Cloud Security
6.5.1.Key market trends, growth factors, and opportunities
6.5.2.Market size and forecast, by region
6.5.3.Market analysis, by country
6.6.Others
6.6.1.Key market trends, growth factors, and opportunities
6.6.2.Market size and forecast, by region
6.6.3.Market analysis, by country
CHAPTER 7:MEDICAL DEVICE SECURITY , BY DEVICE TYPE
7.1.Overview
7.2.Stationery Medical Devices
7.2.1.Key market trends, growth factors, and opportunities
7.2.2.Market size and forecast, by region
7.2.3.Market analysis, by country
7.3.Internally Embedded Medical Devices
7.3.1.Key market trends, growth factors, and opportunities
7.3.2.Market size and forecast, by region
7.3.3.Market analysis, by country
7.4.External Medical Devices & Consumer Wearables
7.4.1.Key market trends, growth factors, and opportunities
7.4.2.Market size and forecast, by region
7.4.3.Market analysis, by country
CHAPTER 8:MEDICAL DEVICE SECURITY , BY END USER
8.1.Overview
8.2.Healthcare Institutions
8.2.1.Key market trends, growth factors, and opportunities
8.2.2.Market size and forecast, by region
8.2.3.Market analysis, by country
8.3.Medical Device Manufacturers
8.3.1.Key market trends, growth factors, and opportunities
8.3.2.Market size and forecast, by region
8.3.3.Market analysis, by country
8.4.Others
8.4.1.Key market trends, growth factors, and opportunities
8.4.2.Market size and forecast, by region
8.4.3.Market analysis, by country
CHAPTER 9:MEDICAL DEVICE SECURITY , BY REGION
9.1.Overview
9.2.North America
9.2.1.Key market trends, growth factors, and opportunities
9.2.2.Market size and forecast, by component
9.2.3.Market size and forecast, by deployment model
9.2.4.Market size and forecast, by security type
9.2.5.Market size and forecast, by device type
9.2.6.Market size and forecast, by end-user
9.2.7.Market analysis, by country
9.2.7.1.U.S.
9.2.7.1.1.Market size and forecast, by component
9.2.7.1.2.Market size and forecast, by deployment model
9.2.7.1.3.Market size and forecast, by security type
9.2.7.1.4.Market size and forecast, by device type
9.2.7.1.5.Market size and forecast, by end-user
9.2.7.2.Canada
9.2.7.2.1.Market size and forecast, by component
9.2.7.2.2.Market size and forecast, by deployment model
9.2.7.2.3.Market size and forecast, by security type
9.2.7.2.4.Market size and forecast, by device type
9.2.7.2.5.Market size and forecast, by end-user
9.3.Europe
9.3.1.Key market trends, growth factors, and opportunities
9.3.2.Market size and forecast, by component
9.3.3.Market size and forecast, by deployment model
9.3.4.Market size and forecast, by security type
9.3.5.Market size and forecast, by device type
9.3.6.Market size and forecast, by end-user
9.3.7.Market analysis, by country
9.3.7.1.UK
9.3.7.1.1.Market size and forecast, by component
9.3.7.1.2.Market size and forecast, by deployment model
9.3.7.1.3.Market size and forecast, by security type
9.3.7.1.4.Market size and forecast, by device type
9.3.7.1.5.Market size and forecast, by end-user
9.3.7.2.Germany
9.3.7.2.1.Market size and forecast, by component
9.3.7.2.2.Market size and forecast, by deployment model
9.3.7.2.3.Market size and forecast, by security type
9.3.7.2.4.Market size and forecast, by device type
9.3.7.2.5.Market size and forecast, by end-user
9.3.7.3.France
9.3.7.3.1.Market size and forecast, by component
9.3.7.3.2.Market size and forecast, by deployment model
9.3.7.3.3.Market size and forecast, by security type
9.3.7.3.4.Market size and forecast, by device type
9.3.7.3.5.Market size and forecast, by end-user
9.3.7.4.Italy
9.3.7.4.1.Market size and forecast, by component
9.3.7.4.2.Market size and forecast, by deployment model
9.3.7.4.3.Market size and forecast, by security type
9.3.7.4.4.Market size and forecast, by device type
9.3.7.4.5.Market size and forecast, by end-user
9.3.7.5.Spain
9.3.7.5.1.Market size and forecast, by component
9.3.7.5.2.Market size and forecast, by deployment model
9.3.7.5.3.Market size and forecast, by security type
9.3.7.5.4.Market size and forecast, by device type
9.3.7.5.5.Market size and forecast, by end-user
9.3.7.6.Russia
9.3.7.6.1.Market size and forecast, by component
9.3.7.6.2.Market size and forecast, by deployment model
9.3.7.6.3.Market size and forecast, by security type
9.3.7.6.4.Market size and forecast, by device type
9.3.7.6.5.Market size and forecast, by end-user
9.3.7.7.Rest of Europe
9.3.7.7.1.Market size and forecast, by component
9.3.7.7.2.Market size and forecast, by deployment model
9.3.7.7.3.Market size and forecast, by security type
9.3.7.7.4.Market size and forecast, by device type
9.3.7.7.5.Market size and forecast, by end-user
9.4.Asia-Pacific
9.4.1.Key market trends, growth factors, and opportunities
9.4.2.Market size and forecast, by component
9.4.3.Market size and forecast, by deployment model
9.4.4.Market size and forecast, by security type
9.4.5.Market size and forecast, by device type
9.4.6.Market size and forecast, by end-user
9.4.7.Market analysis, by country
9.4.7.1.China
9.4.7.1.1.Market size and forecast, by component
9.4.7.1.2.Market size and forecast, by deployment model
9.4.7.1.3.Market size and forecast, by security type
9.4.7.1.4.Market size and forecast, by device type
9.4.7.1.5.Market size and forecast, by end-user
9.4.7.2.India
9.4.7.2.1.Market size and forecast, by component
9.4.7.2.2.Market size and forecast, by deployment model
9.4.7.2.3.Market size and forecast, by security type
9.4.7.2.4.Market size and forecast, by device type
9.4.7.2.5.Market size and forecast, by end-user
9.4.7.3.Japan
9.4.7.3.1.Market size and forecast, by component
9.4.7.3.2.Market size and forecast, by deployment model
9.4.7.3.3.Market size and forecast, by security type
9.4.7.3.4.Market size and forecast, by device type
9.4.7.3.5.Market size and forecast, by end-user
9.4.7.4.Australia
9.4.7.4.1.Market size and forecast, by component
9.4.7.4.2.Market size and forecast, by deployment model
9.4.7.4.3.Market size and forecast, by security type
9.4.7.4.4.Market size and forecast, by device type
9.4.7.4.5.Market size and forecast, by end-user
9.4.7.5.South Korea
9.4.7.5.1.Market size and forecast, by component
9.4.7.5.2.Market size and forecast, by deployment model
9.4.7.5.3.Market size and forecast, by security type
9.4.7.5.4.Market size and forecast, by device type
9.4.7.5.5.Market size and forecast, by end-user
9.4.7.6.Singapore
9.4.7.6.1.Market size and forecast, by component
9.4.7.6.2.Market size and forecast, by deployment model
9.4.7.6.3.Market size and forecast, by security type
9.4.7.6.4.Market size and forecast, by device type
9.4.7.6.5.Market size and forecast, by end-user
9.4.7.7.Rest of Asia-pacific
9.4.7.7.1.Market size and forecast, by component
9.4.7.7.2.Market size and forecast, by deployment model
9.4.7.7.3.Market size and forecast, by security type
9.4.7.7.4.Market size and forecast, by device type
9.4.7.7.5.Market size and forecast, by end-user
9.5.LAMEA
9.5.1.Key market trends, growth factors, and opportunities
9.5.2.Market size and forecast, by component
9.5.3.Market size and forecast, by deployment model
9.5.4.Market size and forecast, by security type
9.5.5.Market size and forecast, by device type
9.5.6.Market size and forecast, by end-user
9.5.7.Market analysis, by country
9.5.7.1.Latin America
9.5.7.1.1.Market size and forecast, by component
9.5.7.1.2.Market size and forecast, by deployment model
9.5.7.1.3.Market size and forecast, by security type
9.5.7.1.4.Market size and forecast, by device type
9.5.7.1.5.Market size and forecast, by end-user
9.5.7.2.Middle East
9.5.7.2.1.Market size and forecast, by component
9.5.7.2.2.Market size and forecast, by deployment model
9.5.7.2.3.Market size and forecast, by security type
9.5.7.2.4.Market size and forecast, by device type
9.5.7.2.5.Market size and forecast, by end-user
9.5.7.3.Africa
9.5.7.3.1.Market size and forecast, by component
9.5.7.3.2.Market size and forecast, by deployment model
9.5.7.3.3.Market size and forecast, by security type
9.5.7.3.4.Market size and forecast, by device type
9.5.7.3.5.Market size and forecast, by end-user
CHAPTER 10:COMPETITIVE LANDSCAPE
10.1.Key players positioning analysis, 2019
10.2.Competitive dashboard
10.3.Top winning strategies
CHAPTER 11:COMPANY PROFILE
11.1.Check Point Software Technologies Ltd.
11.1.1.Company overview
11.1.2.Key executives
11.1.3.Company snapshot
11.1.4.Product portfolio
11.1.5.R&D Expenditure
11.1.6.Business performance
11.1.7.Key strategic moves and developments
11.2.Cisco Systems, Inc.
11.2.1.Company overview
11.2.2.Key executives
11.2.3.Company snapshot
11.2.4.Product portfolio
11.2.5.R&D expenditure
11.2.6.Business performanc
11.3.CLEARDATA
11.3.1.Company overview
11.3.2.Key Executives
11.3.3.Company snapshot
11.3.4.Product portfolio
11.3.5.Key strategic moves and developments
11.4.CLOUDPASSAGE
11.4.1.Company overview
11.4.2.Key Executives
11.4.3.Company snapshot
11.4.4.Product portfolio
11.5.DXC Technology Company
11.5.1.Company overview
11.5.2.Key Executives
11.5.3.Company snapshot
11.5.4.Operating business segments
11.5.5.Product portfolio
11.5.6.Business performance
11.5.7.DXC Technology Company: Revenue share by segment, 2020 (%)
11.6.GENERAL ELECTRIC COMPANY
11.6.1.Company overview
11.6.2.Key Executives
11.6.3.Company snapshot
11.6.4.Operating business segments
11.6.5.Product portfolio
11.6.6.Business performance
11.6.7.Key strategic moves and developments
11.7.INTERNATIONAL BUSINESS MACHINES CORPORATION
11.7.1.Company overview
11.7.2.Key Executives
11.7.3.Company snapshot
11.7.4.Operating business segments
11.7.5.Product portfolio
11.7.6.R&D Expenditure
11.7.7.Business performance
11.7.8.Key strategic moves and developments
11.8.MCAFEE, LLC
11.8.1.Company overview
11.8.2.Key Executives
11.8.3.Company snapshot
11.8.4.Product portfolio
11.8.5.Key strategic moves and developments
11.9.PALO ALTO NETWORKS
11.9.1.Company overview
11.9.2.Key Executives
11.9.3.Company snapshot
11.9.4.Product portfolio
11.9.5.R&D Expenditure
11.9.6.Business performance
11.9.7.Key strategic moves and developments
11.10.SOPHOS LTD.
11.10.1.Company overview
11.10.2.Key Executives
11.10.3.Company snapshot
11.10.4.Product portfolio
11.10.5.R&D Expenditure
11.10.6.Business performance
11.10.7.Key strategic moves and developments
LIST OF TABLES
TABLE 01.GLOBAL MEDICAL DEVICE SECURITY MARKET REVENUE, BY COMPONENT, 2019–2027 ($MILLION)
TABLE 02.MEDICAL DEVICE SECURITY SOLUTION MARKET REVENUE, BY REGION, 2019–2027 ($MILLION)
TABLE 03.MEDICAL DEVICE SECURITY MARKET REVENUE, BY REGION, 2019–2027 ($MILLION)
TABLE 04.GLOBAL MEDICAL DEVICE SECURITY MARKET REVENUE, BY DEPLOYMENT MODEL, 2019-2027 ($MILLION)
TABLE 05.ON-PREMISE-BASED MEDICAL DEVICE SECURITY , BY REGION 2019–2027 ($MILLION)
TABLE 06.CLOUD-BASED MEDICAL DEVICE SECURITY MARKET REVENUE, BY REGION 2019-2027 ($MILLION)
TABLE 07.GLOBAL MEDICAL DEVICE SECURITY MARKET REVENUE, BY SECURITY TYPE, 2019-2027($MILLION)
TABLE 08.MEDICAL DEVICE SECURITY MARKET REVENUE FOR ENDPOINT SECURITY, BY REGION 2019-2027 ($MILLION)
TABLE 09.MEDICAL DEVICE SECURITY MARKET REVENUE FOR NETWORK SECURITY, BY REGION 2019-2027 ($MILLION)
TABLE 10.MEDICAL DEVICE SECURITY MARKET REVENUE FOR APPLICATION SECURITY, BY REGION 2019-2027 ($MILLION)
TABLE 11.MEDICAL DEVICE SECURITY MARKET REVENUE FOR CLOUD SECURITY, BY REGION 2019-2027 ($MILLION)
TABLE 12.MEDICAL DEVICE SECURITY MARKET REVENUE FOR OTHERS, BY REGION 2019-2027 ($MILLION)
TABLE 13.GLOBAL MEDICAL DEVICE SECURITY MARKET REVENUE, BY DEVICE TYPE, 2019-2027 ($MILLION)
TABLE 14.MEDICAL DEVICE SECURITY MARKET REVENUE FOR STATIONERY MEDICAL DEVICES, BY REGION, 2019-2027 ($MILLION)
TABLE 15.MEDICAL DEVICE SECURITY MARKET REVENUE FOR INTERNALLY EMBEDDED MEDICAL DEVICES, BY REGION, 2019-2027 ($MILLION)
TABLE 16.MEDICAL DEVICE SECURITY MARKET REVENUE FOR EXTERNAL MEDICAL DEVICES & CONSUMER WEARABLES, BY REGION, 2019-2027 ($MILLION)
TABLE 17.GLOBAL MEDICAL DEVICE SECURITY MARKET REVENUE, BY END USER, 2019-2027 ($MILLION)
TABLE 18.MEDICAL DEVICE SECURITY MARKET REVENUE FOR HEALTHCARE INSTITUTIONS, BY REGION, 2019-2027 ($MILLION)
TABLE 19.MEDICAL DEVICE SECURITY MARKET REVENUE FOR MEDICAL DEVICE MANUFACTURERS, BY REGION, 2019-2027 ($MILLION)
TABLE 20.MEDICAL DEVICE SECURITY MARKET REVENUE FOR HEALTHCARE PAYERS, BY REGION, 2019-2027 ($MILLION)
TABLE 21.MEDICAL DEVICE SECURITY MARKET REVENUE, BY REGION, 2019–2027 ($MILLION)
TABLE 22.NORTH AMERICA MEDICAL DEVICE SECURITY MARKET REVENUE, BY COMPONENT, 2019–2027 ($MILLION)
TABLE 23.NORTH AMERICA MEDICAL DEVICE SECURITY MARKET REVENUE, BY DEPLOYMENT MODEL, 2019–2027 ($MILLION)
TABLE 24.NORTH AMERICA MEDICAL DEVICE SECURITY MARKET REVENUE, BY SECURITY TYPE, 2019–2027 ($MILLION)
TABLE 25.NORTH AMERICA MEDICAL DEVICE SECURITY MARKET REVENUE, BY DEVICE TYPE, 2019–2027 ($MILLION)
TABLE 26.NORTH AMERICA MEDICAL DEVICE SECURITY MARKET REVENUE, BY END USER, 2019–2027 ($MILLION)
TABLE 27.NORTH AMERICA MEDICAL DEVICE SECURITY MARKET REVENUE, BY COUNTRY, 2019–2027 ($MILLION)
TABLE 28.U.S. MEDICAL DEVICE SECURITY MARKET REVENUE, BY COMPONENT, 2019–2027 ($MILLION)
TABLE 29.U.S. MEDICAL DEVICE SECURITY MARKET REVENUE, BY DEPLOYMENT MODEL, 2019–2027 ($MILLION)
TABLE 30.U.S. MEDICAL DEVICE SECURITY MARKET REVENUE, BY SECURITY TYPE, 2019–2027 ($MILLION)
TABLE 31.U.S. MEDICAL DEVICE SECURITY MARKET REVENUE, BY DEVICE TYPE, 2019–2027 ($MILLION)
TABLE 32.U.S. MEDICAL DEVICE SECURITY MARKET REVENUE, BY END-USER, 2019–2027 ($MILLION)
TABLE 33.CANADA MEDICAL DEVICE SECURITY MARKET REVENUE, BY COMPONENT, 2019–2027 ($MILLION)
TABLE 34.CANADA MEDICAL DEVICE SECURITY MARKET REVENUE, BY DEPLOYMENT MODEL, 2019–2027 ($MILLION)
TABLE 35.CANADA MEDICAL DEVICE SECURITY MARKET REVENUE, BY SECURITY TYPE, 2019–2027 ($MILLION)
TABLE 36.CANADA MEDICAL DEVICE SECURITY MARKET REVENUE, BY DEVICE TYPE, 2019–2027 ($MILLION)
TABLE 37.CANADA MEDICAL DEVICE SECURITY MARKET REVENUE, BY END-USER, 2019–2027 ($MILLION)
TABLE 38.EUROPE MEDICAL DEVICE SECURITY MARKET REVENUE, BY COMPONENT, 2019–2027 ($MILLION)
TABLE 39.EUROPE MEDICAL DEVICE SECURITY MARKET REVENUE, BY DEPLOYMENT MODEL, 2019–2027 ($MILLION)
TABLE 40.EUROPE MEDICAL DEVICE SECURITY MARKET REVENUE, BY SECURITY TYPE, 2019–2027 ($MILLION)
TABLE 41.EUROPE MEDICAL DEVICE SECURITY MARKET REVENUE, BY DEVICE TYPE, 2019–2027 ($MILLION)
TABLE 42.EUROPE MEDICAL DEVICE SECURITY MARKET REVENUE, BY END USER, 2019–2027 ($MILLION)
TABLE 43.EUROPEMEDICAL DEVICE SECURITY MARKET REVENUE, BY COUNTRY, 2019–2027 ($MILLION)
TABLE 44.UK MEDICAL DEVICE SECURITY MARKET REVENUE, BY COMPONENT, 2019–2027 ($MILLION)
TABLE 45.UK MEDICAL DEVICE SECURITY MARKET REVENUE, BY DEPLOYMENT MODEL, 2019–2027 ($MILLION)
TABLE 46.UK MEDICAL DEVICE SECURITY MARKET REVENUE, BY SECURITY TYPE, 2019–2027 ($MILLION)
TABLE 47.UK MEDICAL DEVICE SECURITY MARKET REVENUE, BY DEVICE TYPE, 2019–2027 ($MILLION)
TABLE 48.UK MEDICAL DEVICE SECURITY MARKET REVENUE, BY END-USER, 2019–2027 ($MILLION)
TABLE 49.GERMANY MEDICAL DEVICE SECURITY MARKET REVENUE, BY COMPONENT, 2019–2027 ($MILLION)
TABLE 50.GERMANY MEDICAL DEVICE SECURITY MARKET REVENUE, BY DEPLOYMENT MODEL, 2019–2027 ($MILLION)
TABLE 51.GERMANY MEDICAL DEVICE SECURITY MARKET REVENUE, BY SECURITY TYPE, 2019–2027 ($MILLION)
TABLE 52.GERMANY MEDICAL DEVICE SECURITY MARKET REVENUE, BY DEVICE TYPE, 2019–2027 ($MILLION)
TABLE 53.GERMANY MEDICAL DEVICE SECURITY MARKET REVENUE, BY END-USER, 2019–2027 ($MILLION)
TABLE 54.FRANCE MEDICAL DEVICE SECURITY MARKET REVENUE, BY COMPONENT, 2019–2027 ($MILLION)
TABLE 55.FRANCE MEDICAL DEVICE SECURITY MARKET REVENUE, BY DEPLOYMENT MODEL, 2019–2027 ($MILLION)
TABLE 56.FRANCE MEDICAL DEVICE SECURITY MARKET REVENUE, BY SECURITY TYPE, 2019–2027 ($MILLION)
TABLE 57.FRANCE MEDICAL DEVICE SECURITY MARKET REVENUE, BY DEVICE TYPE, 2019–2027 ($MILLION)
TABLE 58.FRANCE MEDICAL DEVICE SECURITY MARKET REVENUE, BY END-USER, 2019–2027 ($MILLION)
TABLE 59.ITALY MEDICAL DEVICE SECURITY MARKET REVENUE, BY COMPONENT, 2019–2027 ($MILLION)
TABLE 60.ITALY MEDICAL DEVICE SECURITY MARKET REVENUE, BY DEPLOYMENT MODEL, 2019–2027 ($MILLION)
TABLE 61.ITALY MEDICAL DEVICE SECURITY MARKET REVENUE, BY SECURITY TYPE, 2019–2027 ($MILLION)
TABLE 62.ITALY MEDICAL DEVICE SECURITY MARKET REVENUE, BY DEVICE TYPE, 2019–2027 ($MILLION)
TABLE 63.ITALY MEDICAL DEVICE SECURITY MARKET REVENUE, BY END-USER, 2019–2027 ($MILLION)
TABLE 64.SPAIN MEDICAL DEVICE SECURITY MARKET REVENUE, BY COMPONENT, 2019–2027 ($MILLION)
TABLE 65.SPAIN MEDICAL DEVICE SECURITY MARKET REVENUE, BY DEPLOYMENT MODEL, 2019–2027 ($MILLION)
TABLE 66.SPAIN MEDICAL DEVICE SECURITY MARKET REVENUE, BY SECURITY TYPE, 2019–2027 ($MILLION)
TABLE 67.SPAIN MEDICAL DEVICE SECURITY MARKET REVENUE, BY DEVICE TYPE, 2019–2027 ($MILLION)
TABLE 68.SPAIN MEDICAL DEVICE SECURITY MARKET REVENUE, BY END-USER, 2019–2027 ($MILLION)
TABLE 69.RUSSIA MEDICAL DEVICE SECURITY MARKET REVENUE, BY COMPONENT, 2019–2027 ($MILLION)
TABLE 70.RUSSIA MEDICAL DEVICE SECURITY MARKET REVENUE, BY DEPLOYMENT MODEL, 2019–2027 ($MILLION)
TABLE 71.RUSSIA MEDICAL DEVICE SECURITY MARKET REVENUE, BY SECURITY TYPE, 2019–2027 ($MILLION)
TABLE 72.RUSSIA MEDICAL DEVICE SECURITY MARKET REVENUE, BY DEVICE TYPE, 2019–2027 ($MILLION)
TABLE 73.RUSSIA MEDICAL DEVICE SECURITY MARKET REVENUE, BY END-USER, 2019–2027 ($MILLION)
TABLE 74.REST OF EUROPE MEDICAL DEVICE SECURITY MARKET REVENUE, BY COMPONENT, 2019–2027 ($MILLION)
TABLE 75.REST OF EUROPE MEDICAL DEVICE SECURITY MARKET REVENUE, BY DEPLOYMENT MODEL, 2019–2027 ($MILLION)
TABLE 76.REST OF EUROPE MEDICAL DEVICE SECURITY MARKET REVENUE, BY SECURITY TYPE, 2019–2027 ($MILLION)
TABLE 77.REST OF EUROPE MEDICAL DEVICE SECURITY MARKET REVENUE, BY DEVICE TYPE, 2019–2027 ($MILLION)
TABLE 78.REST OF EUROPE MEDICAL DEVICE SECURITY MARKET REVENUE, BY END-USER, 2019–2027 ($MILLION)
TABLE 79.ASIA-PACIFIC MEDICAL DEVICE SECURITY MARKET REVENUE, BY COMPONENT, 2019–2027 ($MILLION)
TABLE 80.ASIA-PACIFIC MEDICAL DEVICE SECURITY MARKET REVENUE, BY DEPLOYMENT MODEL, 2019–2027 ($MILLION)
TABLE 81.ASIA-PACIFIC MEDICAL DEVICE SECURITY MARKET REVENUE, BY SECURITY TYPE, 2019–2027 ($MILLION)
TABLE 82.ASIA-PACIFIC MEDICAL DEVICE SECURITY MARKET REVENUE, BY DEVICE TYPE, 2019–2027 ($MILLION)
TABLE 83.ASIA-PACIFIC MEDICAL DEVICE SECURITY MARKET REVENUE, BY END USER, 2019–2027 ($MILLION)
TABLE 84.ASIA-PACIFICMEDICAL DEVICE SECURITY MARKET REVENUE, BY COUNTRY, 2019–2027 ($MILLION)
TABLE 85.CHINA MEDICAL DEVICE SECURITY MARKET REVENUE, BY COMPONENT, 2019–2027 ($MILLION)
TABLE 86.CHINA MEDICAL DEVICE SECURITY MARKET REVENUE, BY DEPLOYMENT MODEL, 2019–2027 ($MILLION)
TABLE 87.CHINA MEDICAL DEVICE SECURITY MARKET REVENUE, BY SECURITY TYPE, 2019–2027 ($MILLION)
TABLE 88.CHINA MEDICAL DEVICE SECURITY MARKET REVENUE, BY DEVICE TYPE, 2019–2027 ($MILLION)
TABLE 89.CHINA MEDICAL DEVICE SECURITY MARKET REVENUE, BY END-USER, 2019–2027 ($MILLION)
TABLE 90.INDIA MEDICAL DEVICE SECURITY MARKET REVENUE, BY COMPONENT, 2019–2027 ($MILLION)
TABLE 91.INDIA MEDICAL DEVICE SECURITY MARKET REVENUE, BY DEPLOYMENT MODEL, 2019–2027 ($MILLION)
TABLE 92.INDIA MEDICAL DEVICE SECURITY MARKET REVENUE, BY SECURITY TYPE, 2019–2027 ($MILLION)
TABLE 93.INDIA MEDICAL DEVICE SECURITY MARKET REVENUE, BY DEVICE TYPE, 2019–2027 ($MILLION)
TABLE 94.INDIA MEDICAL DEVICE SECURITY MARKET REVENUE, BY END-USER, 2019–2027 ($MILLION)
TABLE 95.JAPAN MEDICAL DEVICE SECURITY MARKET REVENUE, BY COMPONENT, 2019–2027 ($MILLION)
TABLE 96.JAPAN MEDICAL DEVICE SECURITY MARKET REVENUE, BY DEPLOYMENT MODEL, 2019–2027 ($MILLION)
TABLE 97.JAPAN MEDICAL DEVICE SECURITY MARKET REVENUE, BY SECURITY TYPE, 2019–2027 ($MILLION)
TABLE 98.JAPAN MEDICAL DEVICE SECURITY MARKET REVENUE, BY DEVICE TYPE, 2019–2027 ($MILLION)
TABLE 99.JAPAN MEDICAL DEVICE SECURITY MARKET REVENUE, BY END-USER, 2019–2027 ($MILLION)
TABLE 100.AUSTRALIA MEDICAL DEVICE SECURITY MARKET REVENUE, BY COMPONENT, 2019–2027 ($MILLION)
TABLE 101.AUSTRALIA MEDICAL DEVICE SECURITY MARKET REVENUE, BY DEPLOYMENT MODEL, 2019–2027 ($MILLION)
TABLE 102.AUSTRALIA MEDICAL DEVICE SECURITY MARKET REVENUE, BY SECURITY TYPE, 2019–2027 ($MILLION)
TABLE 103.AUSTRALIA MEDICAL DEVICE SECURITY MARKET REVENUE, BY DEVICE TYPE, 2019–2027 ($MILLION)
TABLE 104.AUSTRALIA MEDICAL DEVICE SECURITY MARKET REVENUE, BY END-USER, 2019–2027 ($MILLION)
TABLE 105.SOUTH KOREA MEDICAL DEVICE SECURITY MARKET REVENUE, BY COMPONENT, 2019–2027 ($MILLION)
TABLE 106.SOUTH KOREA MEDICAL DEVICE SECURITY MARKET REVENUE, BY DEPLOYMENT MODEL, 2019–2027 ($MILLION)
TABLE 107.SOUTH KOREA MEDICAL DEVICE SECURITY MARKET REVENUE, BY SECURITY TYPE, 2019–2027 ($MILLION)
TABLE 108.SOUTH KOREA MEDICAL DEVICE SECURITY MARKET REVENUE, BY DEVICE TYPE, 2019–2027 ($MILLION)
TABLE 109.SOUTH KOREA MEDICAL DEVICE SECURITY MARKET REVENUE, BY END-USER, 2019–2027 ($MILLION)
TABLE 110.SINGAPORE MEDICAL DEVICE SECURITY MARKET REVENUE, BY COMPONENT, 2019–2027 ($MILLION)
TABLE 111.SINGAPORE MEDICAL DEVICE SECURITY MARKET REVENUE, BY DEPLOYMENT MODEL, 2019–2027 ($MILLION)
TABLE 112.SINGAPORE MEDICAL DEVICE SECURITY MARKET REVENUE, BY SECURITY TYPE, 2019–2027 ($MILLION)
TABLE 113.SINGAPORE MEDICAL DEVICE SECURITY MARKET REVENUE, BY DEVICE TYPE, 2019–2027 ($MILLION)
TABLE 114.SINGAPORE MEDICAL DEVICE SECURITY MARKET REVENUE, BY END-USER, 2019–2027 ($MILLION)
TABLE 115.REST OF ASIA-PACIFIC MEDICAL DEVICE SECURITY MARKET REVENUE, BY COMPONENT, 2019–2027 ($MILLION)
TABLE 116.REST OF ASIA-PACIFIC MEDICAL DEVICE SECURITY MARKET REVENUE, BY DEPLOYMENT MODEL, 2019–2027 ($MILLION)
TABLE 117.REST OF ASIA-PACIFIC MEDICAL DEVICE SECURITY MARKET REVENUE, BY SECURITY TYPE, 2019–2027 ($MILLION)
TABLE 118.REST OF ASIA-PACIFIC MEDICAL DEVICE SECURITY MARKET REVENUE, BY DEVICE TYPE, 2019–2027 ($MILLION)
TABLE 119.REST OF ASIA-PACIFIC MEDICAL DEVICE SECURITY MARKET REVENUE, BY END-USER, 2019–2027 ($MILLION)
TABLE 120.LAMEA MEDICAL DEVICE SECURITY MARKET REVENUE, BY COMPONENT, 2019–2027 ($MILLION)
TABLE 121.LAMEA MEDICAL DEVICE SECURITY MARKET REVENUE, BY DEPLOYMENT MODEL, 2019–2027 ($MILLION)
TABLE 122.LAMEA MEDICAL DEVICE SECURITY MARKET REVENUE, BY SECURITY TYPE, 2019–2027 ($MILLION)
TABLE 123.LAMEA MEDICAL DEVICE SECURITY MARKET REVENUE, BY DEVICE TYPE, 2019–2027 ($MILLION)
TABLE 124.LAMEA MEDICAL DEVICE SECURITY MARKET REVENUE, BY END USER, 2019–2027 ($MILLION)
TABLE 125.LAMEAMEDICAL DEVICE SECURITY MARKET REVENUE, BY COUNTRY, 2019–2027 ($MILLION)
TABLE 126.LATIN AMERICA MEDICAL DEVICE SECURITY MARKET REVENUE, BY COMPONENT, 2019–2027 ($MILLION)
TABLE 127.LATIN AMERICA MEDICAL DEVICE SECURITY MARKET REVENUE, BY DEPLOYMENT MODEL, 2019–2027 ($MILLION)
TABLE 128.LATIN AMERICA MEDICAL DEVICE SECURITY MARKET REVENUE, BY SECURITY TYPE, 2019–2027 ($MILLION)
TABLE 129.LATIN AMERICA MEDICAL DEVICE SECURITY MARKET REVENUE, BY DEVICE TYPE, 2019–2027 ($MILLION)
TABLE 130.LATIN AMERICA MEDICAL DEVICE SECURITY MARKET REVENUE, BY END-USER, 2019–2027 ($MILLION)
TABLE 131.MIDDLE EAST MEDICAL DEVICE SECURITY MARKET REVENUE, BY COMPONENT, 2019–2027 ($MILLION)
TABLE 132.MIDDLE EAST MEDICAL DEVICE SECURITY MARKET REVENUE, BY DEPLOYMENT MODEL, 2019–2027 ($MILLION)
TABLE 133.MIDDLE EAST MEDICAL DEVICE SECURITY MARKET REVENUE, BY SECURITY TYPE, 2019–2027 ($MILLION)
TABLE 134.MIDDLE EAST MEDICAL DEVICE SECURITY MARKET REVENUE, BY DEVICE TYPE, 2019–2027 ($MILLION)
TABLE 135.MIDDLE EAST MEDICAL DEVICE SECURITY MARKET REVENUE, BY END-USER, 2019–2027 ($MILLION)
TABLE 136.AFRICA MEDICAL DEVICE SECURITY MARKET REVENUE, BY COMPONENT, 2019–2027 ($MILLION)
TABLE 137.AFRICA MEDICAL DEVICE SECURITY MARKET REVENUE, BY DEPLOYMENT MODEL, 2019–2027 ($MILLION)
TABLE 138.AFRICA MEDICAL DEVICE SECURITY MARKET REVENUE, BY SECURITY TYPE, 2019–2027 ($MILLION)
TABLE 139.AFRICA MEDICAL DEVICE SECURITY MARKET REVENUE, BY DEVICE TYPE, 2019–2027 ($MILLION)
TABLE 140.AFRICA MEDICAL DEVICE SECURITY MARKET REVENUE, BY END-USER, 2019–2027 ($MILLION)
TABLE 141.CHECK POINT SOFTWARE TECHNOLOGIES LTD: KEY EXECUTIVES
TABLE 142.CHECK POINT SOFTWARE TECHNOLOGIES LTD: COMPANY SNAPSHOT
TABLE 143.CHECK POINT SOFTWARE TECHNOLOGIES LTD: PRODUCT PORTFOLIO
TABLE 144.CISCO SYSTEMS, INC.: KEY EXECUTIVES
TABLE 145.CISCO SYSTEMS, INC.: COMPANY SNAPSHOT
TABLE 146.CISCO SYSTEMS, INC.: PRODUCT PORTFOLIO
TABLE 147.CLEARDATA: KEY EXECUTIVES
TABLE 148.CLEARDATA: COMPANY SNAPSHOT
TABLE 149.CLEARDATA: PRODUCT PORTFOLIO
TABLE 150.CLOUDPASSAGE : KEY EXECUTIVES
TABLE 151.CLOUDPASSAGE : COMPANY SNAPSHOT
TABLE 152.CLOUDPASSAGE : PRODUCT PORTFOLIO
TABLE 153.DXC TECHNOLOGY COMPANY .: KEY EXECUTIVES
TABLE 154.DXC TECHNOLOGY COMPANY .: COMPANY SNAPSHOT
TABLE 155.DXC TECHNOLOGY COMPANY: OPERATING SEGMENTS
TABLE 156.DXC TECHNOLOGY COMPANY : PRODUCT PORTFOLIO
TABLE 157.GENERAL ELECTRIC COMPANY : KEY EXECUTIVES
TABLE 158.GENERAL ELECTRIC COMPANY. : COMPANY SNAPSHOT
TABLE 159.GENERAL ELECTRIC: OPERATING SEGMENTS
TABLE 160.GENERAL ELECTRIC COMPANY. : PRODUCT PORTFOLIO
TABLE 161.INTERNATIONAL BUSINESS MACHINES CORPORATION: KEY EXECUTIVES
TABLE 162.INTERNATIONAL BUSINESS MACHINES CORPORATION: COMPANY SNAPSHOT
TABLE 163.INTERNATIONAL BUSINESS MACHINES CORPORATION: OPERATING SEGMENTS
TABLE 164.INTERNATIONAL BUSINESS MACHINES CORPORATION: PRODUCT PORTFOLIO
TABLE 165.MCAFEE, LLC: KEY EXECUTIVES
TABLE 166.MCAFEE, LLC: COMPANY SNAPSHOT
TABLE 167.MCAFEE, LLC: PRODUCT PORTFOLIO
TABLE 168.PALO ALTO NETWORKS: KEY EXECUTIVES
TABLE 169.PALO ALTO NETWORKS: COMPANY SNAPSHOT
TABLE 170.PALO ALTO NETWORKS: PRODUCT PORTFOLIO
TABLE 171.SOPHOS LTD. :KEY EXECUTIVES
TABLE 172.SOPHOS LTD. : COMPANY SNAPSHOT
TABLE 173.SOPHOS LTD. : PRODUCT PORTFOLIO
LIST OF FIGURES
FIGURE 01.KEY MARKET SEGMENTS
FIGURE 02.GLOBAL MEDICAL DEVICE SECURITY MARKET SNAPSHOT, BY SEGMENTATION, 2019–2027
FIGURE 03.MEDICAL DEVICE SECURITY SNAPSHOT, BY REGION, 2019–2027
FIGURE 04.MEDICAL DEVICE SECURITY: TOP IMPACTING FACTOR
FIGURE 05.TOP INVESTMENT POCKETS
FIGURE 06.LOW-TO-HIGH BARGAINING POWER OF SUPPLIERS
FIGURE 07.LOW-TO-HIGH BARGAINING POWER OF BUYERS
FIGURE 08.LOW-TO-MODERATE THREAT OF SUBSTITUTES
FIGURE 09.MODERATE-TO-HIGH THREAT OF NEW ENTRANTS
FIGURE 10.MODERATE-TO-HIGH COMPETITIVE RIVALRY
FIGURE 11.GLOBAL MEDICAL DEVICE SECURITY, BY COMPONENT, 2019-2027
FIGURE 12.COMPARATIVE SHARE ANALYSIS OF MEDICAL DEVICE SECURITY SOLUTION MARKET, BY COUNTRY, 2019 & 2027(%)
FIGURE 13.COMPARATIVE SHARE ANALYSIS OF MEDICAL DEVICE SECURITY SERVICE MARKET, BY COUNTRY, 2019 & 2027(%)
FIGURE 14.GLOBAL MEDICAL DEVICE SECURITY MARKET REVENUE, BY DEPLOYMENT MODE, 2019–2027 ($MILLION)
FIGURE 15.COMPARATIVE SHARE ANALYSIS OF ON-PREMISE-BASED MEDICAL DEVICE SECURITY, BY COUNTRY, 2019 & 2027(%)
FIGURE 16.COMPARATIVE SHARE ANALYSIS FOR CLOUD-BASED MEDICAL DEVICE SECURITY, BY COUNTRY, 2019 & 2027(%)
FIGURE 17.GLOBAL MEDICAL DEVICE SECURITY MARKET, BY SECURITY TYPE, 2019-2027
FIGURE 18.COMPARATIVE SHARE ANALYSIS MEDICAL DEVICE SECURITY FOR ENDPOINT SECURITY, BY COUNTRY, 2019 & 2027(%)
FIGURE 19.COMPARATIVE SHARE ANALYSIS MEDICAL DEVICE SECURITY FOR NETWORK SECURITY, BY COUNTRY, 2019 & 2027(%)
FIGURE 20.COMPARATIVE SHARE ANALYSIS MEDICAL DEVICE SECURITY FOR APPLICATION SECURITY, BY COUNTRY, 2019 & 2027 (%)
FIGURE 21.COMPARATIVE SHARE ANALYSIS MEDICAL DEVICE SECURITY FOR CLOUD SECURITY, BY COUNTRY, 2019 & 2027(%)
FIGURE 22.COMPARATIVE SHARE ANALYSIS MEDICAL DEVICE SECURITY FOR OTHERS, BY COUNTRY, 2019 & 2027(%)
FIGURE 23.GLOBAL MEDICAL DEVICE SECURITY MARKET, BY DEVICE TYPE, 2019-2027
FIGURE 24.COMPARATIVE SHARE ANALYSIS OF MEDICAL DEVICE SECURITY FOR STATIONERY MEDICAL DEVICES, BY COUNTRY, 2019 & 2027(%)
FIGURE 25.COMPARATIVE SHARE ANALYSIS OF MEDICAL DEVICE SECURITY FOR INTERNALLY EMBEDDED MEDICAL DEVICE, BY COUNTRY, 2019 & 2027(%)
FIGURE 26.COMPARATIVE SHARE ANALYSIS OF MEDICAL DEVICE SECURITY FOR EXTERNAL MEDICAL DEVICES & CONSUMER WEARABLES, BY COUNTRY, 2019 & 2027(%)
FIGURE 27.GLOBAL MEDICAL DEVICE SECURITY, BY END USER, 2019-2027
FIGURE 28.COMPARATIVE SHARE ANALYSIS OF MEDICAL DEVICE SECURITY FOR HEALTHCARE INSTITUTIONS, BY COUNTRY, 2019 & 2027(%)
FIGURE 29.COMPARATIVE SHARE ANALYSIS OF MEDICAL DEVICE SECURITY FOR MEDICAL DEVICE MANUFACTURERS, BY COUNTRY, 2019 & 2027(%)
FIGURE 30.COMPARATIVE SHARE ANALYSIS OF MEDICAL DEVICE SECURITY FOR HEALTHCARE PAYERS, BY COUNTRY, 2019 & 2027(%)
FIGURE 31.U.S. MEDICAL DEVICE SECURITY MARKET REVENUE, 2019-2027 ($MILLION)
FIGURE 32.CANADA MEDICAL DEVICE SECURITY MARKET REVENUE, 2019-2027 ($MILLION)
FIGURE 33.UK MEDICAL DEVICE SECURITY MARKET REVENUE, 2019-2027 ($MILLION)
FIGURE 34.GERMANY MEDICAL DEVICE SECURITY MARKET REVENUE, 2019-2027 ($MILLION)
FIGURE 35.FRANCE MEDICAL DEVICE SECURITY MARKET REVENUE, 2019-2027 ($MILLION)
FIGURE 36.ITALY MEDICAL DEVICE SECURITY MARKET REVENUE, 2019-2027 ($MILLION)
FIGURE 37.SPAIN MEDICAL DEVICE SECURITY MARKET REVENUE, 2019-2027 ($MILLION)
FIGURE 38.RUSSIA MEDICAL DEVICE SECURITY MARKET REVENUE, 2019-2027 ($MILLION)
FIGURE 39.REST OF EUROPE MEDICAL DEVICE SECURITY MARKET REVENUE, 2019-2027 ($MILLION)
FIGURE 40.CHINA MEDICAL DEVICE SECURITY MARKET REVENUE, 2019-2027 ($MILLION)
FIGURE 41.INDIA MEDICAL DEVICE SECURITY MARKET REVENUE, 2019-2027 ($MILLION)
FIGURE 42.JAPAN MEDICAL DEVICE SECURITY MARKET REVENUE, 2019-2027 ($MILLION)
FIGURE 43.AUSTRALIA MEDICAL DEVICE SECURITY MARKET REVENUE, 2019-2027 ($MILLION)
FIGURE 44.SOUTH KOREA MEDICAL DEVICE SECURITY MARKET REVENUE, 2019-2027 ($MILLION)
FIGURE 45.SINGAPORE MEDICAL DEVICE SECURITY MARKET REVENUE, 2019-2027 ($MILLION)
FIGURE 46.REST OF ASIA-PACIFIC MEDICAL DEVICE SECURITY MARKET REVENUE, 2019-2027 ($MILLION)
FIGURE 47.LATIN AMERICA MEDICAL DEVICE SECURITY MARKET REVENUE, 2019-2027 ($MILLION)
FIGURE 48.MIDDLE EAST MEDICAL DEVICE SECURITY MARKET REVENUE, 2019-2027 ($MILLION)
FIGURE 49.AFRICA MEDICAL DEVICE SECURITY MARKET REVENUE, 2019-2027 ($MILLION)
FIGURE 50.KEY PLAYER POSITIONING ANLYSIS: GLOBAL MEDICAL DEVICE SECURITY MARKET
FIGURE 51.COMPETITIVE DASHBOARD
FIGURE 52.COMPETITIVE DASHBOARD
FIGURE 53.COMPETITIVE HEATMAP OF KEY PLAYERS
FIGURE 54.TOP WINNING STRATEGIES, BY YEAR, 2019-2021
FIGURE 55.TOP WINNING STRATEGIES, BY DEVELOPMENT, 2019-2021
FIGURE 56.TOP WINNING STRATEGIES, BY COMPANY, 2019-2021
FIGURE 57.R&D EXPENDITURE, 2017–2019 ($MILLION)
FIGURE 58.CHECK POINT SOFTWARE TECHNOLOGIES LTD : NET SALES, 2017–2019 ($MILLION),
FIGURE 59.CHECK POINT SOFTWARE TECHNOLOGIES LTD: REVENUE SHARE BY REGION(2019)
FIGURE 60.R&D EXPENDITURE, 2018–2020 ($MILLION)
FIGURE 61.CISCO SYSTEMS, INC.: NET SALES, 2018–2020 ($MILLION),
FIGURE 62.CISCO SYSTEMS, INC.: REVENUE SHARE BY SEGMENT(2020)
FIGURE 63.DXC TECHNOLOGY COMPANY: REVENUE, 2018–2020 ($MILLION)
FIGURE 64.DXC TECHNOLOGY COMPANY: REVENUE SHARE BY REGION, 2020 (%)
FIGURE 65.GENERAL ELECTRIC COMPANY: REVENUE, 2018–2020 ($MILLION)
FIGURE 66.GENERAL ELECTRIC COMPANY: REVENUE SHARE BY SEGMENT, 2020 (%)
FIGURE 67.GENERAL ELECTRIC COMPANY: REVENUE SHARE BY REGION, 2020 (%)
FIGURE 68.R&D EXPENDITURE, 2017–2019 ($MILLION)
FIGURE 69.INTERNATIONAL BUSINESS MACHINES CORPORATION: REVENUE, 2017–2019 ($MILLION)
FIGURE 70.INTERNATIONAL BUSINESS MACHINES CORPORATION: REVENUE SHARE BY SEGMENT, 2019 (%)
FIGURE 71.INTERNATIONAL BUSINESS MACHINES CORPORATION: REVENUE SHARE BY REGION, 2019 (%)
FIGURE 72.R&D EXPENDITURE, 2017–2019 ($MILLION)
FIGURE 73.PALO ALTO NETWORKS: REVENUE, 2017–2019 ($MILLION)
FIGURE 74.PALO ALTO NETWORKS: REVENUE SHARE BY REGION, 2019 (%)
FIGURE 75.R&D EXPENDITURE, 2017–2019 ($MILLION)
FIGURE 76.SOPHOS LTD. : NET SALES, 2017–2019 ($MILLION),
FIGURE 77.SOPHOS LTD. : REVENUE SHARE BY REGION(2019)