Int'l : +1-503-894-6022 | Toll Free : +1-800-792-5285 | help@alliedmarketresearch.com
A06313 | Pages: 209 | Charts: 38 | Tables: 91 |
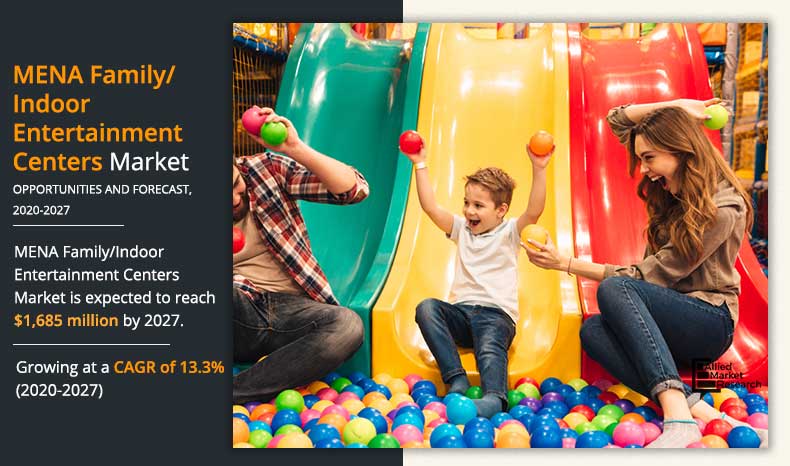
The MENA family/indoor entertainment centers market size was valued at $618.65 million in 2019, and is projected to reach $1,685.36 million by 2027, growing at a CAGR of 13.3% from 2020 to 2027.
Family/Indoor entertainment centers (FEC) are small amusement parks which is specifically designed to keep the entire family including all age groups engaged at low prices. FEC offer a variety of fun options such as gaming consoles, arcades, video games, indoor playground systems, playground areas, redeemers, skill-oriented machine games, child-driving, and others. These centers also host private events such as corporate events and birthday parties in areas such as malls. The popularity of these centers is growing as it offers different engaging services like food & beverages, edutainment games, AR & VR based games and other entertainment options which are gaining rapid traction in the market. These centers follow different strategies such as gift cards, bonuses, and birthday discounts to attract the customers which is impacting positively on the market growth.
Get more information on this report : Request Sample Pages
The teenagers (13-19) segment dominated the MENA indoor entertainment centers market share in 2019, and is expected to continue this trend during the forecast period. This is attributed to upsurge in popularity of arcade games and amusement parks among teenagers. Moreover, kids of this age groups are more inclined toward AR & VR gaming zones to witness advanced entertainment experiences. However, the families with children (9-12) segment is expected to witness highest CAGR during the MENA indoor entertainment centers market forecast period, as the families with children of age between 9 and 12 years are more focused on shaping their children’s future through fun, entertainment, and education. Thus, most of the parents prefer fun learning and adventure-focused games, which is the major factor that drives the market growth.
[REVENUESOURCEGRAPH]
Get more information on this report : Request Sample Pages
The 20,001 to 40,000 sq. ft. segment dominated the MENA family/indoor entertainment centers market in 2019, and is expected to continue this trend during the forecast period, owing to large number of attractions and facilities they offer to different age groups. Moreover, increase in demand for adventurous and outdoor games such as paintball, rock/wall climbing, and miniature golf is a major factor fueling the growth of these FECs. However, 10,001 to 20,000 sq. ft. segment is expected to witness highest growth rate in the upcoming years, as number of key players are developing FECs that range between 10,001 sq. ft. and 20,000 sq. ft. to cater to increasing needs of local audience, which drives the growth of the segment. Furthermore, standard indoor centers range from 15,000 to 20,000 square feet in size as compared to outdoor parks that are as large as 16 acres.
[APPLICATIONGRAPH]
Get more information on this report : Request Sample Pages
Rest of MENA dominated the MENA family/indoor entertainment centers market in 2019, and is projected to remain dominant during the forecast period. Weather condition in these countries is major factor, which helps in the migration of footfalls in the malls. This has increased the popularity of edutainment venues, which conduct summer camps indoors during the summer break, thereby driving the growth of the market. Furthermore, a number of common factors such as rise in disposable income of the population, presence of large consumer base, surge in number of malls, continuous initiatives by government for the development of entertainment centers, and availability of technologically advanced gaming attractions are projected to positively impact the growth of the family entertainment centers market in North Africa.
[COUNTRYGRAPH]
Get more information on this report : Request Sample Pages
The report focuses on the growth prospects, restraints, and MENA family entertainment centers market analysis. The study provides Porter’s five forces analysis of the MENA family/indoor entertainment centers industry to understand the impact of various factors such as bargaining power of suppliers, competitive intensity of competitors, threat of new entrants, threat of substitutes, and bargaining power of buyers on the MENA family entertainment centers market trends.
The MENA family/indoor entertainment centers market is segmented into visitor demographics, facility size, revenue source, application, type, and country. In terms of visitor demographics, the market is categorized into families with children aging 0–8 years, families with children aging 9–12 years, teenagers (13–19), young adults (20–25), and adults (aged 25+). On the basis of facility size, it is divided into up to 5,000 sq. ft., 5,001 to 10,000 sq. ft., 10,001–20,000 sq. ft., 20,001–40,000 sq. ft., 1–10 acre, 11–30 acre, and over 30 acre. Depending on revenue source, it is segregated into entry fees & ticket sales, food & beverages, merchandising, advertisement, and others. The applications covered in the study include arcade studios, AR & VR gaming zones, physical play activities, skill/competition games, and others. On the basis of type, the market is differentiated into children’s entertainment centers (CECs), children’s edutainment centers (CEDCs), adult entertainment centers (AECs), and location-based VR entertainment centers (LBECs). Country wise, the market is analyzed across Egypt, Saudi Arabia, United Arab Emirates (UAE), Bahrain, Kuwait, and rest of MENA.
The key players operating in the MENA family/indoor entertainment centers industry include Dave & Buster’s, CEC Entertainment, Inc., Kidzania, Funcity, SMAAASH Entertainment Pvt. Ltd., Legoland, CAVU Designwerks Inc., a Majid Al Futtaim Company (Magic Planet), Landmark Group, and Adventureland.
The growth of the family entertainment centers market in Middle East is impacted by a number of factors such as continuous launch of new FECs supporting family activities and integration food & beverages and games such as participatory play, increase in number of malls, presence of large consumer base, and rise in use of various promotional strategies & offers such as loyalty programs. In addition, incorporation of new and technologically advanced gaming areas within FECs along with increase in preference of customers to celebrate occasions in FECs is expected to positively impact the growth of the market. However, increase in ticket prices and rise in popularity of home & mobile gaming are expected to hinder the MENA family entertainment centers market growth during the forecast period. However, each factor is anticipated to have its definite impact on the market.
Upsurge in number of malls in MENA region is driving the growth of the market, as FECs are attractively located in malls where customers visit frequently. Mall development in the region is intense and world-renowned, as the largest malls in the world are mostly in the Middle East region. For Instance, Dubai has around 65 malls in a city of just over 3 million people with 10 malls under construction, which also include Dubai Square, a megamall set to be biggest in the world. Moreover, the idea of adding major FECs in malls has been gaining rapid popularity over the last few years. This has led to construction of several new malls with substantial square footage allocated to FECs. They substantially lengthen shopper stay, and increase revenue for other tenants.
Presence of large target population
The primary target customers of FECs are kids aged between 8 and 14 years and their parents. Thus, the presence of huge youth population under 14 years of age in MENA drives the growth of the market. Furthermore, owing to rise in per capita disposable income of individuals in developing countries, the spending on children’s by their parents is continuously increasing, which is expected to drive the growth of the family/indoor entertainment centers market. For instance, children and young individuals aged between 0 and 24 years in MENA region currently account for approximately half of the region’s population.
Key Benefits For Stakeholders
This study includes the MENA family/indoor entertainment centers market analysis, trends, and future estimations to determine the imminent investment pockets.
The report presents information related to key drivers, restraints, and MENA indoor entertainment centers market opportunity.
The MENA family/indoor entertainment centers market size is quantitatively analyzed from 2019 to 2027 to highlight the financial competency of the industry.
Porter’s five forces analysis illustrates the potency of buyers & suppliers in the MENA family/indoor entertainment centers market.
Key Market Segments
Key Market Players
CHAPTER 1:INTRODUCTION
1.1.REPORT DESCRIPTION
1.2.KEY BENEFITS FOR STAKEHOLDERS
1.3.KEY MARKET SEGMENTS
1.4.RESEARCH METHODOLOGY
1.4.1.Secondary research
1.4.2.Primary research
1.4.3.Analyst tools & models
CHAPTER 2:EXECUTIVE SUMMARY
2.1.CXO PERSPECTIVE
CHAPTER 3:MARKET OVERVIEW
3.1.MARKET DEFINITION AND SCOPE
3.2.KEY FINDINGS
3.2.1.Top impacting factors
3.2.2.Top investment pockets
3.3.PORTER'S FIVE FORCES ANALYSIS
3.4.MARKET DYNAMICS
3.4.1.Drivers
3.4.1.1.Continuous launch of new FECs supporting family activities, F&B integration, and participatory play
3.4.1.2.Increase in number of malls
3.4.1.3.Presence of large target population
3.4.1.4.Rise in use of various promotional strategies and offers such as loyalty programs
3.4.2.Restraints
3.4.2.1.Increase in ticket prices
3.4.2.2.Rise in popularity of home and mobile gaming
3.4.3.Opportunities
3.4.3.1.Addition of new games and ongoing innovation in technology
3.4.3.2.Increase in preference for FECs to celebrate occasions
CHAPTER 4:FAMILY/INDOOR ENTERTAINMENT CENTERS MARKET, BY VISITOR DEMOGRAPHICS
4.1.OVERVIEW
4.2.FAMILIES WITH CHILDREN (0–8)
4.2.1.Key market trends, growth factors, and opportunities
4.2.2.Market size and forecast
4.3.FAMILIES WITH CHILDREN (9–12)
4.3.1.Key market trends, growth factors, and opportunities
4.3.2.Market size and forecast
4.4.TEENAGERS (13-19)
4.4.1.Key market trends, growth factors, and opportunities
4.4.2.Market size and forecast
4.5.YOUNG ADULTS (20-25)
4.5.1.Key market trends, growth factors, and opportunities
4.5.2.Market size and forecast
4.6.ADULTS (25+)
4.6.1.Key market trends, growth factors, and opportunities
4.6.2.Market size and forecast
CHAPTER 5:MENA FAMILY/INDOOR ENTERTAINMENT CENTERS MARKET, BY FACILITY SIZE
5.1.OVERVIEW
5.2.UP TO 5,000 SQ. FT.
5.2.1.Key market trends, growth factors, and opportunities
5.2.2.Market size and forecast, by region
5.3.5,001–10,000 SQ. FT.
5.3.1.Key market trends, growth factors, and opportunities
5.3.2.Market size and forecast, by region
5.4.10,001–20,000 SQ. FT.
5.4.1.Key market trends, growth factors, and opportunities
5.4.2.Market size and forecast
5.5.20,001–40,000 SQ. FT.
5.5.1.Key market trends, growth factors, and opportunities
5.5.2.Market size and forecast
5.6.1–10 ACRE
5.6.1.Key market trends, growth factors, and opportunities
5.6.2.Market size and forecast
5.7.11–30 ACRE
5.7.1.Key market trends, growth factors, and opportunities
5.7.2.Market size and forecast
5.8.OVER 30 ACRE
5.8.1.Key market trends, growth factors, and opportunities
5.8.2.Market size and forecast
CHAPTER 6:FAMILY/INDOOR ENTERTAINMENT CENTERS MARKET, BY REVENUE SOURCE
6.1.OVERVIEW
6.2.ENTRY FEES & TICKET SALES
6.2.1.Key market trends, growth factors, and opportunities
6.2.2.Market size and forecast
6.3.FOOD & BEVERAGES
6.3.1.Key market trends, growth factors, and opportunities
6.3.2.Market size and forecast
6.4.MERCHANDISING
6.4.1.Key market trends, growth factors, and opportunities
6.4.2.Market size and forecast
6.5.ADVERTISEMENT
6.5.1.Key market trends, growth factors, and opportunities
6.5.2.Market size and forecast
6.6.OTHERS
6.6.1.Key market trends, growth factors, and opportunities
6.6.2.Market size and forecast
CHAPTER 7:FAMILY/INDOOR ENTERTAINMENT CENTERS MARKET, BY APPLICATION
7.1.OVERVIEW
7.2.ARCADE STUDIOS
7.2.1.Key market trends, growth factors, and opportunities
7.2.2.Market size and forecast
7.3.AR & VR GAMING ZONES
7.3.1.Key market trends, growth factors, and opportunities
7.3.2.Market size and forecast
7.4.PHYSICAL PLAY ACTIVITIES
7.4.1.Key market trends, growth factors, and opportunities
7.4.2.Market size and forecast
7.5.SKILL/COMPETITION GAMES
7.5.1.Key market trends, growth factors, and opportunities
7.5.2.Market size and forecast
7.6.OTHERS
7.6.1.Key market trends, growth factors, and opportunities
7.6.2.Market size and forecast
CHAPTER 8:FAMILY/INDOOR ENTERTAINMENT CENTERS MARKET, BY TYPE
8.1.OVERVIEW
8.2.CHILDREN’S ENTERTAINMENT CENTERS (CECS)
8.2.1.Key market trends, growth factors, and opportunities
8.2.2.Market size and forecast
8.3.CHILDREN’S EDUTAINMENT CENTERS (CEDCS)
8.3.1.Key market trends, growth factors, and opportunities
8.3.2.Market size and forecast
8.4.ADULT ENTERTAINMENT CENTERS (AECS)
8.4.1.Key market trends, growth factors, and opportunities
8.4.2.Market size and forecast
8.5.LOCATION-BASED ENTERTAINMENT CENTERS (LBECS)
8.5.1.Key market trends, growth factors, and opportunities
8.5.2.Market size and forecast
CHAPTER 9:FAMILY/INDOOR ENTERTAINMENT CENTERS MARKET, BY COUNTRY
9.1.OVERVIEW
9.1.1.Egypt
9.1.1.1.Market trends, key growth factors, and opportunities
9.1.1.2.Market size and forecast, by visitor demographics
9.1.1.3.Market size and forecast, by facility size
9.1.1.4.Market size and forecast, by revenue source
9.1.1.5.Market size and forecast, by application
9.1.1.6.Market size and forecast, by type
9.1.2.Saudi Arabia
9.1.2.1.Market trends, key growth factors, and opportunities
9.1.2.2.Market size and forecast, by visitor demographics
9.1.2.3.Market size and forecast, by facility size
9.1.2.4.Market size and forecast, by revenue source
9.1.2.5.Market size and forecast, by application
9.1.2.6.Market size and forecast, by type
9.1.3.United Arab Emirates
9.1.3.1.Market trends, key growth factors, and opportunities
9.1.3.2.Market size and forecast, by visitor demographics
9.1.3.3.Market size and forecast, by facility size
9.1.3.4.Market size and forecast, by revenue source
9.1.3.5.Market size and forecast, by application
9.1.3.6.Market size and forecast, by type
9.1.4.Bahrain
9.1.4.1.Market trends, key growth factors, and opportunities
9.1.4.2.Market size and forecast, by visitor demographics
9.1.4.3.Market size and forecast, by facility size
9.1.4.4.Market size and forecast, by revenue source
9.1.4.5.Market size and forecast, by application
9.1.4.6.Market size and forecast, by type
9.1.5.Kuwait
9.1.5.1.Market trends, key growth factors, and opportunities
9.1.5.2.Market size and forecast, by visitor demographics
9.1.5.3.Market size and forecast, by facility size
9.1.5.4.Market size and forecast, by revenue source
9.1.5.5.Market size and forecast, by application
9.1.5.6.Market size and forecast, by type
9.1.6.Rest of MENA
9.1.6.1.Market trends, key growth factors, and opportunities
9.1.6.2.Market size and forecast, by visitor demographics
9.1.6.3.Market size and forecast, by facility size
9.1.6.4.Market size and forecast, by revenue source
9.1.6.5.Market size and forecast, by application
9.1.6.6.Market size and forecast, by type
CHAPTER 10:COMPETITIVE LANDSCAPE
10.1.KEY PLAYER POSITIONING
10.2.TOP WINNING STRATEGIES
10.3.COMPETITIVE DASHBOARD
CHAPTER 11:COMPANY PROFILE
11.1.ADVENTURELAND
11.1.1.Company overview
11.1.2.Key executive
11.1.3.Company snapshot
11.1.4.Product portfolio
11.2.CAVU DESIGNWERKS
11.2.1.Company overview
11.2.2.Key executive
11.2.3.Company snapshot
11.2.4.Product portfolio
11.2.5.Key strategic moves and developments
11.3.CEC ENTERTAINMENT, INC.
11.3.1.Company overview
11.3.2.Key executive
11.3.3.Company snapshot
11.3.4.Operating business segments
11.3.5.Product portfolio
11.3.6.Business performance
11.3.7.Key strategic moves and developments
11.4.DAVE & BUSTER’S ENTERTAINMENT, INC.
11.4.1.Company overview
11.4.2.Key executive
11.4.3.Company snapshot
11.4.4.Operating business segments
11.4.5.Product portfolio
11.4.6.Business performance
11.4.7.Key strategic moves and developments
11.5.FUN CITY (LANDMARK LEISURE LLC)
11.5.1.Company overview
11.5.2.Key executive
11.5.3.Company snapshot
11.5.4.Product portfolio
11.5.5.Key strategic moves and developments
11.6.KIDZANIA
11.6.1.Company overview
11.6.2.Key executive
11.6.3.Company snapshot
11.6.4.Product portfolio
11.6.5.Key strategic moves and developments
11.7.LANDMARK GROUP
11.7.1.Company overview
11.7.2.Key executive
11.7.3.Company snapshot
11.7.4.Product portfolio
11.7.5.Key strategic moves and developments
11.8.LEGOLAND
11.8.1.Company overview
11.8.2.Key executive
11.8.3.Company snapshot
11.8.4.Product portfolio
11.9.MAJID AL FUTTAIM
11.9.1.Company overview
11.9.2.Key executive
11.9.3.Company snapshot
11.9.4.Product portfolio
11.9.5.Business performance
11.9.6.Key strategic moves and developments
11.10.SMAAASH
11.10.1.Company overview
11.10.2.Key executive
11.10.3.Company snapshot
11.10.4.Product portfolio
LIST OF TABLES
TABLE 01.MENA FAMILY/INDOOR ENTERTAINMENT CENTERS MARKET REVENUE, BY VISITOR DEMOGRAPHICS, 2019-2027 ($MILLION)
TABLE 02.MENA FAMILY/INDOOR ENTERTAINMENT CENTERS MARKET REVENUE FOR FAMILIES WITH CHILDREN (0–8), 2019–2027 ($MILLION)
TABLE 03.MENA FAMILY/INDOOR ENTERTAINMENT CENTERS MARKET REVENUE FOR FAMILIES WITH CHILDREN (9-12), 2019-2027 ($MILLION)
TABLE 04.MENA FAMILY/INDOOR ENTERTAINMENT CENTERS MARKET REVENUE FOR TEENAGERS (13-19), 2019-2027 ($MILLION)
TABLE 05.MENA FAMILY/INDOOR ENTERTAINMENT CENTERS MARKET REVENUE FOR YOUNG ADULTS (20-25), 2019-2027 ($MILLION)
TABLE 06.MENA FAMILY/INDOOR ENTERTAINMENT CENTERS MARKET REVENUE FOR ADULTS (25+), 2019-2027 ($MILLION)
TABLE 07.MENA FAMILY/INDOOR ENTERTAINMENT CENTERS MARKET REVENUE, BY FACILITY SIZE, 2019-2027 ($MILLION)
TABLE 08.UPTO 5,000 SQ. FT MENA FAMILY/INDOOR ENTERTAINMENT CENTERS MARKET REVENUE, 2019-2027 ($MILLION)
TABLE 09.5,001–10,000 SQ. FT.MENA FAMILY/INDOOR ENTERTAINMENT CENTERS MARKET REVENUE, 2019-2027 ($MILLION)
TABLE 10.10,001 TO 20,000 SQ. FT. MENA FAMILY/INDOOR ENTERTAINMENT CENTERS MARKET REVENUE, 2019–2027 ($MILLION)
TABLE 11.20,001 TO 40,000 SQ. FT. MENA FAMILY/INDOOR ENTERTAINMENT CENTERS MARKET REVENUE, 2019–2027 ($MILLION)
TABLE 12.1-10 ACRE MENA FAMILY/INDOOR ENTERTAINMENT CENTERS MARKET REVENUE, 2019–2027 ($MILLION)
TABLE 13.11- 30 ACRE MENA FAMILY/INDOOR ENTERTAINMENT CENTERS MARKET REVENUE, 2019–2027 ($MILLION)
TABLE 14.OVER 30 ACRE MENA FAMILY/INDOOR ENTERTAINMENT CENTERS MARKET REVENUE, 2019–2027 ($MILLION)
TABLE 15.MENA FAMILY/INDOOR ENTERTAINMENT CENTERS MARKET REVENUE, BY REVENUE SOURCE, 2019-2027 ($MILLION)
TABLE 16.MENA FAMILY/INDOOR ENTERTAINMENT CENTERS MARKET REVENUE FOR ENTRY FEES & TICKET SALES, 2019-2027 ($MILLION)
TABLE 17.MENA FAMILY/INDOOR ENTERTAINMENT CENTERS MARKET REVENUE FOR FOOD & BEVERAGES, 2019-2027 ($MILLION)
TABLE 18.MENA FAMILY/INDOOR ENTERTAINMENT CENTERS MARKET REVENUE FOR MERCHANDISING, 2019-2027 ($MILLION)
TABLE 19.MENA FAMILY/INDOOR ENTERTAINMENT CENTERS MARKET REVENUE FOR ADVERTISEMENT, 2019-2027 ($MILLION)
TABLE 20.MENA FAMILY/INDOOR ENTERTAINMENT CENTERS MARKET REVENUE FOR OTHERS, 2019-2027 ($MILLION)
TABLE 21.MENA FAMILY/INDOOR ENTERTAINMENT CENTERS MARKET REVENUE, BY APPLICATION, 2019-2027 ($MILLION)
TABLE 22.MENA FAMILY/INDOOR ENTERTAINMENT CENTERS MARKET REVENUE FOR ARCADE STUDIOS, 2019-2027 ($MILLION)
TABLE 23.FAMILY/INDOOR ENTERTAINMENT CENTERS MARKET REVENUE FOR AR & VR GAMING ZONES, 2019-2027 ($MILLION)
TABLE 24.FAMILY/INDOOR ENTERTAINMENT CENTERS MARKET REVENUE FOR PHYSICAL PLAY ACTIVITIES, 2019-2027 ($MILLION)
TABLE 25.FAMILY/INDOOR ENTERTAINMENT CENTERS MARKET REVENUE FOR SKILL/COMPETITION GAMES, 2019-2027 ($MILLION)
TABLE 26.FAMILY/INDOOR ENTERTAINMENT CENTERS MARKET REVENUE FOR OTHERS, 2019-2027 ($MILLION)
TABLE 27.MENA FAMILY/INDOOR ENTERTAINMENT CENTERS MARKET REVENUE, BY TYPE, 2019-2027 ($MILLION)
TABLE 28.CHILDREN’S ENTERTAINMENT CENTERS MARKET REVENUE, 2020–2027 ($MILLION)
TABLE 29.CHILDREN’S EDUTAINMENT CENTERS MARKET REVENUE, 2020–2027 ($MILLION)
TABLE 30.ADULT ENTERTAINMENT CENTERS MARKET REVENUE, 2020–2027 ($MILLION)
TABLE 31.LOCATION-BASED ENTERTAINMENT CENTERS (LBECS) MARKET REVENUE, 2020–2027 ($MILLION)
TABLE 32.MENA FAMILY/INDOOR ENTERTAINMENT CENTERS MARKET REVENUE, BY COUNTRY, 2019-2027 ($MILLION)
TABLE 33.EGYPT FAMILY/INDOOR ENTERTAINMENT CENTERS MARKET, BY VISITOR DEMOGRAPHICS, 2019–2027 ($MILLION)
TABLE 34.EGYPT FAMILY/INDOOR ENTERTAINMENT CENTERS SOLUTIONS MARKET, BY FACILITY SIZE, 2019-2027 ($MILLION)
TABLE 35.EGYPT FAMILY/INDOOR ENTERTAINMENT CENTERS MARKET, BY REVENUE SOURCE, 2019-2027 ($MILLION)
TABLE 36.EGYPT FAMILY/INDOOR ENTERTAINMENT CENTERS MARKET, BY APPLICATION, 2019-2027 ($MILLION)
TABLE 37.EGYPT FAMILY/INDOOR ENTERTAINMENT CENTERS MARKET, BY TYPE, 2019–2027 ($MILLION)
TABLE 38.SAUDI ARABIA FAMILY/INDOOR ENTERTAINMENT CENTERS MARKET, BY VISITOR DEMOGRAPHICS, 2019–2027 ($MILLION)
TABLE 39.SAUDI ARABIA FAMILY/INDOOR ENTERTAINMENT CENTERS SOLUTIONS MARKET, BY FACILITY SIZE, 2019-2027 ($MILLION)
TABLE 40.SAUDI ARABIA FAMILY/INDOOR ENTERTAINMENT CENTERS MARKET, BY REVENUE SOURCE, 2019-2027 ($MILLION)
TABLE 41.SAUDI ARABIA FAMILY/INDOOR ENTERTAINMENT CENTERS MARKET, BY APPLICATION, 2019-2027 ($MILLION)
TABLE 42.SAUDI ARABIA FAMILY/INDOOR ENTERTAINMENT CENTERS MARKET, BY TYPE, 2019–2027 ($MILLION)
TABLE 43.UNITED ARAB EMIRATES FAMILY/INDOOR ENTERTAINMENT CENTERS MARKET, BY VISITOR DEMOGRAPHICS, 2019–2027 ($MILLION)
TABLE 44.UNITED ARAB EMIRATES FAMILY/INDOOR ENTERTAINMENT CENTERS SOLUTIONS MARKET, BY FACILITY SIZE, 2019-2027 ($MILLION)
TABLE 45.UNITED ARAB EMIRATES FAMILY/INDOOR ENTERTAINMENT CENTERS MARKET, BY REVENUE SOURCE, 2019-2027 ($MILLION)
TABLE 46.UNITED ARAB EMIRATES FAMILY/INDOOR ENTERTAINMENT CENTERS MARKET, BY APPLICATION, 2019-2027 ($MILLION)
TABLE 47.UNITED ARAB EMIRATES FAMILY/INDOOR ENTERTAINMENT CENTERS MARKET, BY TYPE, 2019–2027 ($MILLION)
TABLE 48.BAHRAIN FAMILY/INDOOR ENTERTAINMENT CENTERS MARKET, BY VISITOR DEMOGRAPHICS, 2019–2027 ($MILLION)
TABLE 49.BAHRAIN FAMILY/INDOOR ENTERTAINMENT CENTERS SOLUTIONS MARKET, BY FACILITY SIZE, 2019-2027 ($MILLION)
TABLE 50.BAHRAIN FAMILY/INDOOR ENTERTAINMENT CENTERS MARKET, BY REVENUE SOURCE, 2019-2027 ($MILLION)
TABLE 51.BAHRAIN FAMILY/INDOOR ENTERTAINMENT CENTERS MARKET, BY APPLICATION, 2019-2027 ($MILLION)
TABLE 52.BAHRAIN FAMILY/INDOOR ENTERTAINMENT CENTERS MARKET, BY TYPE, 2019–2027 ($MILLION)
TABLE 53.KUWAIT FAMILY/INDOOR ENTERTAINMENT CENTERS MARKET, BY VISITOR DEMOGRAPHICS, 2019–2027 ($MILLION)
TABLE 54.KUWAIT FAMILY/INDOOR ENTERTAINMENT CENTERS SOLUTIONS MARKET, BY FACILITY SIZE, 2019-2027 ($MILLION)
TABLE 55.KUWAIT FAMILY/INDOOR ENTERTAINMENT CENTERS MARKET, BY REVENUE SOURCE, 2019-2027 ($MILLION)
TABLE 56.KUWAIT FAMILY/INDOOR ENTERTAINMENT CENTERS MARKET, BY APPLICATION, 2019-2027 ($MILLION)
TABLE 57.KUWAIT FAMILY/INDOOR ENTERTAINMENT CENTERS MARKET, BY TYPE, 2019–2027 ($MILLION)
TABLE 58.REST OF MENA FAMILY/INDOOR ENTERTAINMENT CENTERS MARKET, BY VISITOR DEMOGRAPHICS, 2019–2027 ($MILLION)
TABLE 59.REST OF MENA FAMILY/INDOOR ENTERTAINMENT CENTERS SOLUTIONS MARKET, BY FACILITY SIZE, 2019-2027 ($MILLION)
TABLE 60.REST OF MENA FAMILY/INDOOR ENTERTAINMENT CENTERS MARKET, BY REVENUE SOURCE, 2019-2027 ($MILLION)
TABLE 61.REST OF MENA FAMILY/INDOOR ENTERTAINMENT CENTERS MARKET, BY APPLICATION, 2019-2027 ($MILLION)
TABLE 62.REST OF MENA FAMILY/INDOOR ENTERTAINMENT CENTERS MARKET, BY TYPE, 2019–2027 ($MILLION)
TABLE 66.CAVU DESIGNWERKS: KEY EXECUTIVE
TABLE 67.CAVU DESIGNWERKS: COMPANY SNAPSHOT
TABLE 68.CAVU DESIGNWERKS: PRODUCT PORTFOLIO
TABLE 69.CEC ENTERTAINMENT, INC.: KEY EXECUTIVE
TABLE 70.CEC ENTERTAINMENT, INC.: COMPANY SNAPSHOT
TABLE 71.CEC ENTERTAINMENT, INC.: OPERATING SEGMENTS
TABLE 72.CEC ENTERTAINMENT, INC.: PRODUCT PORTFOLIO
TABLE 73.CEC ENTERTAINMENT, INC.: KEY STRATEGIC MOVES AND DEVELOPMENTS
TABLE 74.DAVE & BUSTER’S ENTERTAINMENT, INC.: KEY EXECUTIVE
TABLE 75.DAVE & BUSTER’S ENTERTAINMENT, INC.: COMPANY SNAPSHOT
TABLE 76.DAVE & BUSTER’S ENTERTAINMENT, INC.: OPERATING SEGMENTS
TABLE 77.DAVE & BUSTER’S ENTERTAINMENT, INC.: PRODUCT PORTFOLIO
TABLE 78.DAVE & BUSTER’S, INC.: KEY STRATEGIC MOVES AND DEVELOPMENTS
TABLE 79.FUN CITY: KEY EXECUTIVE
TABLE 80.FUN CITY: COMPANY SNAPSHOT
TABLE 81.FUN CITY: PRODUCT PORTFOLIO
TABLE 82.FUN CITY: KEY STRATEGIC MOVES AND DEVELOPMENTS
TABLE 83.DAVE & BUSTER’S ENTERTAINMENT, INC.: KEY EXECUTIVE
TABLE 84.KIDZANIA: COMPANY SNAPSHOT
TABLE 85.KIDZANIA: PRODUCT PORTFOLIO
TABLE 86.KIDZANIA: KEY STRATEGIC MOVES AND DEVELOPMENTS
TABLE 87.LANDMARK GROUP: KEY EXECUTIVE
TABLE 88.LANDMARK GROUP: COMPANY SNAPSHOT
TABLE 89.LANDMARK GROUP: VIDEO ANALYTICS PRODUCT PORTFOLIO
TABLE 90.THE LEGO GROUP: KEY EXECUTIVE
TABLE 91.LEGOLAND: COMPANY SNAPSHOT
TABLE 92.LEGOLAND: PRODUCT PORTFOLIO
TABLE 93.MAJID AL FUTTAIM.: COMPANY SNAPSHOT
TABLE 94.MAJID AL FUTTAIM: VIDEO ANALYTICS PRODUCT PORTFOLIO
TABLE 95.SMAAASH: KEY EXECUTIVE
TABLE 96.SMAAASH: COMPANY SNAPSHOT
TABLE 97.SMAAASH: PRODUCT PORTFOLIO
LIST OF FIGURES
FIGURE 01.KEY MARKET SEGMENTS
FIGURE 02.MENA FAMILY/INDOOR ENTERTAINMENT CENTERS MARKET, 2019-2027
FIGURE 03.MENA FAMILY/INDOOR ENTERTAINMENT CENTERS MARKET, 2019-2027
FIGURE 04.MENA FAMILY/INDOOR ENTERTAINMENT CENTERS MARKET, BY COUNTRY, 2019-2027
FIGURE 05.MENA FAMILY/INDOOR ENTERTAINMENT CENTERS MARKET: KEY PLAYERS
FIGURE 06.TOP IMPACTING FACTORS
FIGURE 07.TOP INVESTMENT POCKETS
FIGURE 08.MODERATE-TO-HIGH BARGAINING POWER OF SUPPLIERS
FIGURE 09.HIGH BARGAINING POWER OF BUYERS
FIGURE 10.MODERATE-TO-HIGH THREAT OF SUBSTITUTES
FIGURE 11.MODERATE-TO-HIGH THREAT OF NEW ENTRANTS
FIGURE 12.MODERATE-TO-HIGH COMPETITIVE RIVALRY
FIGURE 13.DRIVERS, RESTRAINTS, AND OPPORTUNITIES
FIGURE 14.MENA FAMILY/INDOOR ENTERTAINMENT CENTERS MARKET REVENUE, BY VISITOR DEMOGRAPHIC, 2019-2027($MILLION)
FIGURE 15.MENA FAMILY/INDOOR ENTERTAINMENT CENTERS MARKET REVENUE, BY FACILITY SIZE, 2019-2027($MILLION)
FIGURE 16.MENA FAMILY/INDOOR ENTERTAINMENT CENTERS MARKET REVENUE, BY FACILITY SIZE, 2019-2027($MILLION)
FIGURE 17.MENA FAMILY/INDOOR ENTERTAINMENT CENTERS MARKET REVENUE, BY APPLICATION, 2019-2027 ($MILLION)
FIGURE 18.MENA FAMILY/INDOOR ENTERTAINMENT CENTERS MARKET REVENUE, BY TYPE, 2019-2027 ($MILLION)
FIGURE 19.EGYPT FAMILY/INDOOR ENTERTAINMENT CENTERS MARKET, 2019–2027 ($MILLION)
FIGURE 20.SAUDI ARABIA FAMILY/INDOOR ENTERTAINMENT CENTERS MARKET, 2019–2027 ($MILLION)
FIGURE 21.UNITED ARAB EMIRATES FAMILY/INDOOR ENTERTAINMENT CENTERS MARKET, 2019–2027 ($MILLION)
FIGURE 22.BAHRAIN FAMILY/INDOOR ENTERTAINMENT CENTERS MARKET, 2019–2027 ($MILLION)
FIGURE 23.KUWAIT FAMILY/INDOOR ENTERTAINMENT CENTERS MARKET, 2019–2027 ($MILLION)
FIGURE 24.REST OF MENA FAMILY/INDOOR ENTERTAINMENT CENTERS MARKET, 2019–2027 ($MILLION)
FIGURE 25.MENA FAMILY ENTERTAINMENT MARKET: KEY PLAYER POSITIONING, 2019
FIGURE 26.TOP WINNING STRATEGIES, BY YEAR, 2016-2019
FIGURE 27.TOP WINNING STRATEGIES, BY DEVELOPMENT, 2016-2019
FIGURE 28.TOP WINNING STRATEGIES, BY COMPANY, 2016-2019
FIGURE 29.COMPETITIVE DASHBOARD
FIGURE 30.COMPETITIVE DASHBOARD
FIGURE 31.COMPETITIVE HEATMAP OF KEY PLAYERS
FIGURE 32.CEC ENTERTAINMENT, INC.: REVENUE, 2017-2019 ($MILLION)
FIGURE 33.CEC ENTERTAINMENT, INC.: REVENUE SHARE BY SEGMENT, 2019 (%)
FIGURE 34.DAVE & BUSTER’S ENTERTAINMENT, INC.: REVENUE, 2018–2020 ($MILLION)
FIGURE 35.DAVE & BUSTER’S ENTERTAINMENT, INC.: REVENUE SHARE BY SEGMENT, 2020 (%)
FIGURE 36.MAJID AL FUTTAIM: KEY EXECUTIVE
FIGURE 37.MAJID AL FUTTAIM: REVENUE, 2017–2019 ($BILLION)
FIGURE 38.MAJID AL FUTTAIM: REVENUE SHARE BY REGION, 2019 (%)