Int'l : +1-503-894-6022 | Toll Free : +1-800-792-5285 | help@alliedmarketresearch.com
A10608 | Pages: 226 | Charts: 47 | Tables: 152 |
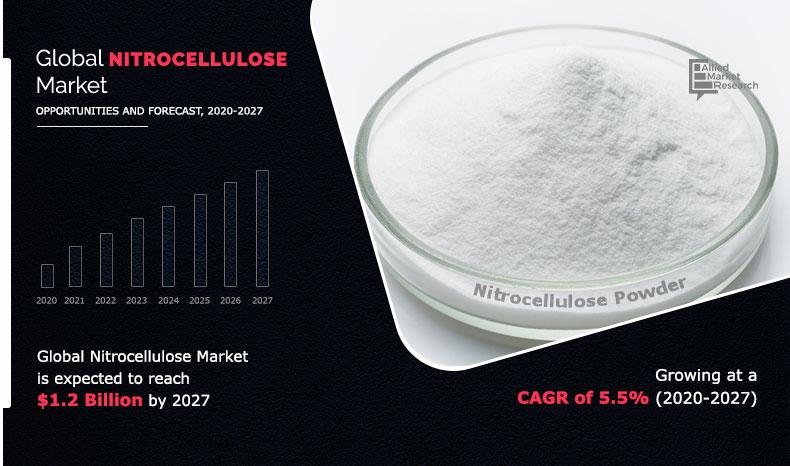
The global nitrocellulose market size was valued at $0.8 billion in 2019, and is projected to reach $1.2 billion by 2027, growing at a CAGR of 5.5% from 2020 to 2027.
Get more information on this report : Request Sample Pages
Nitrocellulose is a highly flammable compound made from cellulose, nitric acid, or other heavy nitrate compounds. Nitrocellulose is referred to as guncotton when used as a low-command explosive or propellant. If cellulose is not completely nitrated, it can also be used as a plastic film, as well as in wooden coatings and ink printing. Over the next six years, the global demand for nitrocellulose is expected to develop due to a range of applications, including explosives, printing tins, wood coatings, and plastic films.
The report provides competitive dynamics by evaluating business segments, product portfolios, target market revenue, geographical presence and key strategic developments by prominent manufacturers.
The nitrocellulose market is fragmented in nature among prominent companies such as Hengshui Orient Chemical Co., Ltd., Nitrocellulose Group, North Sichuan Nitrocellulose Corporation, Nitrex Chemicals India Pvt. Ltd., Synthesia a.s., Hagedorn NC, EURENCO, TNC Industrial Co. Ltd., GRN Cellulose Pvt. Ltd., and Nitro Quimica.
The study contains qualitative information such as the market dynamics (drivers, restraints, challenges, and opportunities), public policy analysis, pricing analysis, and Porter’s Five Force Analysis across North America, Europe, Asia-Pacific, and LAMEA regions.
Latest trends in global nitrocellulose market such as undergoing R&D activities, public policies, and government initiatives are analyzed across 16 countries in 4 different regions.
More than 3,500 nitrocellulose-related product literatures, industry releases, annual reports, and other such documents of key industry participants along with authentic industry journals and government websites have been reviewed for generating high-value industry insights for global nitrocellulose market.
The nitrocellulose market is driven by several key factors, primarily its diverse applications in coatings, inks, and explosives. One of the major drivers is rise in demand for automotive paints and coatings, where nitrocellulose is used due to its fast-drying properties, excellent adhesion, and durability. As the automotive industry expands, particularly in emerging markets such as India and China, the demand for high-performance coatings is rising, directly impacting the nitrocellulose market. In addition, the wood coatings industry is another significant contributor, especially for furniture and musical instruments, as nitrocellulose provides a glossy finish and enhances the aesthetics of wooden surfaces. This, combined with urbanization and rise in disposable incomes in developing economies, drives the growth of the nitrocellulose sector.
Another driver of the nitrocellulose market is the increased use of printing inks in packaging, publication, and textiles. As e-commerce and the food packaging industry experience a boom, particularly due to growing consumer demand for packaged goods, nitrocellulose-based inks are preferred for their excellent printability and fast drying. The shift toward sustainable and environmentally friendly products also drives companies to innovate within this space, as nitrocellulose is considered less harmful than synthetic alternatives. This trend, along with advancements in ink formulations for high-speed printing, continues to support the market growth, especially in regions such as North America and Europe where sustainability is a key concern.
However, several restraints hinder the market growth despite the widespread applications of nitrocellulose. One of the most significant challenges is the stringent regulatory environment surrounding the production and handling of nitrocellulose. Since nitrocellulose is a flammable and potentially explosive compound, its manufacturing process is highly regulated by various governmental bodies such as the Environmental Protection Agency (EPA) in the U.S. and the European Chemicals Agency (ECHA) in Europe. These regulations increase the cost of compliance for manufacturers, which in turn raises production costs. In addition, the hazardous nature of nitrocellulose makes transportation and storage challenging, often requiring specialized facilities and trained personnel to prevent accidents. The risks associated with its handling further restrict its widespread adoption in industries where safer alternatives might exist, thus acting as a significant barrier to market growth.
Another restraint on the nitrocellulose market is increasing shift toward eco-friendly alternatives in industries such as coatings, inks, and adhesives. While nitrocellulose has long been a popular choice due to its versatility and fast-drying properties, concerns over its environmental impact, especially in the production process, have led companies and governments to explore and promote greener alternatives. Solvent-based nitrocellulose coatings, in particular, release volatile organic compounds (VOCs) that contribute to air pollution and pose health risks. With the growing emphasis on sustainability and stricter environmental regulations, the demand for water-based and low-VOC coatings is rising, thereby reducing the appeal of nitrocellulose in certain applications. This trend is further compounded by advancements in bio-based polymers and other environmentally friendly materials, which offer similar benefits to nitrocellulose without the associated environmental risks, creating a long-term challenge for the market.
The nitrocellulose market is segmented into product, application, and region. By product, the market is divided into M grade cellulose, E grade cellulose, and others. On the basis of application, it is differentiated into printing inks, automotive paints, wood coatings, leather finishes, nail varnishes, and others. Region-wise, the market is analyzed across North America, Europe, Asia-Pacific, and LAMEA.
Nitrocellulose Market, By Product
[PRODUCTGRAPH]
Get more information on this report : Request Sample Pages
The M grade cellulose segment held a significant share in the nitrocellulose market in 2020. It is commonly used in consumer products as a thickener and emulsifier in lubricants, dietary supplement capsules, and other applications. The demand for emulsifier from the automotive and aerospace industries is on the rise. As a result, demand for M grade cellulose is expected to rise significantly during the forecast period, propelling the growth of the market.
[APPLICATIONGRAPH]
Get more information on this report : Request Sample Pages
The wood coatings segment accounted for the largest share of the market in 2019. Rapid development in the furniture sector and high demand are projected to complement the growth in the segment over the predicted years.
[REGIONGRAPH]
Get more information on this report : Request Sample Pages
Region-wise, th Asia-Pacific held the largest share of the nitrocellulose market in 2020, due to increased automotive production in the region. Automotive paints based on nitrocellulose improve the aesthetic appearance while also protecting against cracks, UV rays, rust, oxidation, and acid rain. The nitrocellulose market in the Asia-Pacific region is primarily driven by the booming automotive and construction industries, particularly in countries like China, India, and Southeast Asian nations. Nitrocellulose is widely used in automotive paints and coatings due to its fast-drying properties and durability, which are essential for achieving high-quality finishes on vehicles. As the demand for automobiles rises in these emerging economies, driven by rapid urbanization, increased disposable income, and population growth, the need for nitrocellulose-based products in automotive applications continues to surge. In addition, expansion of the construction sector, fueled by infrastructure development and housing demand, creates a strong market for wood coatings and furniture finishes, further increasing the demand for nitrocellulose.
Another major driver in the Asia-Pacific region is the growing packaging and printing industry, driven by rise in e-commerce, food packaging, and textile printing. Nitrocellulose-based inks, known for their quick drying time and excellent adhesion properties, are increasingly preferred in these sectors. With the rapid expansion of the e-commerce sector and rise in demand for packaged food products, especially in populous countries like China and India, the need for high-performance inks is on the rise. In addition, textile printing, a key industry in the region, is increasingly adopting nitrocellulose-based inks for efficient, high-quality printing. The combination of industrial growth, consumer trends, and the increasing focus on sustainable packaging materials continue to drive the demand for nitrocellulose in the Asia-Pacific region.
The major players operating in the global nitrocellulose market include EURENCO, GRN Cellulose Pvt. Ltd., Hagedorn NC, Hengshui Orient Chemical Co., Ltd., Nitrex Chemicals India Pvt. Ltd., Nitrocellulose Group, Nitro Quimica, North Sichuan Nitrocellulose Corporation, Synthesia a.s., and TNC Industrial Co. Ltd.
The nitrocellulose market is experiencing several notable trends, shaped by evolving industrial demands and regulatory frameworks. One prominent trend is the growing demand for sustainable and eco-friendly products. Nitrocellulose, being derived from natural cellulose, is increasingly seen as a green alternative to synthetic materials in industries such as coatings, inks, and explosives. Government regulations focused on reducing volatile organic compounds (VOCs) and hazardous air pollutants (HAPs) in manufacturing processes are pushing industries to adopt cleaner technologies. For example, the U.S. Environmental Protection Agency (EPA) and the European Union's REACH regulations have placed stringent limits on VOC emissions, prompting a shift toward nitrocellulose-based products, which produce fewer harmful emissions compared to other chemicals. This regulatory shift is fostering innovation in the development of low-VOC and water-based nitrocellulose formulations.
Another key trend is the growth of the automotive and construction industries, which are significant consumers of nitrocellulose-based coatings and finishes. According to data from the Indian Ministry of Commerce and Industry, the country’s automotive sector has been expanding at a rate of 8-10% annually, driving the demand for high-performance coatings. Similarly, China's National Bureau of Statistics reported a 7% year-on-year growth in the construction sector in 2023, which boosts the market for wood coatings and adhesives made from nitrocellulose. These industries prefer nitrocellulose due to its fast-drying properties, superior adhesion, and glossy finishes, which are essential for both aesthetic and functional purposes. As infrastructure development continues to rise, particularly in emerging markets, the demand for nitrocellulose-based products is expected to grow steadily.
In addition, the packaging and printing industries are adopting nitrocellulose-based inks owing to rise in demand for high-quality and sustainable packaging solutions. Governments in countries such as Germany and Japan are promoting the use of sustainable packaging materials through subsidies and regulations aimed at reducing plastic waste. According to Eurostat, sustainable packaging initiatives in Europe are expected to increase the adoption of eco-friendly inks, including those based on nitrocellulose, by 12% in the next five years. Similarly, China's National Development and Reform Commission (NDRC) has announced a plan to cut down single-use plastics, pushing the packaging industry to adopt more sustainable materials, further driving the demand for nitrocellulose-based solutions in printing and packaging applications. These trends, supported by government statistics and policies, continue to shape the future growth of the nitrocellulose market globally.
Key Market Segments
Key Market Players
CHAPTER 1:INTRODUCTION
1.1.Report description
1.2.Key benefits for stakeholders
1.3.Key market segments
1.4.Research methodology
1.4.1.Secondary research
1.4.2.Primary research
1.5.Analyst tools and models
CHAPTER 2:EXECUTIVE SUMMARY
2.1.Key findings of the study
2.2.CXO perspective
CHAPTER 3:MARKET OVERVIEW
3.1.Market definition and scope
3.2.Key findings
3.2.1.Top investment pockets
3.3.Porter’s five forces analysis
3.4.Market dynamics
3.4.1.Drivers
3.4.1.1.Wide applications of nitrocellulose
3.4.1.2.Increase in E-Commerce platform
3.4.2.Restraint
3.4.2.1.Health hazard issues of nitrocellulose
3.4.3.Opportunity
3.4.3.1.Rise in popularity of electric vehicles
3.5.Patent analysis, 2015–2020
3.5.1.Patent analysis, by country
3.6.Impact of government rules & regulations
3.7.Impact of COVID-19 outbreak on the global nitrocellulose market
3.8.Pricing analysis
CHAPTER 4:NITROCELLULOSE MARKET, BY PRODUCT
4.1.Overview
4.1.1.Market size and forecast
4.2.M grade cellulose
4.2.1.Key market trends, growth factors, and opportunities
4.2.2.Market size and forecast, by region
4.2.3.Market share analysis, by country
4.3.E grade Cellulose
4.3.1.Key market trends, growth factors, and opportunities
4.3.2.Market size and forecast, by region
4.3.3.Market share analysis, by country
4.4.Others
4.4.1.Key market trends, growth factors, and opportunities
4.4.2.Market size and forecast, by region
4.4.3.Market share analysis, by country
CHAPTER 5:NITROCELLULOSE MARKET, BY APPLICATION
5.1.Overview
5.1.1.Market size and forecast
5.2.Printing inks
5.2.1.Key market trends, growth factors, and opportunities
5.2.2.Market size and forecast, by region
5.2.3.Market share analysis, by country
5.3.Automotive paints
5.3.1.Key market trends, growth factors, and opportunities
5.3.2.Market size and forecast, by region
5.3.3.Market share analysis, by country
5.4.Wood coatings
5.4.1.Key market trends, growth factors, and opportunities
5.4.2.Market size and forecast, by region
5.4.3.Market share analysis, by country
5.5.Leather finishes
5.5.1.Key market trends, growth factors, and opportunities
5.5.2.Market size and forecast, by region
5.5.3.Market share analysis, by country
5.6.Nail varnishes
5.6.1.Key market trends, growth factors, and opportunities
5.6.2.Market size and forecast, by region
5.6.3.Market share analysis, by country
5.7.Others
5.7.1.Key market trends, growth factors, and opportunities
5.7.2.Market size and forecast, by region
5.7.3.Market share analysis, by country
CHAPTER 6:NITROCELLULOSE MARKET, BY REGION
6.1.Overview
6.1.1.Market size and forecast, by region
6.2.North America
6.2.1.Key market trends, growth factors, and opportunities
6.2.2.Market size and forecast, by product
6.2.3.Market size and forecast, by application
6.2.4.Market size and forecast by country
6.2.5.U.S.
6.2.5.1.Market size and forecast, by product
6.2.5.2.Market size and forecast, by application
6.2.6.Canada
6.2.6.1.Market size and forecast, by product
6.2.6.2.Market size and forecast, by application
6.2.7.Mexico
6.2.7.1.Market size and forecast, by product
6.2.7.2.Market size and forecast, by application
6.3.Europe
6.3.1.Key market trends, growth factors, and opportunities
6.3.2.Market size and forecast, by product
6.3.3.Market size and forecast, by application
6.3.4.Market size and forecast, by country
6.3.5.Germany
6.3.5.1.Market size and forecast, by product
6.3.5.2.Market size and forecast, by application
6.3.6.UK
6.3.6.1.Market size and forecast, by product
6.3.6.2.Market size and forecast, by application
6.3.7.Spain
6.3.7.1.Market size and forecast, by product
6.3.7.2.Market size and forecast, by application
6.3.8.France
6.3.8.1.Market size and forecast, by product
6.3.8.2.Market size and forecast, by application
6.3.9.Italy
6.3.9.1.Market size and forecast, by product
6.3.9.2.Market size and forecast, by application
6.3.10.Rest of Europe
6.3.10.1.Market size and forecast, by product
6.3.10.2.Market size and forecast, by application
6.4.Asia-Pacific
6.4.1.Key market trends, growth factors, and opportunities
6.4.2.Market size and forecast, by product
6.4.3.Market size and forecast, by application
6.4.4.Market size and forecast, by country
6.4.5.China
6.4.5.1.Market size and forecast, by product
6.4.5.2.Market size and forecast, by application
6.4.6.Japan
6.4.6.1.Market size and forecast, by product
6.4.6.2.Market size and forecast, by application
6.4.7.India
6.4.7.1.Market size and forecast, by product
6.4.7.2.Market size and forecast, by application
6.4.8.South Korea
6.4.8.1.Market size and forecast, by product
6.4.8.2.Market size and forecast, by application
6.4.9.Australia
6.4.9.1.Market size and forecast, by product
6.4.9.2.Market size and forecast, by application
6.4.10.Rest of Asia-Pacific
6.4.10.1.Market size and forecast, by product
6.4.10.2.Market size and forecast, by application
6.5.LAMEA
6.5.1.Key market trends, growth factors, and opportunities
6.5.2.Market size and forecast, by product
6.5.3.Market size and forecast, by application
6.5.4.Market size and forecast, by country
6.5.5.Brazil
6.5.5.1.Market size and forecast, by product
6.5.5.2.Market size and forecast, by application
6.5.6.Saudi Arabia
6.5.6.1.Market size and forecast, by product
6.5.6.2.Market size and forecast, by application
6.5.7.South Africa
6.5.7.1.Market size and forecast, by product
6.5.7.2.Market size and forecast, by application
6.5.8.Rest of LAMEA
6.5.8.1.Market size and forecast, by product
6.5.8.2.Market size and forecast, by application
CHAPTER 7:COMPETITIVE LANDSCAPE
7.1.INTRODUCTION
7.1.1.MARKET PLAYER POSITIONING, 2019
7.2.TOP WINNING STRATEGIES
7.2.1.Top winning strategies, by year
7.2.2.Top winning strategies, by development
7.2.3.Top winning strategies, by company
7.3.PRODUCT MAPPING OF TOP 10 PLAYER
7.4.COMPETITIVE HEATMAP
7.5.KEY DEVELOPMENTS
7.5.1.New product launches
7.5.2.Partnership
CHAPTER 8:COMPANY PROFILES:
8.1.EURENCO
8.1.1.Company overview
8.1.2.Company snapshot
8.1.3.Product portfolio
8.1.4.Key strategic moves and developments
8.2.GRN Cellulose Pvt. Ltd.
8.2.1.Company overview
8.2.2.Company snapshot
8.2.3.Product portfolio
8.3.Hagedorn NC
8.3.1.Company overview
8.3.2.Company snapshot
8.3.3.Product Portfolio
8.4.Hengshui Orient Chemical Co., Ltd.
8.4.1.Company overview
8.4.2.Company snapshot
8.4.3.Product portfolio
8.5.Nitrex Chemicals India Pvt. Ltd.
8.5.1.Company overview
8.5.2.Company snapshot
8.5.3.Product portfolio
8.6.Nitrocellulose Group
8.6.1.Company overview
8.6.2.Company snapshot
8.6.3.Product portfolio
8.7.Nitro Quimica
8.7.1.Company overview
8.7.2.Company snapshot
8.7.3.Operating business segments
8.7.4.Product portfolio
8.7.5.Business performance
8.7.6.Key strategic moves and developments
8.8.North Sichuan Nitrocellulose Corporation
8.8.1.Company overview
8.8.2.Company snapshot
8.8.3.Product portfolio
8.9.Synthesia a.s.
8.9.1.Company overview
8.9.2.Company Snapshot
8.9.3.Product portfolio
8.10.TNC Industrial Co. Ltd.
8.10.1.Company overview
8.10.2.Company snapshot
8.10.3.Product portfolio
LIST OF TABLES
TABLE 01.NITROCELLULOSE PRICING FORECAST BY PRODUCT,2019–2027 ($/KG)
TABLE 02.NITROCELLULOSE PRICING FORECAST BY REGION,2019–2027 ($/KG)
TABLE 03.GLOBAL NITROCELLULOSE MARKET, BY PRODUCT, 2019–2027 (KILOTON)
TABLE 04.GLOBAL NITROCELLULOSE MARKET, BY PRODUCT, 2019–2027 ($MILLION)
TABLE 05.M GRADE CELLULOSE MARKET, BY REGION, 2019–2027 (KILOTON)
TABLE 06.M GRADE CELLULOSE MARKET, BY REGION, 2019–2027 ($MILLION)
TABLE 07.E GRADE CELLULOSE MARKET, BY REGION, 2019–2027 (KILOTON)
TABLE 08.E GRADE CELLULOSE MARKET, BY REGION, 2019–2027 ($MILLION)
TABLE 09.NITROCELLULOSE MARKET FOR OTHERS, BY REGION, 2019–2027 (KILOTON)
TABLE 10.NITROCELLULOSE MARKET FOR OTHERS, BY REGION, 2019–2027 ($MILLION)
TABLE 11.GLOBAL NITROCELLULOSE MARKET, BY APPLICATION, 2019–2027 (KILOTON)
TABLE 12.GLOBAL NITROCELLULOSE MARKET, BY APPLICATION, 2019–2027 ($MILLION)
TABLE 13.GLOBAL NITROCELLULOSE MARKET FOR PRINTING INKS, BY REGION, 2019–2027 (KILOTON)
TABLE 14.GLOBAL NITROCELLULOSE MARKET FOR PRINTING INKS, BY REGION, 2019–2027 ($MILLION)
TABLE 15.NITROCELLULOSE MARKET FOR AUTOMOTIVE PAINTS, BY REGION, 2019–2027 (KILOTON)
TABLE 16.NITROCELLULOSE MARKET FOR AUTOMOTIVE PAINTS, BY REGION, 2019–2027 ($MILLION)
TABLE 17.NITROCELLULOSE MARKET FOR WOOD COATINGS, BY REGION, 2019–2027 (KILOTON)
TABLE 18.NITROCELLULOSE MARKET FOR WOOD COATINGS, BY REGION, 2019–2027 ($MILLION)
TABLE 19.NITROCELLULOSE MARKET FOR LEATHER FINISHES, BY REGION, 2019–2027 (KILOTON)
TABLE 20.NITROCELLULOSE MARKET FOR LEATHER FINISHES, BY REGION, 2019–2027 ($MILLION)
TABLE 21.GLOBAL NITROCELLULOSE MARKET FOR NAIL VARNISHES, BY REGION, 2019–2027 (KILOTON)
TABLE 22.GLOBAL NITROCELLULOSE MARKET FOR NAIL VARNISHES, BY REGION, 2019–2027 ($MILLION)
TABLE 23.GLOBAL NITROCELLULOSE MARKET FOR OTHERS, BY REGION, 2019–2027 (KILOTON)
TABLE 24.GLOBAL NITROCELLULOSE MARKET FOR OTHERS, BY REGION, 2019–2027 ($MILLION)
TABLE 25.GLOBAL NITROCELLULOSE MARKET, BY REGION 2019–2027 (KILOTON)
TABLE 26.GLOBAL NITROCELLULOSE MARKET, BY REGION, 2019–2027 ($MILLION)
TABLE 27.NORTH AMERICA NITROCELLULOSE MARKET, BY PRODUCT, 2019–2027 (KILOTON)
TABLE 28.NORTH AMERICA NITROCELLULOSE MARKET, BY PRODUCT, 2019–2027 ($MILLION)
TABLE 29.NORTH AMERICA NITROCELLULOSE MARKET, BY APPLICATION, 2019–2027 (KILOTON)
TABLE 30.NORTH AMERICA NITROCELLULOSE MARKET, BY APPLICATION, 2019–2027 ($MILLION)
TABLE 31.NORTH AMERICA NITROCELLULOSE MARKET, BY COUNTRY 2019–2027 (KILOTON)
TABLE 32.NORTH AMERICA NITROCELLULOSE MARKET, BY COUNTRY 2019–2027 ($MILLION)
TABLE 33.U.S. NITROCELLULOSE MARKET, BY PRODUCT, 2019–2027 (KILOTON)
TABLE 34.U.S. NITROCELLULOSE MARKET, BY PRODUCT, 2019–2027 ($MILLION)
TABLE 35.U.S. NITROCELLULOSE MARKET, BY APPLICATION, 2019–2027 (KILOTON)
TABLE 36.U.S. NITROCELLULOSE MARKET, BY APPLICATION, 2019–2027 ($MILLION)
TABLE 37.CANADA NITROCELLULOSE MARKET, BY PRODUCT, 2019–2027 (KILOTON)
TABLE 38.CANADA NITROCELLULOSE MARKET, BY PRODUCT, 2019–2027 ($MILLION)
TABLE 39.CANADA NITROCELLULOSE MARKET, BY APPLICATION, 2019–2027 (KILOTON)
TABLE 40.CANADA NITROCELLULOSE MARKET, BY APPLICATION, 2019–2027 ($MILLION)
TABLE 41.MEXICO NITROCELLULOSE MARKET, BY PRODUCT, 2019–2027 (KILOTON)
TABLE 42.MEXICO NITROCELLULOSE MARKET, BY PRODUCT, 2019–2027 ($MILLION)
TABLE 43.MEXICO NITROCELLULOSE MARKET, BY APPLICATION, 2019–2027 (KILOTON)
TABLE 44.MEXICO NITROCELLULOSE MARKET, BY APPLICATION, 2019–2027 ($MILLION)
TABLE 45.EUROPE NITROCELLULOSE MARKET, BY PRODUCT, 2019–2027 (KILOTON)
TABLE 46.EUROPE NITROCELLULOSE MARKET, BY PRODUCT, 2019–2027 ($MILLION)
TABLE 47.EUROPE NITROCELLULOSE MARKET, BY APPLICATION, 2019–2027 (KILOTON)
TABLE 48.EUROPE NITROCELLULOSE MARKET, BY APPLICATION, 2019–2027 ($MILLION)
TABLE 49.EUROPE NITROCELLULOSE MARKET, BY COUNTRY 2019–2027 (KILOTON)
TABLE 50.EUROPE NITROCELLULOSE MARKET, BY COUNTRY 2019–2027 ($MILLION)
TABLE 51.GERMANY NITROCELLULOSE MARKET, BY PRODUCT, 2019–2027 (KILOTON)
TABLE 52.GERMANY NITROCELLULOSE MARKET, BY PRODUCT, 2019–2027 ($MILLION)
TABLE 53.GERMANY NITROCELLULOSE MARKET, BY APPLICATION, 2019–2027 (KILOTON)
TABLE 54.GERMANY NITROCELLULOSE MARKET, BY APPLICATION, 2019–2027 ($MILLION)
TABLE 55.UK NITROCELLULOSE MARKET, BY PRODUCT, 2019–2027 (KILOTON)
TABLE 56.UK NITROCELLULOSE MARKET, BY PRODUCT, 2019–2027 ($MILLION)
TABLE 57.UK NITROCELLULOSE MARKET, BY APPLICATION, 2019–2027 (KILOTON)
TABLE 58.UK NITROCELLULOSE MARKET, BY APPLICATION, 2019–2027 ($MILLION)
TABLE 59.SPAIN NITROCELLULOSE MARKET, BY PRODUCT, 2019–2027 (KILOTON)
TABLE 60.SPAIN NITROCELLULOSE MARKET, BY PRODUCT, 2019–2027 ($MILLION)
TABLE 61.SPAIN NITROCELLULOSE MARKET, BY APPLICATION, 2019–2027 (KILOTON)
TABLE 62.SPAIN NITROCELLULOSE MARKET, BY APPLICATION, 2019–2027 ($MILLION)
TABLE 63.FRANCE NITROCELLULOSE MARKET, BY PRODUCT, 2019–2027 (KILOTON)
TABLE 64.FRANCE NITROCELLULOSE MARKET, BY PRODUCT, 2019–2027 ($MILLION)
TABLE 65.FRANCE NITROCELLULOSE MARKET, BY APPLICATION, 2019–2027 (KILOTON)
TABLE 66.FRANCE NITROCELLULOSE MARKET, BY APPLICATION, 2019–2027 ($MILLION)
TABLE 67.ITALY NITROCELLULOSE MARKET, BY PRODUCT, 2019–2027 (KILOTON)
TABLE 68.ITALY NITROCELLULOSE MARKET, BY PRODUCT, 2019–2027 ($MILLION)
TABLE 69.ITALY NITROCELLULOSE MARKET, BY APPLICATION, 2019–2027 (KILOTON)
TABLE 70.ITALY NITROCELLULOSE MARKET, BY APPLICATION, 2019–2027 ($MILLION)
TABLE 71.REST OF EUROPE NITROCELLULOSE MARKET, BY PRODUCT, 2019–2027 (KILOTON)
TABLE 72.REST OF EUROPE NITROCELLULOSE MARKET, BY PRODUCT, 2019–2027 ($MILLION)
TABLE 73.REST OF EUROPE NITROCELLULOSE MARKET, BY APPLICATION, 2019–2027 (KILOTON)
TABLE 74.REST OF EUROPE NITROCELLULOSE MARKET, BY APPLICATION, 2019–2027 ($MILLION)
TABLE 75.ASIA-PACIFIC NITROCELLULOSE MARKET, BY PRODUCT, 2019–2027 (KILOTON)
TABLE 76.ASIA-PACIFIC NITROCELLULOSE MARKET, BY PRODUCT, 2019–2027 ($MILLION)
TABLE 77.ASIA-PACIFIC NITROCELLULOSE MARKET, BY APPLICATION, 2019–2027 (KILOTON)
TABLE 78.ASIA-PACIFIC NITROCELLULOSE MARKET, BY APPLICATION, 2019–2027 ($MILLION)
TABLE 79.ASIA-PACIFIC NITROCELLULOSE MARKET, BY COUNTRY 2019–2027 (KILOTON)
TABLE 80.ASIA-PACIFIC NITROCELLULOSE MARKET, BY COUNTRY 2019–2027 ($MILLION)
TABLE 81.CHINA NITROCELLULOSE MARKET, BY PRODUCT, 2019–2027 (KILOTON)
TABLE 82.CHINA NITROCELLULOSE MARKET, BY PRODUCT, 2019–2027 ($MILLION)
TABLE 83.CHINA NITROCELLULOSE MARKET, BY APPLICATION, 2019–2027 (KILOTON)
TABLE 84.CHINA NITROCELLULOSE MARKET, BY APPLICATION, 2019–2027 ($MILLION)
TABLE 85.JAPAN NITROCELLULOSE MARKET, BY PRODUCT, 2019–2027 (KILOTON)
TABLE 86.JAPAN NITROCELLULOSE MARKET, BY PRODUCT, 2019–2027 ($MILLION)
TABLE 87.JAPAN NITROCELLULOSE MARKET, BY APPLICATION, 2019–2027 (KILOTON)
TABLE 88.JAPAN NITROCELLULOSE MARKET, BY APPLICATION, 2019–2027 ($MILLION)
TABLE 89.INDIA NITROCELLULOSE MARKET, BY PRODUCT, 2019–2027 (KILOTON)
TABLE 90.INDIA NITROCELLULOSE MARKET, BY PRODUCT, 2019–2027 ($MILLION)
TABLE 91.INDIA NITROCELLULOSE MARKET, BY APPLICATION, 2019–2027 (KILOTON)
TABLE 92.INDIA NITROCELLULOSE MARKET, BY APPLICATION, 2019–2027 ($MILLION)
TABLE 93.SOUTH KOREA NITROCELLULOSE MARKET, BY PRODUCT, 2019–2027 (KILOTON)
TABLE 94.SOUTH KOREA NITROCELLULOSE MARKET, BY PRODUCT, 2019–2027 ($MILLION)
TABLE 95.SOUTH KOREA NITROCELLULOSE MARKET, BY APPLICATION, 2019–2027 (KILOTON)
TABLE 96.SOUTH KOREA NITROCELLULOSE MARKET, BY APPLICATION, 2019–2027 ($MILLION)
TABLE 97.AUSTRALIA NITROCELLULOSE MARKET, BY PRODUCT, 2019–2027 (KILOTON)
TABLE 98.AUSTRALIA NITROCELLULOSE MARKET, BY PRODUCT, 2019–2027 ($MILLION)
TABLE 99.AUSTRALIA NITROCELLULOSE MARKET, BY APPLICATION, 2019–2027 (KILOTON)
TABLE 100.AUSTRALIA NITROCELLULOSE MARKET, BY APPLICATION, 2019–2027 ($MILLION)
TABLE 101.REST OF ASIA-PACIFIC NITROCELLULOSE MARKET, BY PRODUCT, 2019–2027 (KILOTON)
TABLE 102.REST OF ASIA-PACIFIC NITROCELLULOSE MARKET, BY PRODUCT, 2019–2027 ($MILLION)
TABLE 103.REST OF ASIA-PACIFIC NITROCELLULOSE MARKET, BY APPLICATION, 2019–2027 (KILOTON)
TABLE 104.REST OF ASIA-PACIFIC NITROCELLULOSE MARKET, BY APPLICATION, 2019–2027 ($MILLION)
TABLE 105.LAMEA NITROCELLULOSE MARKET, BY PRODUCT, 2019–2027 (KILOTON)
TABLE 106.LAMEA NITROCELLULOSE MARKET, BY PRODUCT, 2019–2027 ($MILLION)
TABLE 107.LAMEA NITROCELLULOSE MARKET, BY APPLICATION, 2019–2027 (KILOTON)
TABLE 108.LAMEA NITROCELLULOSE MARKET, BY APPLICATION, 2019–2027 ($MILLION)
TABLE 109.LAMEA NITROCELLULOSE MARKET, BY COUNTRY 2019–2027 (KILOTON)
TABLE 110.LAMEA NITROCELLULOSE MARKET, BY COUNTRY 2019–2027 ($MILLION)
TABLE 111.BRAZIL NITROCELLULOSE MARKET, BY PRODUCT, 2019–2027 (KILOTON)
TABLE 112.BRAZIL NITROCELLULOSE MARKET, BY PRODUCT, 2019–2027 ($MILLION)
TABLE 113.BRAZIL NITROCELLULOSE MARKET, BY APPLICATION, 2019–2027 (KILOTON)
TABLE 114.BRAZIL NITROCELLULOSE MARKET, BY APPLICATION, 2019–2027 ($MILLION)
TABLE 115.SAUDI ARABIA NITROCELLULOSE MARKET, BY PRODUCT, 2019–2027 (KILOTON)
TABLE 116.SAUDI ARABIA NITROCELLULOSE MARKET, BY PRODUCT, 2019–2027 ($MILLION)
TABLE 117.SAUDI ARABIA NITROCELLULOSE MARKET, BY APPLICATION, 2019–2027 (KILOTON)
TABLE 118.SAUDI ARABIA NITROCELLULOSE MARKET, BY APPLICATION, 2019–2027 ($MILLION)
TABLE 119.SOUTH AFRICA NITROCELLULOSE MARKET, BY PRODUCT, 2019–2027 (KILOTON)
TABLE 120.SOUTH AFRICA NITROCELLULOSE MARKET, BY PRODUCT, 2019–2027 ($MILLION)
TABLE 121.SOUTH AFRICA NITROCELLULOSE MARKET, BY APPLICATION, 2019–2027 (KILOTON)
TABLE 122.SOUTH AFRICA NITROCELLULOSE MARKET, BY APPLICATION, 2019–2027 ($MILLION)
TABLE 123.REST OF LAMEA NITROCELLULOSE MARKET, BY PRODUCT, 2019–2027 (KILOTON)
TABLE 124.REST OF LAMEA NITROCELLULOSE MARKET, BY PRODUCT, 2019–2027 ($MILLION)
TABLE 125.REST OF LAMEA NITROCELLULOSE MARKET, BY APPLICATION, 2019–2027 (KILOTON)
TABLE 126.REST OF LAMEA NITROCELLULOSE MARKET, BY APPLICATION, 2019–2027 ($MILLION)
TABLE 127.KEY NEW PRODUCT LAUNCHES (2017-2018)
TABLE 128.KEY PARTNERSHIP (2017-2018)
TABLE 129.EURENCO: COMPANY SNAPSHOT
TABLE 130.EURENCO: PRODUCT PORTFOLIO
TABLE 131.EURENCO: KEY STRATEGIC MOVES AND DEVELOPMENTS
TABLE 132.GRN CELLULOSE PVT. LTD.: COMPANY SNAPSHOT
TABLE 133.GRN CELLULOSE PVT. LTD.: PRODUCT PORTFOLIO
TABLE 134.HAGEDORN NC: COMPANY SNAPSHOT
TABLE 135.HAGEDORN NC: PRODUCT PORTFOLIO
TABLE 136.HENGSHUI ORIENT CHEMICAL CO., LTD.: COMPANY SNAPSHOT
TABLE 137.HENGSHUI ORIENT CHEMICAL CO., LTD.: PRODUCT PORTFOLIO
TABLE 138.NITREX CHEMICALS INDIA PVT. LTD.: COMPANY SNAPSHOT
TABLE 139.NITREX CHEMICALS INDIA PVT. LTD.: PRODUCT PORTFOLIO
TABLE 140.NITROCELLULOSE GROUP: COMPANY SNAPSHOT
TABLE 141.NITROCELLULOSE GROUP: PRODUCT PORTFOLIO
TABLE 142.NITRO QUIMICA: COMPANY SNAPSHOT
TABLE 143.NITRO QUIMICA: OPERATING SEGMENTS
TABLE 144.NITRO QUIMICA: PRODUCT PORTFOLIO
TABLE 145.OVERALL FINANCIAL STATUS ($MILLION)
TABLE 146.NITRO QUIMICA: KEY STRATEGIC MOVES AND DEVELOPMENTS
TABLE 147.NORTH SICHUAN NITROCELLULOSE CORPORATION: COMPANY SNAPSHOT
TABLE 148.NORTH SICHUAN NITROCELLULOSE CORPORATION: PRODUCT PORTFOLIO
TABLE 149.SYNTHESIA A.S.: COMPANY SNAPSHOT
TABLE 150.SYNTHESIA A.S.: PRODUCT PORTFOLIO
TABLE 151.TNC INDUSTRIAL CO. LTD.: COMPANY SNAPSHOT
TABLE 152.TNC INDUSTRIAL CO. LTD.: PRODUCT PORTFOLIO
LIST OF FIGURES
FIGURE 01.GLOBAL NITROCELLULOSE MARKET SEGMENTATION
FIGURE 02.TOP INVESTMENT POCKETS, BY PRODUCT (2019)
FIGURE 03.MODERATE BARGAINING POWER OF SUPPLIERS
FIGURE 04.LOW BARGAINING POWER OF BUYERS
FIGURE 05.LOW THREAT OF NEW ENTRANTS
FIGURE 06.LOW THREAT OF SUBSTITUTES
FIGURE 07.HIGH INTENSITY OF COMPETITIVE RIVALRY
FIGURE 08.NITROCELLULOSE MARKET DYNAMICS
FIGURE 09.PATENT ANALYSIS, BY COUNTRY
FIGURE 10.GLOBAL NITROCELLULOSE MARKET REVENUE, BY PRODUCT, 2019–2027 ($MILLION)
FIGURE 11.COMPARATIVE ANALYSIS OF M GRADE CELLULOSE MARKET, BY COUNTRY, 2019 & 2027 ($MILLION)
FIGURE 12.COMPARATIVE ANALYSIS OF E GRADE CELLULOSE MARKET, BY COUNTRY, 2019 & 2027 ($MILLION)
FIGURE 13.COMPARATIVE ANALYSIS OF NITROCELLULOSE MARKET FOR OTHERS, BY COUNTRY, 2019 & 2027 ($MILLION)
FIGURE 14.GLOBAL NITROCELLULOSE MARKET REVENUE, BY APPLICATION, 2019–2027 ($MILLION)
FIGURE 15.COMPARATIVE ANALYSIS OF NITROCELLULOSE MARKET FOR PRINTING INKS, BY COUNTRY, 2019 & 2027 ($MILLION)
FIGURE 16.COMPARATIVE ANALYSIS OF NITROCELLULOSE MARKET FOR AUTOMOTIVE PAINTS, BY COUNTRY, 2019 & 2027 ($MILLION)
FIGURE 17.COMPARATIVE ANALYSIS OF NITROCELLULOSE MARKET FOR WOOD COATINGS, BY COUNTRY, 2019 & 2027 ($MILLION)
FIGURE 18.COMPARATIVE ANALYSIS OF NITROCELLULOSE MARKET FOR LEATHER FINISHES, BY COUNTRY, 2019 & 2027 ($MILLION)
FIGURE 19.COMPARATIVE ANALYSIS OF NITROCELLULOSE MARKET FOR NAIL VARNISHES, BY COUNTRY, 2019 & 2027 ($MILLION)
FIGURE 20.COMPARATIVE ANALYSIS OF NITROCELLULOSE MARKET FOR OTHERS, BY COUNTRY, 2019 & 2027 ($MILLION)
FIGURE 21.U.S. REVENUE FOR NITROCELLULOSE 2019–2027 ($MILLION)
FIGURE 22.CANADA REVENUE FOR NITROCELLULOSE, 2019- 2027 ($MILLION)
FIGURE 23.MEXICO REVENUE FOR NITROCELLULOSE, 2019- 2027 ($MILLION)
FIGURE 24.GERMANY REVENUE FOR NITROCELLULOSE, 2019- 2027 ($MILLION)
FIGURE 25.UK REVENUE FOR NITROCELLULOSE, 2019- 2027 ($MILLION)
FIGURE 26.SPAIN REVENUE FOR NITROCELLULOSE, 2019- 2027 ($MILLION)
FIGURE 27.FRANCE REVENUE FOR NITROCELLULOSE, 2019- 2027 ($MILLION)
FIGURE 28.ITALY REVENUE FOR NITROCELLULOSE, 2019- 2027 ($MILLION)
FIGURE 29.REST OF EUROPE REVENUE FOR NITROCELLULOSE, 2019- 2027 ($MILLION)
FIGURE 30.CHINA REVENUE FOR NITROCELLULOSE, 2019- 2027 ($MILLION)
FIGURE 31.JAPAN REVENUE FOR NITROCELLULOSE, 2019- 2027 ($MILLION)
FIGURE 32.INDIA REVENUE FOR NITROCELLULOSE, 2019- 2027 ($MILLION)
FIGURE 33.SOUTH KOREA REVENUE FOR NITROCELLULOSE, 2019- 2027 ($MILLION)
FIGURE 34.AUSTRALIA REVENUE FOR NITROCELLULOSE, 2019- 2027 ($MILLION)
FIGURE 35.REST OF ASIA-PACIFIC REVENUE FOR NITROCELLULOSE, 2019- 2027 ($MILLION)
FIGURE 36.BRAZIL REVENUE FOR NITROCELLULOSE, 2019- 2027 ($MILLION)
FIGURE 37.SAUDI ARABIA REVENUE FOR NITROCELLULOSE, 2019- 2027 ($MILLION)
FIGURE 38.SOUTH AFRICA REVENUE FOR NITROCELLULOSE, 2019- 2027 ($MILLION)
FIGURE 39.REST OF LAMEA REVENUE FOR NITROCELLULOSE 2019–2027 ($MILLION)
FIGURE 40.MARKET PLAYER POSITIONING, 2019
FIGURE 41.TOP WINNING STRATEGIES, BY YEAR, 2017–2018
FIGURE 42.TOP WINNING STRATEGIES, BY DEVELOPMENT, 2017–2018 (%)
FIGURE 43.TOP WINNING STRATEGIES, BY COMPANY, 2017–2018
FIGURE 44.PRODUCT MAPPING OF TOP 10 PLAYERS
FIGURE 45.COMPETITIVE HEATMAP OF KEY PLAYERS
FIGURE 46.NITRO QUIMICA: REVENUE, 2017–2019 ($MILLION)
FIGURE 47.NITRO QUIMICA: REVENUE SHARE, BY SEGMENT, 2019 (%)