Int'l : +1-503-894-6022 | Toll Free : +1-800-792-5285 | help@alliedmarketresearch.com
A06401 | Pages: 225 | Charts: 36 | Tables: 84 |
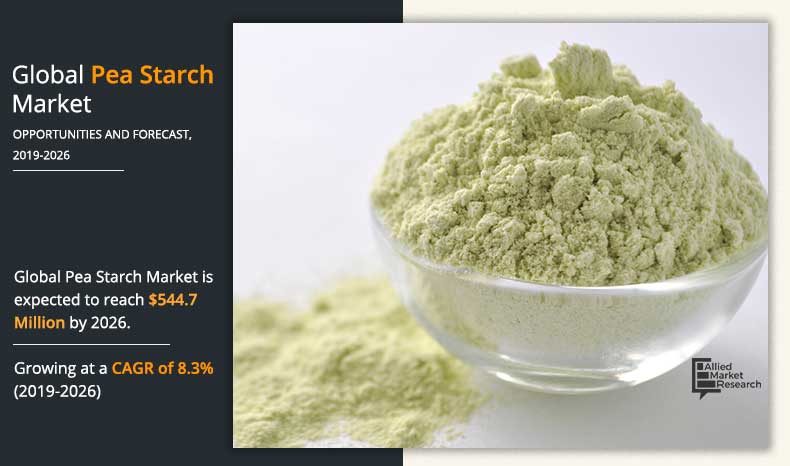
The pea starch market was valued at $292.9 million in 2018, and is projected to reach $544.7 million by 2026, growing at a CAGR of 8.3% from 2019 to 2026. North America is one of the prominent regions in the market that solely accounted for approximately 42.1% of the total pea starch market share in 2018.
Pea starch is majorly derived from yellow peas, and is subsequently processed differently from pea flour, which is the common ingredient derived from pea. Peas contain around 40% starch, and is a white powder that is neutral in color and taste. Pea starch can be differentiated from other native starches with the high amylose content present in the pea starch granules. Thus, pea starch possesses strong gelling property, which aids in the formation of gel in water at a much lower dosage than other starches, making it an ideal gelling native starch. Pea starch is thus considered as a key ingredient for food products, which require short, elastic texture such as glass noodles or gummy confectionaries. For meat products, pea starch helps in improving texture for poultry rolls and vegetarian products.
Get more information on this report : Request Sample Pages
The demand of pea starch as a stabilizing and gelling agent is a key factor that is driving the growth of the global pea starch market. Furthermore, it is free from gluten and lactose, and is considered as an alternative to carbohydrate sources such as potato, while peas, and cereal starches.
Consumers who are intolerant to lactose prefer products that have pea starch as their major ingredient, as it is easy to digest as compared to the products that have lactose. Hence, increase has been witnessed in the demand for pea starch products among individuals suffering from lactose intolerance. In addition, changes in consumption pattern among consumers contribute toward the growth of the market. For instance, consumption of pea starch is expected to increase considerably among health-conscious consumers, as it possesses anti-allergic properties and is low in calories. This factor significantly contributes toward the growth of the global market. Moreover, development of new products with improved taste and benefits, along with high marketing support, boosts the global market growth.
Upsurge in demand for pea starch in industrial applications is expected to drive the growth of the market during the forecast time period. This is attributed to the fact that its gelling, thickening, and texturizing properties make it ideal for use in pharmaceutical and/or nutraceuticals for film forming and coating tablets and capsules. Furthermore, it is majorly used to produce gelatin-free capsules. In addition, the extracts obtained from pea are used as an ingredient in personal care and cosmetic products. This is attributed to the fact that the skin lightening, skin smoothing, and anti-aging properties obtained from pea starch make it an ideal component for products such as creams & lotions and serums. In addition, surge in demand from consumers for organic and natural skincare and hair care products makes it imperative for manufacturers to incorporate ingredients derived from natural sources. This trend drives the demand for pea starch, thereby augmenting the growth of the global market. However, starch retrogradation causes certain undesirable effects in starch-rich foods such as reduced shelf life, which can pose significant challenges to food processors. It particularly affects bakery products by increasing firmness of crumb, changing flavor & aroma, and causing loss of crispiness.
Native starch portrays promising prospects with regard to industrial applications, owing to its biocompatible and environmentally friendly nature as compared to synthetic polymers. Several industries, including food, textile, paper, and petroleum are progressively consuming modified starch. In addition, the developing countries such as China and India are utilizing native starches due to rapid industrial growth in these countries. Furthermore, changes in consumer appetite owing to rise in health, nutritional, and functional needs are anticipated to increase native starch production and consumption. Hence, in the forthcoming years, rise in demand for starch from unexplored areas of industrial applications is expected to significantly augment the global pea starch market growth.
[TYPEGRAPH]
Get more information on this report : Request Sample Pages
The global pea starch market is segmented into type, application, and region. Depending on type, the market is classified into organic/non-GMO and conventional. The applications covered in the study include food & beverages, feed, and others. Region wise, the market for pea starch is studied across North America, Europe, Asia-Pacific, and LAMEA.
[APPLICATIONGRAPH]
Get more information on this report : Request Sample Pages
North America and Europe are known to be the dominant regions in the pea starch market. European countries have witnessed higher rate of traction for pea starches owing to the increased demand from the consumers. Some of the macroeconomic factors such as rise in health awareness and surge in per capita income play an important role in contributing toward the overall growth of the market.
[REGIONGRAPH]
Get more information on this report : Request Sample Pages
The key players in the pea starch industry include Agridient, American Key Food Products, Cosucra Groupe Warconing SA, Emsland Group, Meelunie B.V., Puris Foods, Roquette Frères, Shanghai Bichain Industrial Chemical, the Scoular Company, and Vestkorn Milling AS.
This report provides a quantitative analysis of the current pea starch market trends, estimations, and pea starch market forecast based on the market size from 2019 to 2026 to identify the prevailing pea starch market opportunities.
The key countries in all the major regions are mapped depending on their market share.
Porter’s five forces analysis highlights the potency of buyers and suppliers to enable stakeholders to make profit-oriented business decisions and strengthen their supplier-buyer network.
A comprehensive analysis of factors that drive and restrict the market growth is provided.
An in-depth analysis of the market helps to determine the prevailing market opportunities.
The report includes details of the pea starch market analysis and pea starch market size of the regional and global markets, key players, market segments, application areas, and growth strategies.
Key Market Segments
Key Market Players
CHAPTER 1:INTRODUCTION
1.1.Report Description
1.2.Key Market Segments
1.3.Research Methodology
1.3.1.Primary Research
1.3.2.Secondary Research
1.3.3.Analyst Tools and Models
CHAPTER 2:EXECUTIVE SUMMARY
2.1.Key findings of the study
2.1.1.Top investment pocket
2.2.CXO perspective
CHAPTER 3:MARKET OVERVIEW
3.1.Market definition and scope
3.2.Key forces shaping the global pea starch market
3.2.1.Bargaining power of suppliers
3.2.2.Bargaining power of buyers
3.2.3.Threat of substitution
3.2.4.Threat of new entrants
3.2.5.Intensity of competitive rivalry
3.3.Market dynamics
3.3.1.Drivers
3.3.1.1.Consumers preference for seeking clean label food products sources
3.3.1.2.Growth in demand for industrial applications
3.3.1.3.Rising demand for convenience food
3.3.2.Restraint
3.3.2.1.Retrogradation effect on starch-rich foods
3.3.3.Opportunities
3.3.3.1.Demand for modified starch from developing countries
3.3.3.2.Organic pea starch
CHAPTER 4:GLOBAL PEA STARCH MARKET, BY TYPE
4.1.Overview
4.1.1.Market size and forecast
4.2.Organic/Non-GMO
4.2.1.Key market trends, growth factors, and opportunities
4.2.2.Market size and forecast
4.2.3.Market analysis by country
4.3.Conventional
4.3.1.Key market trends, growth factors, and opportunities
4.3.2.Market size and forecast
4.3.3.Market analysis by country
CHAPTER 5:GLOBAL PEA STARCH MARKET, BY APPLICATION
5.1.Overview
5.1.1.Market size and forecast
5.2.Food and Beverages
5.2.1.Key market trends, growth factors, and opportunities
5.2.2.Market size and forecast
5.2.3.Market analysis by country
5.3.Feed
5.3.1.Key market trends, growth factors, and opportunities
5.3.2.Market size and forecast
5.3.3.Market analysis by country
5.4.Others
5.4.1.Key market trends, growth factors, and opportunities
5.4.2.Market size and forecast
5.4.3.Market analysis by country
CHAPTER 6:GLOBAL PEA STARCH MARKET, BY REGION
6.1.Overview
6.2.North America
6.2.1.Key market trends, growth factors and opportunities
6.2.2.Market size and forecast by Country
6.2.3.Market size and forecast by type
6.2.4.Market size and forecast by application
6.2.5.U.S.
6.2.5.1.Market size and forecast, by type
6.2.5.2.Market size and forecast, by application
6.2.6.Canada
6.2.6.1.Market size and forecast, by type
6.2.6.2.Market size and forecast, by application
6.2.7.Mexico
6.2.7.1.Market size and forecast, by type
6.2.7.2.Market size and forecast, by application
6.3.Europe
6.3.1.Key market trends, growth factors and opportunities
6.3.2.Market size and forecast by country
6.3.3.Market size and forecast by type
6.3.4.Market size and forecast by application
6.3.5.Germany
6.3.5.1.Market size and forecast, by type
6.3.5.2.Market size and forecast, by application
6.3.6.France
6.3.6.1.Market size and forecast, by type
6.3.6.2.Market size and forecast, by application
6.3.8.UK
6.3.8.1.Market size and forecast, by type
6.3.8.3.Market size and forecast, by application
6.3.9.Italy
6.3.9.1.Market size and forecast, by type
6.3.9.3.Market size and forecast, by application
6.3.10.Spain
6.3.10.1.Market size and forecast, by type
6.3.10.3.Market size and forecast, by application
6.3.11.Rest of Europe
6.3.11.1.Market size and forecast, by type
6.3.11.3.Market size and forecast, by application
6.4.Asia-Pacific
6.4.1.Key market trends, growth factors and opportunities
6.4.3.Market size and forecast, by type
6.4.3.1.Market size and forecast, by application
6.4.4.Market size and forecast by country
6.4.5.China
6.4.5.1.Market size and forecast, by type
6.4.5.2.Market size and forecast, by application
6.4.6.India
6.4.6.2.Market size and forecast, by type
6.4.6.3.Market size and forecast, by application
6.4.7.Japan
6.4.7.2.Market size and forecast, by type
6.4.7.3.Market size and forecast, by application
6.4.8.Australia
6.4.8.2.Market size and forecast, by type
6.4.8.3.Market size and forecast, by application
6.4.9.Rest of Asia-Pacific
6.4.9.1.Market size and forecast, by type
6.4.9.2.Market size and forecast, by application
6.5.LAMEA
6.5.1.Key market trends, growth factors and opportunities
6.5.2.Market size and forecast by country
6.5.3.Market size and forecast by type
6.5.4.Market size and forecast, by application
6.5.5.Latin America
6.5.5.2.Market size and forecast by type
6.5.5.3.Market size and forecast, by application
6.5.6.Middle East
6.5.6.2.Market size and forecast by type
6.5.6.3.Market size and forecast, by application
6.5.7.
6.5.8.Africa
6.5.8.2.Market size and forecast by type
6.5.8.3.Market size and forecast, by application
CHAPTER 7:COMPETITION LANDSCAPE
7.1.Product mapping
7.2.Competitive dashboard
7.3.Competitive heatmap
CHAPTER 8:COMPANY PROFILES
8.1.AGRIDIENT INC.
8.1.1.Company overview
8.1.2.Key Executive
8.1.3.Company snapshot
8.1.4.Product portfolio
8.2.AMERICAN KEY PRODUCTS, INC.
8.2.1.Company overview
8.2.2.Key Executives
8.2.3.Company snapshot
8.2.4.Product portfolio
8.3.COSUCRA GROUPE WARCONING SA
8.3.1.Company overview
8.3.2.Key Executives
8.3.3.Company snapshot
8.3.4.Product portfolio
8.4.EMSLAND GROUP
8.4.1.Company overview
8.4.2.Key Executives
8.4.3.Company snapshot
8.4.4.Product portfolio
8.5.MEELUNIE B.V.
8.5.1.Company overview
8.5.2.Key Executives
8.5.3.Company snapshot
8.5.4.Product portfolio
8.6.PURIS FOODS
8.6.1.Company overview
8.6.2.Key Executives
8.6.3.Company snapshot
8.6.4.Product portfolio
8.7.ROQUETTE FRÈRES
8.7.1.Company overview
8.7.2.Key Executives
8.7.3.Company snapshot
8.7.4.Product portfolio
8.8.SHANGHAI BICHAIN INDUSTRIAL CHEMICAL
8.8.1.Company overview
8.8.2.Key Executives
8.8.3.Company snapshot
8.8.4.Product portfolio
8.9.THE SCOULAR COMPANY
8.9.1.Company overview
8.9.2.Key Executives
8.9.3.Company snapshot
8.9.4.Product portfolio
8.10.VESTKORN MILLING AS.
8.10.1.Company overview
8.10.2.Key Executives
8.10.3.Company snapshot
8.10.4.Product portfolio
LIST OF TABLES
TABLE 01.GLOBAL PEA STARCH MARKET, BY TYPE 2018–2026 ($MILLION)
TABLE 02.ORGANIC/NON-GMO PEA STARCH MARKET, BY REGION, 2018–2026 ($MILLION)
TABLE 03.CONVENTIONAL PEA STARCH MARKET, BY REGION, 2018–2026 ($MILLION)
TABLE 04.GLOBAL PEA STARCH MARKET, BY APPLICATION, 2018–2026 ($MILLION)
TABLE 05.GLOBAL PEA STARCH MARKET REVENUE FOR FOOD AND BEVERAGES, BY REGION, 2018–2026 ($MILLION)
TABLE 06.GLOBAL PEA STARCH MARKET REVENUE FOR FEED, BY REGION, 2018–2026 ($MILLION)
TABLE 07.GLOBAL PEA STARCH MARKET REVENUE FOR OTHER APPLICATIONS, BY REGION, 2018–2026 ($MILLION)
TABLE 08.GLOBAL PEA STARCH MARKET, BY REGION, 2018–2026 ($MILLION)
TABLE 09.NORTH AMERICA PEA STARCH MARKET, BY COUNTRY, 2018–2026 ($MILLION)
TABLE 10.NORTH AMERICA PEA STARCH MARKET, BY TYPE, 2018–2026($MILLION)
TABLE 11.NORTH AMERICA PEA STARCH MARKET, BY APPLICATION, 2018–2026 ($MILLION)
TABLE 12.U.S. PEA STARCH MARKET, BY TYPE, 2018–2026 ($MILLION)
TABLE 13.U.S. PEA STARCH MARKET, BY APPLICATION, 2018–2026 ($MILLION)
TABLE 14.CANADA PEA STARCH MARKET, BY TYPE, 2018–2026 ($MILLION)
TABLE 15.CANADA PEA STARCH MARKET, BY APPLICATION, 2018–2026 ($MILLION)
TABLE 16.MEXICO PEA STARCH MARKET, BY TYPE, 2018–2026 ($MILLION)
TABLE 17.MEXICO PEA STARCH MARKET, BY APPLICATION, 2018–2026 ($MILLION)
TABLE 18.EUROPE PEA STARCH MARKET, BY COUNTRY, 2018–2026 ($MILLION)
TABLE 19.EUROPE PEA STARCH MARKET, BY TYPE, 2018–2026 ($MILLION)
TABLE 20.EUROPE PEA STARCH MARKET, BY APPLICATION, 2018–2026 ($MILLION)
TABLE 21.GERMANY PEA STARCH MARKET, BY TYPE, 2018–2026 ($MILLION)
TABLE 22.GERMANY PEA STARCH MARKET, BY APPLICATION, 2018–2026 ($MILLION)
TABLE 23.FRANCE PEA STARCH MARKET, BY TYPE, 2018–2026 ($MILLION)
TABLE 24.FRANCE PEA STARCH MARKET, BY APPLICATION, 2018–2026 ($MILLION)
TABLE 25.UK PEA STARCH MARKET, BY TYPE, 2018–2026 ($MILLION)
TABLE 26.UK PEA STARCH MARKET, BY APPLICATION, 2018–2026 ($MILLION)
TABLE 27.ITALY PEA STARCH MARKET, BY TYPE, 2018–2026 ($MILLION)
TABLE 28.ITALY PEA STARCH MARKET, BY APPLICATION, 2018–2026 ($MILLION)
TABLE 29.SPAIN PEA STARCH MARKET, BY TYPE, 2018–2026 ($MILLION)
TABLE 30.SPAIN PEA STARCH MARKET, BY APPLICATION, 2018–2026 ($MILLION)
TABLE 31.REST OF EUROPE PEA STARCH MARKET, BY TYPE, 2018–2026 ($MILLION)
TABLE 32.REST OF EUROPE PEA STARCH MARKET, BY APPLICATION, 2018–2026 ($MILLION)
TABLE 33.ASIA-PACIFIC PEA STARCH MARKET BY TYPE, 2018-2026 ($MILLION)
TABLE 34.ASIA-PACIFIC PEA STARCH MARKET, BY APPLICATION, 2018–2026 ($MILLION)
TABLE 35.ASIA-PACIFIC PEA STARCH MARKET, BY COUNTRY, 2019-20266 ($MILLION)
TABLE 36.CHINA PEA STARCH MARKET, BY FORM, 2018–2026 ($MILLION)
TABLE 37.CHINA PEA STARCH MARKET, BY APPLICATION, 2018–2026 ($MILLION)
TABLE 38.INDIA PEA STARCH MARKET BY TYPE, 2018-2026 ($MILLION)
TABLE 39.INDIA PEA STARCH MARKET, BY APPLICATION, 2018–2026 ($MILLION)
TABLE 40.JAPAN PEA STARCH MARKET BY TYPE, 2018-2026 ($MILLION)
TABLE 41.JAPAN PEA STARCH MARKET, BY APPLICATION, 2018–2026 ($MILLION)
TABLE 42.SOUTH-EAST ASIA PEA STARCH MARKET BY TYPE, 2018-2026 ($MILLION)
TABLE 43.AUSTRALIA PEA STARCH MARKET, BY APPLICATION, 2018–2026 ($MILLION)
TABLE 44.REST OF ASIA-PACIFIC PEA STARCH MARKET BY TYPE, 2018-2026 ($MILLION)
TABLE 45.REST OF ASIA-PACIFIC GLOBAL PEA STARCH MARKET, BY APPLICATION, 2018–2026 ($MILLION)
TABLE 46.LAMEA PEA STARCH MARKET, BY COUNTRY, 2018–2026 ($MILLION)
TABLE 47.LAMEA PEA STARCH MARKET BY TYPE, 2018-2026 ($MILLION)
TABLE 48.LAMEA PEA STARCH MARKET, BY APPLICATION, 2018–2026 ($MILLION)
TABLE 49.LATIN AMERICA PEA STARCH MARKET BY TYPE, 2018-2026 ($MILLION)
TABLE 50.LATIN AMERICA PEA STARCH MARKET, BY DISTRIBUTION CHANNEL, 2018–2026 ($MILLION)
TABLE 51.MIDDLE EAST PEA STARCH MARKET BY TYPE, 2018-2026 ($MILLION)
TABLE 52.MIDDLE EAST PEA STARCH MARKET, BY APPLICATION, 2018–2026 ($MILLION)
TABLE 53.AFRICA PEA STARCH MARKET BY TYPE, 2018-2026 ($MILLION)
TABLE 54.AFRICA PEA STARCH MARKET, BY APPLICATION, 2018–2026 ($MILLION)
TABLE 55.AGRIDIENT INC.: KEY EXECUTIVE
TABLE 56.AGRIDIENT INC.: COMPANY SNAPSHOT
TABLE 57.AGRIDIENT INC.: PRODUCT PORTFOLIO
TABLE 58.AMERICAN KEY PRODUCTS, INC.: KEY EXECUTIVES
TABLE 59.AMERICAN KEY PRODUCTS, INC.: COMPANY SNAPSHOT
TABLE 60.AMERICAN KEY PRODUCTS, INC: PRODUCT PORTFOLIO
TABLE 61.COSUCRA GROUPE WARCONING SA: KEY EXECUTIVES
TABLE 62.COSUCRA GROUPE WARCONING SA: COMPANY SNAPSHOT
TABLE 63.COSUCRA GROUPE WARCONING SA: PRODUCT PORTFOLIO
TABLE 64.EMSLAND GROUP: KEY EXECUTIVES
TABLE 65.EMSLAND GROUP: COMPANY SNAPSHOT
TABLE 66.EMSLAND GROUP: PRODUCT PORTFOLIO
TABLE 67.MEELUNIE B.V.: KEY EXECUTIVES
TABLE 68.MEELUNIE B.V.: COMPANY SNAPSHOT
TABLE 69.MEELUNIE B.V.: PRODUCT PORTFOLIO
TABLE 70.PURIS FOODS: KEY EXECUTIVES
TABLE 71.PURIS FOODS: COMPANY SNAPSHOT
TABLE 72.PURIS FOODS: PRODUCT PORTFOLIO
TABLE 73.ROQUETTE FRÈRES: KEY EXECUTIVES
TABLE 74.ROQUETTE FRÈRES: COMPANY SNAPSHOT
TABLE 75.ROQUETTE FRÈRES: PRODUCT PORTFOLIO
TABLE 76.SHANGHAI BICHAIN INDUSTRIAL CHEMICAL: KEY EXECUTIVES
TABLE 77.SHANGHAI BICHAIN INDUSTRIAL CHEMICAL: COMPANY SNAPSHOT
TABLE 78.SHANGHAI BICHAIN INDUSTRIAL CHEMICAL: PRODUCT PORTFOLIO
TABLE 79.THE SCOULAR COMPANY: KEY EXECUTIVES
TABLE 80.THE SCOULAR COMPANY: COMPANY SNAPSHOT
TABLE 81.THE SCOULAR COMPANY: PRODUCT PORTFOLIO
TABLE 82.VESTKORN MILLING AS.: KEY EXECUTIVES
TABLE 83.VESTKORN MILLING AS.: COMPANY SNAPSHOT
TABLE 84.VESTKORN MILLING AS.: PRODUCT PORTFOLIO
LIST OF FIGURES
FIGURE 01.KEY MARKET SEGMENTS
FIGURE 02.GLOBAL PEA STARCH MARKET SNAPSHOT
FIGURE 03.TOP INVESTMENT POCKETS
FIGURE 04.BARGAINING POWER OF SUPPLIERS
FIGURE 05.BARGAINING POWER OF BUYERS
FIGURE 06.THREAT OF SUBSTITUTION
FIGURE 07.THREAT OF NEW ENTRANTS
FIGURE 08.INTENSITY OF COMPETITIVE RIVALRY
FIGURE 09.GLOBAL PEA STARCH MARKET SHARE, BY TYPE, 2018(%)
FIGURE 10.COMPARATIVE SHARE ANALYSIS OF ORGANIC/NON-GMO PEA STARCH MARKET, BY COUNTRY, 2018 & 2026 (%)
FIGURE 11.COMPARATIVE SHARE ANALYSIS OF CONVENTIONAL PEA STARCH MARKET, BY COUNTRY, 2018 & 2026 (%)
FIGURE 12.GLOBAL PEA STARCH MARKET SHARE, BY APPLICATION, 2018(%)
FIGURE 13.COMPARATIVE SHARE ANALYSIS OF FOOD AND BEVERAGES, BY COUNTRY, 2018 & 2026 (%)
FIGURE 14.COMPARATIVE SHARE ANALYSIS OF FEED, BY COUNTRY, 2018 & 2026 (%)
FIGURE 15.COMPARATIVE SHARE ANALYSIS OF OTHER APPLICATIONS, BY COUNTRY, 2018 & 2026 (%)
FIGURE 16.GLOBAL PEA STARCH MARKET SHARE BY REGION, 2018(%)
FIGURE 17.U.S. PEA STARCH MARKET, 2018–2026 ($MILLION)
FIGURE 18.CANADA PEA STARCH MARKET, 2018–2026 ($MILLION)
FIGURE 19.MEXICO PEA STARCH MARKET, 2018–2026 ($MILLION)
FIGURE 20.GERMANY PEA STARCH MARKET, 2018-2026 ($MILLION)
FIGURE 21.FRANCE PEA STARCH MARKET, 2018-2026 ($MILLION)
FIGURE 22.UK PEA STARCH MARKET, 2018-2026 ($MILLION)
FIGURE 23.ITALY PEA STARCH MARKET, 2018-2026 ($MILLION)
FIGURE 24.SPAIN PEA STARCH MARKET, 2018-2026 ($MILLION)
FIGURE 25.REST OF EUROPE PEA STARCH MARKET, 2018-2026 ($MILLION)
FIGURE 26.CHINA PEA STARCH MARKET, 2018-2026 ($MILLION)
FIGURE 27.INDIA PEA STARCH MARKET, 2018-2026 ($MILLION)
FIGURE 28.JAPAN PEA STARCH MARKET, 2018-2026 ($MILLION)
FIGURE 29.AUSTRALIA PEA STARCH MARKET, 2018-2026 ($MILLION)
FIGURE 30.REST OF ASIA-PACIFIC PEA STARCH MARKET, 2018-2026 ($MILLION)
FIGURE 31.LATIN AMERICA PEA STARCH MARKET, 2018-2026 ($MILLION)
FIGURE 32.MIDDLE EAST PEA STARCH MARKET, 2018-2026 ($MILLION)
FIGURE 33.AFRICA PEA STARCH MARKET, 2018-2026 ($MILLION)
FIGURE 34.PRODUCT MAPPING OF TOP 10 KEY PLAYERS
FIGURE 35.COMPETITIVE DASHBOARD OF TOP 10 KEY PLAYERS
FIGURE 36.COMPETITIVE HEATMAP OF TOP 10 KEY PLAYERS