Int'l : +1-503-894-6022 | Toll Free : +1-800-792-5285 | help@alliedmarketresearch.com
A04857 | Pages: 230 | Charts: 22 | Tables: 72 |
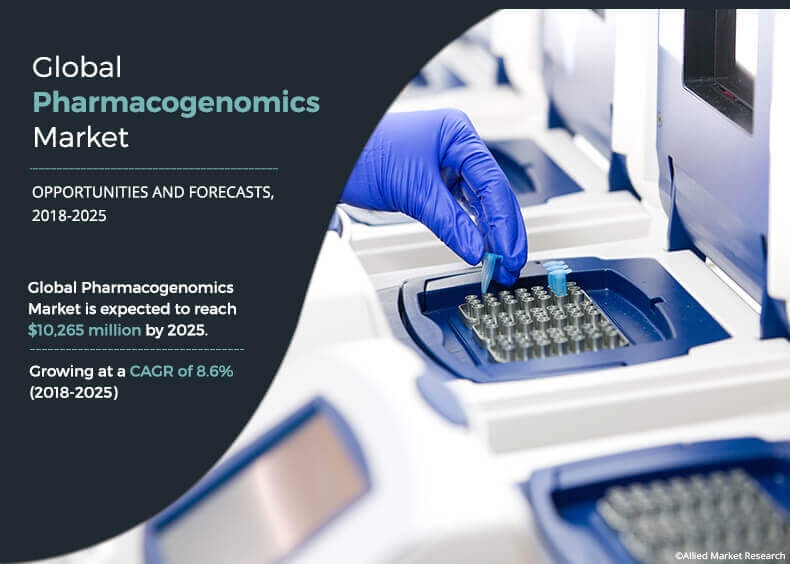
The pharmacogenomics market size accounted for $5,312.8 million in 2017 and is projected to reach $10,265.5 million by 2025, registering a CAGR of 8.61% from 2018 to 2025.
Increase in elderly population, surge in adoption of pharmacogenomics procedure by the healthcare professionals, growing awareness of the patient population towards personalized therapy, and growth in prevalence of chronic diseases such as cancer, tuberculosis, HIV, and others, drive the growth of global pharmacogenomics market. Furthermore, technological advancements associated with molecular diagnostics procedure for better understanding of the genetic structure of the individual patients is also expected to boost the market growth of pharmacogenomics market during the forecast period.
However, factors such as dearth of skilled and highly trained healthcare professionals in performing the pharmacogenomics diagnostics test, high cost associated with tests and lack of funding for the research and development of different pharmacogenomics pathways, are anticipated to restrain the growth of global pharmacogenomics market. However, surge in disposable income of the global population is expected to provide lucrative growth opportunities for the market.
Get more information on this report : Request Sample Pages
The global pharmacogenomics market is segmented based on technology, application, end user. Based on technology, the market is segmented into polymerase chain reaction, sequencing, microarray, mass spectrometry, and electrophoresis. Polymerase chain reaction has the largest market share in the technology segment of the global pharmacogenomics market. Owing to its irreplaceability in terms of use for the amplification of a small segment of DNA, polymerase chain reaction is anticipated to continue its trend throughout the forecast period. Polymerase chain reaction was valued to be at $2151.9 million in the year 2017.
Get more information on this report : Request Sample Pages
Based on end user, it is categorized into hospitals and clinics, research organizations & academic institutes. The hospitals and clinics segment accounted for the largest share among end users for pharmacogenomic products, followed by research organizations and academic institutes. This is attributed to the fact that hospitals are well-equipped with molecular diagnostic lab units to cater to the different needs of the patients. Moreover, pharmacogenomics lab units at hospitals are well-equipped with highly superior systems. Better infrastructure and technological edge over other medical centers, presence of highly skilled medical professionals and the patients preferring hospitals over others has propelled the growth of hospitals in the end user and is anticipated to be at the top throughout the global pharmacogenomics market forecast. Furthermore, research institutions are the fastest growing in the end user segment owing to the robust use of pharmacogenomics as a tool for personalized drugs for curing diseases such as cancer, several infectious diseases like tuberculosis, HIV/AIDS and others.
Get more information on this report : Request Sample Pages
Based on application, the market is divided into oncology, cardiovascular disease, neurological disease, infectious diseases, psychiatry, pain management amongst other applications. Pharmacogenomics tests in oncology are used for understanding the correlation between the effects of drugs over based on an individuals genomic profile. The oncology has the largest market share in the application segment for the global pharmacogenomics market with a total revenue of $1,954 million in the year 2017 and is anticipated to maintain its position throughout the forecast period. This is attributed to the increase in prevalence of cancer across the globe, rise in demand for personalized therapy, and surge in demand for the use of pharmacogenomics in drug discovery and development. In addition, infectious diseases in the application segment is the fastest growing segment with a CAGR of 10.1%. Owing to the increased demand for the use of pharmacogenomics as tool to eradicate the infectious diseases completely. The number of people that fall sick due to the infectious diseases, these includes the big three infectious diseases vis--vis HIV/AIDS, tuberculosis and malaria. According to World Health Organization, World Health Organization, the prevalence of these diseases has grown over 250 million globally, out of which 71%, 28% and 88% of the cases occur in sub-Saharan Africa alone respectively. African countries are continuously struggling to contain infectious diseases, and there is a need for governments to commit resources not only for treatment, but also towards research and development aimed at innovative approaches such as pharmacogenomics. Most of the infectious disease have proven to be challenging owing to the drug resistance they provide against several antibiotics. The higher rate of resistance is mainly due to improper and/or unspecified prescription and use of antimicrobials has raised the demand to run pharmacogenomics-based diagnostics tests before prescribing any drugs Furthermore, surge in geriatric population, rise in health awareness, and increased adoption of personalized therapy by drug manufacturing companies and healthcare professionals are also anticipated to boost the growth of the global pharmacogenomics market.
Get more information on this report : Request Sample Pages
The report provides an extensive competitive analysis and profiles of the key market players, such as Abbott Laboratories, Dynamic DNA Laboratories, Empire Genomics, LLC, F. Hoffmann-La Roche Ltd., Illumina, Inc., OneOme LLC, Myriad Genetics Inc., OPKO Health, Inc. (GeneDx), and Thermo Fisher Scientific, Inc. The other players included in the value chain analysis (but not included in the report) are Assurex Health Inc., Teva Pharmaceutical Industries Ltd., and Bayer AG.
Key Market Segments
Key Market Players
CHAPTER 1: INTRODUCTION
1.1. Report description
1.2. Key benefits for stakeholders
1.3. Key market segments
1.4. Research methodology
1.4.1. Secondary research
1.4.2. Primary research
1.4.3. Analyst tools & models
CHAPTER 2: EXECUTIVE SUMMARY
2.1. Key findings of the study
2.2. CXO Perspective
CHAPTER 3: MARKET OVERVIEW
3.1. Market definition and scope
3.2. Key findings
3.2.1. Top investment pockets
3.3. Porter’s five forces analysis
3.4. Market dynamics
3.4.1. Drivers
3.4.1.1. Growing demand for personalized therapy
3.4.1.2. Increased prevalence of life-threatening diseases worldwide
3.4.1.3. Technological advancements in the molecular techniques used for pharmacogenomics-based diagnostics
3.4.2. Restraints
3.4.2.1. Dearth of well-trained and technically skilled professionals
3.4.2.2. Complexities in finding the right gene affecting the drug response
3.4.3. Opportunity
3.4.3.1. Technological advancements in molecular techniques used for pharmacogenomics diagnostic tests
3.4.3.2. Lucrative opportunities in the emerging economies
3.5. Top Player Positioning, 2017
CHAPTER 4: GLOBAL PHARMACOGENOMICS MARKET, BY TECHNOLOGY
4.1. Overview
4.1.1. Market size and forecast
4.2. Next Generation Sequencing
4.2.1. Key market trends and growth opportunities
4.2.2. Market Size and forecast
4.3. Polymerase Chain Reaction
4.3.1. Key market trends and growth opportunities
4.3.2. Market Size and forecast
4.4. Gel electrophoresis
4.4.1. Key market trends and growth opportunities
4.4.2. Market Size and forecast
4.5. Mass Spectrometry
4.5.1. Key market trends and growth opportunities
4.5.2. Market Size and forecast
4.6. Microarray
4.6.1. Key market trends and growth opportunities
4.6.2. Market Size and forecast
4.7. Others
4.7.1. Key market trends and growth opportunities
4.7.2. Market Size and forecast
CHAPTER 5: GLOBAL PHARMACOGENOMICS MARKET, BY APPLICATION
5.1. Overview
5.1.1. Market size and forecast
5.2. Cardiovascular disease
5.2.1. Market Size and forecast
5.3. Infectious diseases
5.3.1. Market Size and forecast
5.4. Oncology
5.4.1. Market Size and forecast
5.5. Neurological diseases
5.5.1. Market Size and forecast
5.6. Psychiatry
5.6.1. Market Size and forecast
5.7. Others
5.7.1. Market Size and forecast
CHAPTER 6: GLOBAL PHARMACOGENOMICS MARKET BY END USER
6.1. Overview
6.1.1. Market size and forecast
6.2. Hospitals and Clinics
6.2.1. Market Size and forecast
6.3. Research Institutions and Academic institutes
6.3.1. Market Size and forecast
6.4. Others
6.4.1. Market Size and forecast
CHAPTER 7: PHARMACOGENOMICS MARKET, BY REGION
7.1. Overview
7.1.1. Market size and forecast
7.2. North America
7.2.1. Key market trends, growth factors, and opportunities
7.2.2. North America market size and forecast, by country
7.2.2.1. U.S. market size and forecast, by technology
7.2.2.2. U.S. market size and forecast, by application
7.2.2.3. U.S. market size and forecast, by end user
7.2.2.4. Canada market size and forecast, by technology
7.2.2.5. Canada market size and forecast, by application
7.2.2.6. Canada. market size and forecast, by end user
7.2.2.7. Mexico market size and forecast, by technology
7.2.2.8. Mexico market size and forecast, by application
7.2.2.9. Mexico. market size and forecast, by end user
7.2.3. North America market size and forecast, by type
7.2.4. North America market size and forecast, by application
7.2.5. North America market size and forecast, by end user
7.3. Europe
7.3.1. Key market trends, growth factors, and opportunities
7.3.2. Europe market size and forecast, by country
7.3.2.1. Germany market size and forecast, by technology
7.3.2.2. Germany market size and forecast, by application
7.3.2.3. Germany. market size and forecast, by end user
7.3.2.4. France market size and forecast, by technology
7.3.2.5. France market size and forecast, by application
7.3.2.6. France. market size and forecast, by end user
7.3.2.7. Spain market size and forecast, by technology
7.3.2.8. Spain market size and forecast, by application
7.3.2.9. Spain. market size and forecast, by end user
7.3.2.10. Italy market size and forecast, by technology
7.3.2.11. Italy market size and forecast, by application
7.3.2.12. Italy. market size and forecast, by end user
7.3.2.13. UK market size and forecast, by technology
7.3.2.14. UK market size and forecast, by application
7.3.2.15. UK. market size and forecast, by end user
7.3.2.16. UK market size and forecast, by technology
7.3.2.17. Rest of Europe market size and forecast, by technology
7.3.2.18. Rest of Europe market size and forecast, by application
7.3.2.19. Rest of Europe. market size and forecast, by end user
7.3.3. Europe market size and forecast, by type
7.3.4. Europe market size and forecast, by application
7.3.5. Europe market size and forecast, by end user
7.4. Asia-Pacific
7.4.1. Key market trends, growth factors, and opportunities
7.4.2. Asia-Pacific market size and forecast, by country
7.4.2.1. China market size and forecast, by technology
7.4.2.2. China market size and forecast, by application
7.4.2.3. China. market size and forecast, by end user
7.4.2.4. Japan market size and forecast, by technology
7.4.2.5. Japan market size and forecast, by application
7.4.2.6. Japan. market size and forecast, by end user
7.4.2.7. India market size and forecast, by technology
7.4.2.8. India market size and forecast, by application
7.4.2.9. India market size and forecast, by end user
7.4.2.10. Rest of Asia-Pacific market size and forecast, by technology
7.4.2.11. Rest of Asia-Pacific market size and forecast, by application
7.4.2.12. Rest of Asia-Pacific. market size and forecast, by end user
7.4.3. Asia-Pacific market size and forecast, by type
7.4.4. Asia-Pacific market size and forecast, by application
7.4.5. Asia-Pacific market size and forecast, by end user
7.5. LAMEA
7.5.1. Key market trends, growth factors, and opportunities
7.5.2. LAMEA market size and forecast, by country
7.5.2.1. Latin America market size and forecast, by technology
7.5.2.2. Latin America market size and forecast, by application
7.5.2.3. Latin America market size and forecast, by end user
7.5.2.4. Middle East market size and forecast, by technology
7.5.2.5. Middle East market size and forecast, by application
7.5.2.6. Middle East. market size and forecast, by end user
7.5.2.7. Africa market size and forecast, by technology
7.5.2.8. Africa market size and forecast, by application
7.5.2.9. Africa market size and forecast, by end user
7.5.3. LAMEA market size and forecast, by type
7.5.4. LAMEA market size and forecast, by application
7.5.5. LAMEA market size and forecast, by end user
CHAPTER 8: COMPANY PROFILES
8.1. Abbott Laboratories
8.1.1. Company overview
8.1.2. Company snapshot
8.1.3. Operating business segments
8.1.4. Product Portfolio
8.1.5. Business performance
8.2. Admera Health
8.2.1. Company overview
8.2.2. Company snapshot
8.2.3. Product portfolio
8.3. Dynamic DNA Laboratories
8.3.1. Company overview
8.3.2. Company snapshot
8.3.3. Operating business segments
8.3.4. Product portfolio
8.4. Empire Genomics, LLC.
8.4.1. Company overview
8.4.2. Company snapshot
8.4.3. Product portfolio
8.5. F. Hoffmann-La Roche Ltd.
8.5.1. Company overview
8.5.2. Company snapshot
8.5.3. Operating business segments
8.5.4. Product portfolio
8.5.5. Business performance
8.5.6. Key strategic moves and developments
8.6. Illumina, Inc.
8.6.1. Company overview
8.6.2. Company snapshot
8.6.3. Operating business segments
8.6.4. Product Portfolio
8.6.5. Business performance
8.7. OneOme, LLC
8.7.1. Company overview
8.7.2. Company snapshot
8.7.3. Product Portfolio
8.8. Myriad Genetics Inc.
8.8.1. Company overview
8.8.2. Company snapshot
8.8.3. Operating business segments
8.8.4. Product Portfolio
8.9. OPKO Health, Inc. (GeneDx.)
8.9.1. Company overview
8.9.2. Company snapshot
8.9.3. Operating business segments
8.9.4. Product Portfolio
8.9.5. Business performance
8.10. Thermo Fisher Scientific, Inc.
8.10.1. Company overview
8.10.2. Company snapshot
8.10.3. Operating business segments
8.10.4. Product Portfolio
8.10.5. Business performance
LIST OF TABLES
TABLE 01. GLOBAL PHARMACOGENOMICS MARKET, BY TECHNOLOGY, 2017–2025 ($MILLION)
TABLE 02. GLOBAL PHARMACOGENOMICS MARKET, BY REGION, 2017–2025 ($MILLION)
TABLE 03. POLYMERASE CHAIN REACTION MARKET BY REGION, 2017–2025 ($MILLION)
TABLE 04. GEL ELECTROPHORESIS MARKET BY REGION, 2017–2025 ($MILLION)
TABLE 05. MASS SPECTROMETRY MARKET BY REGION, 2017–2025 ($MILLION)
TABLE 06. MICROARRAY MARKET BY REGION, 2017–2025 ($MILLION)
TABLE 07. OTHERS MARKET BY REGION, 2017–2025 ($MILLION)
TABLE 08. GLOBAL PHARMACOGENOMICS MARKET, BY REGION, 2018–2025 ($MILLION)
TABLE 09. GLOBAL CARDIOVASCULAR DISEASE MARKET, BY REGION, 2018–2025 ($MILLION)
TABLE 10. GLOBAL INFECTIOUS DISEASES MARKET, BY REGION, 2018–2025 ($MILLION)
TABLE 11. ONCOLOGY MARKET, BY REGION, 2018–2025 ($MILLION)
TABLE 12. NEUROLOGICAL DISEASES MARKET, BY REGION, 2018–2025 ($MILLION)
TABLE 13. PSYCHIATRY MARKET, BY REGION, 2018–2025 ($MILLION)
TABLE 14. OTHERS MARKET, BY REGION, 2018–2025 ($MILLION)
TABLE 15. GLOBAL PHARMACOGENOMICS MARKET REVENUE, BY REGION, 2017–2025 ($MILLION)
TABLE 16. HOSPITALS AND CLINICS MARKET, BY REGION, 2017–2025 ($MILLION)
TABLE 17. RESEARCH INSTITUTIONS AND ACADEMIC INSTITUTES MARKET, BY REGION, 2017–2025 ($MILLION)
TABLE 18. OTHERS MARKET, BY REGION, 2017–2025 ($MILLION)
TABLE 19. PHARMACOGENOMICS MARKET REVENUE, BY REGION, 2017–2025 ($MILLION)
TABLE 20. NORTH AMERICA PHARMACOGENOMICS MARKET, BY COUNTRY, 2017–2025 ($MILLION)
TABLE 21. U.S. PHARMACOGENOMICS MARKET, BY TECHNOLOGY, 2017–2025 ($MILLION)
TABLE 22. U.S. PHARMACOGENOMICS MARKET, BY APPLICATION, 2017–2025 ($MILLION)
TABLE 23. U.S. PHARMACOGENOMICS MARKET, BY END USER, 2017–2025 ($MILLION)
TABLE 24. CANADA PHARMACOGENOMICS MARKET, BY TECHNOLOGY, 2017–2025 ($MILLION)
TABLE 25. CANADA PHARMACOGENOMICS MARKET, BY APPLICATION, 2017–2025 ($MILLION)
TABLE 26. CANADA PHARMACOGENOMICS MARKET, BY END USER, 2017–2025 ($MILLION)
TABLE 27. MEXICO PHARMACOGENOMICS MARKET, BY TECHNOLOGY, 2017–2025 ($MILLION)
TABLE 28. MEXICO PHARMACOGENOMICS MARKET, BY APPLICATION, 2017–2025 ($MILLION)
TABLE 29. MEXICO PHARMACOGENOMICS MARKET, BY END USER, 2017–2025 ($MILLION)
TABLE 30. NORTH AMERICA PHARMACOGENOMICS MARKET, BY TECHNOLOGY, 2017–2025 ($MILLION)
TABLE 31. NORTH AMERICA PHARMACOGENOMICS MARKET, BY APPLICATION, 2017–2025 ($MILLION)
TABLE 32. NORTH AMERICA PHARMACOGENOMICS MARKET, BY END USER, 2017–2025 ($MILLION)
TABLE 33. EUROPE PHARMACOGENOMICS MARKET, BY COUNTRY, 2017–2025 ($MILLION)
TABLE 34. GERMANY PHARMACOGENOMICS MARKET, BY TECHNOLOGY, 2017–2025 ($MILLION)
TABLE 35. GERMANY PHARMACOGENOMICS MARKET, BY APPLICATION, 2017–2025 ($MILLION)
TABLE 36. GERMANY PHARMACOGENOMICS MARKET, BY END USER, 2017–2025 ($MILLION)
TABLE 37. FRANCE PHARMACOGENOMICS MARKET, BY TECHNOLOGY, 2017–2025 ($MILLION)
TABLE 38. FRANCE PHARMACOGENOMICS MARKET, BY APPLICATION, 2017–2025 ($MILLION)
TABLE 39. FRANCE PHARMACOGENOMICS MARKET, BY END USER, 2017–2025 ($MILLION)
TABLE 40. SPAIN PHARMACOGENOMICS MARKET, BY TECHNOLOGY, 2017–2025 ($MILLION)
TABLE 41. SPAIN PHARMACOGENOMICS MARKET, BY APPLICATION, 2017–2025 ($MILLION)
TABLE 42. SPAIN PHARMACOGENOMICS MARKET, BY END USER, 2017–2025 ($MILLION)
TABLE 43. ITALY PHARMACOGENOMICS MARKET, BY TECHNOLOGY, 2017–2025 ($MILLION)
TABLE 44. ITALY PHARMACOGENOMICS MARKET, BY APPLICATION, 2017–2025 ($MILLION)
TABLE 45. ITALY PHARMACOGENOMICS MARKET, BY END USER, 2017–2025 ($MILLION)
TABLE 46. UK PHARMACOGENOMICS MARKET, BY TECHNOLOGY, 2017–2025 ($MILLION)
TABLE 47. UK PHARMACOGENOMICS MARKET, BY APPLICATION, 2017–2025 ($MILLION)
TABLE 48. UK PHARMACOGENOMICS MARKET, BY END USER, 2017–2025 ($MILLION)
TABLE 49. UK PHARMACOGENOMICS MARKET, BY TECHNOLOGY, 2017–2025 ($MILLION)
TABLE 50. REST OF EUROPE PHARMACOGENOMICS MARKET, BY TECHNOLOGY, 2017–2025 ($MILLION)
TABLE 51. REST OF EUROPE PHARMACOGENOMICS MARKET, BY APPLICATION, 2017–2025 ($MILLION)
TABLE 52. REST OF EUROPE PHARMACOGENOMICS MARKET, BY END USER, 2017–2025 ($MILLION)
TABLE 53. EUROPE PHARMACOGENOMICS MARKET, BY TYPE, 2017–2025 ($MILLION)
TABLE 54. EUROPE PHARMACOGENOMICS MARKET, BY APPLICATION, 2017–2025 ($MILLION)
TABLE 55. EUROPE PHARMACOGENOMICS MARKET, BY END USER, 2017–2025 ($MILLION)
TABLE 56. ASIA-PACIFIC PHARMACOGENOMICS MARKET, BY COUNTRY, 2017–2025 ($MILLION)
TABLE 57. CHINA PHARMACOGENOMICS MARKET, BY TECHNOLOGY, 2017–2025 ($MILLION)
TABLE 58. CHINA PHARMACOGENOMICS MARKET, BY APPLICATION, 2017–2025 ($MILLION)
TABLE 59. CHINA PHARMACOGENOMICS MARKET, BY END USER, 2017–2025 ($MILLION)
TABLE 60. JAPAN PHARMACOGENOMICS MARKET, BY TECHNOLOGY, 2017–2025 ($MILLION)
TABLE 61. JAPAN PHARMACOGENOMICS MARKET, BY APPLICATION, 2017–2025 ($MILLION)
TABLE 62. JAPAN PHARMACOGENOMICS MARKET, BY END USER, 2017–2025 ($MILLION)
TABLE 63. INDIA PHARMACOGENOMICS MARKET, BY TECHNOLOGY, 2017–2025 ($MILLION)
TABLE 64. INDIA PHARMACOGENOMICS MARKET, BY APPLICATION, 2017–2025 ($MILLION)
TABLE 65. INDIA PHARMACOGENOMICS MARKET, BY END USER, 2017–2025 ($MILLION)
TABLE 66. REST OF ASIA-PACIFIC PHARMACOGENOMICS MARKET, BY TECHNOLOGY, 2017–2025 ($MILLION)
TABLE 67. REST OF ASIA-PACIFIC PHARMACOGENOMICS MARKET, BY APPLICATION, 2017–2025 ($MILLION)
TABLE 68. REST OF ASIA-PACIFIC PHARMACOGENOMICS MARKET, BY END USER, 2017–2025 ($MILLION)
TABLE 69. ASIA-PACIFIC PHARMACOGENOMICS MARKET, BY TYPE, 2017–2025 ($MILLION)
TABLE 70. ASIA-PACIFIC PHARMACOGENOMICS MARKET, BY APPLICATION, 2017–2025 ($MILLION)
TABLE 71. ASIA-PACIFIC PHARMACOGENOMICS MARKET, BY END USER, 2017–2025 ($MILLION)
TABLE 72. LAMEA PHARMACOGENOMICS MARKET, BY COUNTRY, 2017–2025 ($MILLION)
TABLE 73. LATIN AMERICA PHARMACOGENOMICS MARKET, BY TECHNOLOGY, 2017–2025 ($MILLION)
TABLE 74. LATIN AMERICA PHARMACOGENOMICS MARKET, BY APPLICATION, 2017–2025 ($MILLION)
TABLE 75. LATIN AMERICA PHARMACOGENOMICS MARKET, BY END USER, 2017–2025 ($MILLION)
TABLE 76. MIDDLE EAST PHARMACOGENOMICS MARKET, BY TECHNOLOGY, 2017–2025 ($MILLION)
TABLE 77. MIDDLE EAST PHARMACOGENOMICS MARKET, BY APPLICATION, 2017–2025 ($MILLION)
TABLE 78. MIDDLE EAST PHARMACOGENOMICS MARKET, BY END USER, 2017–2025 ($MILLION)
TABLE 79. AFRICA PHARMACOGENOMICS MARKET, BY TECHNOLOGY, 2017–2025 ($MILLION)
TABLE 80. AFRICA PHARMACOGENOMICS MARKET, BY APPLICATION, 2017–2025 ($MILLION)
TABLE 81. AFRICA PHARMACOGENOMICS MARKET, BY END USER, 2017–2025 ($MILLION)
TABLE 82. LAMEA PHARMACOGENOMICS MARKET, BY TYPE, 2017–2025 ($MILLION)
TABLE 83. LAMEA PHARMACOGENOMICS MARKET, BY APPLICATION, 2017–2025 ($MILLION)
TABLE 84. LAMEA PHARMACOGENOMICS MARKET, BY END USER, 2017–2025 ($MILLION)
TABLE 85. ABBOTT: COMPANY SNAPSHOT
TABLE 86. ABBOTT: OPERATING SEGMENTS
TABLE 87. ABBOTT: PRODUCT PORTFOLIO
TABLE 88. ADMERA HEALTH: COMPANY SNAPSHOT
TABLE 89. ADMERA HEALTH: PRODUCT PORTFOLIO
TABLE 90. DYNAMIC DNA LABORATORIES: COMPANY SNAPSHOT
TABLE 91. DYNAMIC DNA LABS: OPERATING SEGMENTS
TABLE 92. DYNAMIC DNA LABS: PRODUCT PORTFOLIO
TABLE 93. EMPIRE GENOMICS: COMPANY SNAPSHOT
TABLE 94. EMPIRE GENOMICS: PRODUCT PORTFOLIO
TABLE 95. F. HOFFMANN-LA ROCHE: COMPANY SNAPSHOT
TABLE 96. F. HOFFMANN-LA ROCHE: OPERATING SEGMENTS
TABLE 97. F. HOFFMANN-LA ROCHE: PRODUCT PORTFOLIO
TABLE 98. ILLUMINA: COMPANY SNAPSHOT
TABLE 99. ILLUMINA: OPERATING SEGMENTS
TABLE 100. ILLUMINA: PRODUCT PORTFOLIO
TABLE 101. ONEOME, LLC: COMPANY SNAPSHOT
TABLE 102. ONEOME, LLC: PRODUCT PORTFOLIO
TABLE 103. MYRIAD GENETICS INC.: COMPANY SNAPSHOT
TABLE 104. MYRIAD GENETICS: PRODUCT PORTFOLIO
TABLE 105. OPKO: COMPANY SNAPSHOT
TABLE 106. OPKO: OPERATING SEGMENTS
TABLE 107. OPKO: PRODUCT PORTFOLIO
TABLE 108. THERMO FISHER SCIENTIFIC: COMPANY SNAPSHOT
TABLE 109. THERMO FISHER SCIENTIFIC: OPERATING SEGMENTS
TABLE 110. THERMO FISHER SCIENTIFIC: PRODUCT PORTFOLIO
LIST OF FIGURES
FIGURE 01. SEGMENTATION OF GLOBAL PHARMACOGENOMICS MARKET
FIGURE 02. TOP INVESTMENT POCKETS IN THE GLOBAL ENTERPRISE CONTENT MANAGEMENT MARKET
FIGURE 03. LOW BARGAINING POWER OF SUPPLIERS
FIGURE 04. MODERATE BARGAINING POWER OF BUYERS
FIGURE 05. MODERATE THREAT OF SUBSTITUTION
FIGURE 06. MODERATE THREAT OF NEW ENTRANT
FIGURE 07. HIGH COMPETITIVE RIVALRY
FIGURE 08. TOP PLAYER POSITIONING, 2017
FIGURE 09. ABBOTT: NET SALES, 2015–2017 ($MILLION)
FIGURE 10. ABBOTT: NET SALES SHARE, BY OPERATING SEGMENT, 2017 (%)
FIGURE 11. ABBOTT: NET SALES SHARE, BY GEOGRAPHY, 2017 (%)
FIGURE 12. F. HOFFMANN-LA ROCHE: NET SALES, 2015–2017 ($MILLION)
FIGURE 13. F. HOFFMANN-LA ROCHE: REVENUE SHARE BY SEGMENT, 2017 (%)
FIGURE 14. ILLUMINA: REVENUE, 2015–2017 ($MILLION)
FIGURE 15. ILLUMINA: REVENUE SHARE, BY OPERATING SEGMENT, 2017 (%)
FIGURE 16. ILLUMINA: REVENUE SHARE, BY GEOGRAPHY, 2017 (%)
FIGURE 17. OPKO: REVENUE, 2015–2017 ($MILLION)
FIGURE 18. OPKO: REVENUE SHARE, BY SEGMENT, 2017 (%)
FIGURE 19. OPKO: REVENUE SHARE, BY GEOGRAPHY, 2017 (%)
FIGURE 20. THERMO FISHER SCIENTIFIC: REVENUE, 2015–2017 ($MILLION)
FIGURE 21. THERMO FISHER SCIENTIFIC: REVENUE SHARE, BY SEGMENT, 2017 (%)
FIGURE 22. THERMO FISHER SCIENTIFIC: REVENUE SHARE, BY GEOGRAPHY, 2017 (%)