Int'l : +1-503-894-6022 | Toll Free : +1-800-792-5285 | help@alliedmarketresearch.com
A01615 | Pages: 275 | Charts: 92 | Tables: 103 |
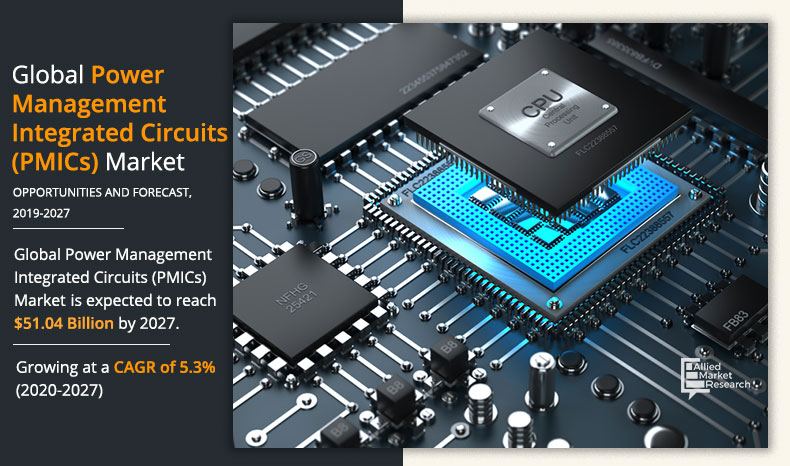
The global power management integrated circuits market size was valued at $33.96 billion in 2019 and expected to reach $51.04 billion by 2027, growing at a CAGR of 5.3% from 2020 to 2027.
PMIC stands for power management integrated circuits. These electronic components provide highly integrated, high-performance power management solutions for a wide range of application categories such as automotive, consumer electronics, and telecommunication & networking. PMICs offer optimum integration solutions because of its operating features such as power management, system control, battery management, interface & audio functions, as well as other system-specific functions.
Get more information on this report : Request Sample Pages
Currently, a wide range of PMICs are being used. Some frequently used ICs include voltage regulators, battery management ICs, integrated ASSP power management ICs, and motor control ICs. Assembled with high-performance process technologies, PMICs offer high-efficiency solutions that are designed to extend the battery life and reduce power dissipation.
Rise in technological advancements and increase in demand for battery-operated devices are the major drivers for the power management integrated circuits market globally. Moreover, the growth of the PMIC market is directly related to the growth in consumer electronics (primarily smartphones) and automobile sectors. Among all the drivers mentioned above, smartphones play a crucial role in the increased demand for power management ic. The sales of smartphones are expected to reach their peak in the next few years.
The deployment of various next-generation mobile networks such as 4G and 5G are the key factors that boost the power management integrated circuits market growth globally. In addition, increased adoption of data centers, growth in the light emitting diode market, energy harvesting solutions, renewable energy market & smart grids, and extensive use of PMICs in hybrid electric vehicles are some of the key drivers of the power management integrated circuits industry.
However, a complex integration process for multi-power domain systems on a chip (SOC) of PMICs is a major factor that hinders the power management integrated circuits market growth. For example, multi-voltage SOCs require robust methodology and toolsets for implementation, which is why a proper tool for an analog and digital part is a crucial factor.
The power management integrated circuits market report provides a valuable and in-depth overview of the ecosystem of this market, which includes product manufacturers & suppliers, original equipment manufacturers (OEMs), assembly, testing, and packaging players, fabless players, and chipset manufacturers. The research study provides a pathway for stakeholders to decide primarily, which market segments to focus on in the next two to five years. Power management ic manufacturers need to focus on enabling processes to reduce the size and increase the performance of multifunctional power management ICs, by selecting an appropriate line of action, prioritizing, and aligning their efforts & investments.
The power management integrated circuits market is segmented on the basis of product type, end-use, and region.
By product type, the power management integrated circuits market is segmented into voltage regulators, motor control ICs, integrated ASSP power management ICs, battery management ICs, and others.
By end user, it is segmented into automotive and transportation, consumer electronics, industrial, telecom & networking, and others.
By region, the global power management integrated circuits market is divided into North America, Europe, Asia-Pacific, and LAMEA. North America is further segmented into the U.S., Mexico, and Canada. Europe is further segmented into the UK, Germany, Italy, France, and the rest of Europe. The countries covered under Asia-Pacific include China, India, Japan, South Korea, and the rest of Asia-Pacific. LAMEA includes Latin America, The Middle East, and Africa.
[PRODUCTTYPEGRAPH]
Get more information on this report : Request Sample Pages
With increasing energy costs and a growing focus on sustainability, there is a strong demand for energy-efficient solutions across various sectors, including consumer electronics, automotive, and industrial applications. PMICs help optimize power usage, contributing to energy savings and sustainability goalsConsumer Electronics**: The proliferation of consumer electronic devices, such as smartphones, tablets, and wearable technology, is a major driver for the power management integrated circuits market. These devices require efficient power management to enhance battery life and performance. The proliferation of consumer electronic devices, such as smartphones, tablets, and wearable technology, is a major driver for the power management ic market. These devices require efficient power management to enhance battery life and performance.
North America: North America dominates the power management ic market, driven by advanced technological adoption and a robust consumer electronics sector. The region's focus on electric vehicles and renewable energy solutions significantly boosts the demand for PMICs. Major players, including Texas Instruments and Analog Devices, are actively innovating to meet the growing market needs. The U.S. is also witnessing increasing investments in smart grid technologies, further enhancing PMIC adoption.
Asia-Pacific: The Asia-Pacific region is experiencing rapid growth in the power management integrated circuits market, fueled by the expanding consumer electronics and automotive industries. Countries such as China, Japan, and South Korea are at the forefront of PMIC innovation, driven by a high demand for smartphones, IoT devices, and electric vehicles. The presence of major semiconductor manufacturers in this region, such as Samsung and NXP Semiconductors, contributes to the region's robust market growth.
Europe: The European power management ic market is characterized by stringent energy efficiency regulations and a strong automotive industry focus, particularly in electric vehicles. Countries like Germany and France are leading the charge, with significant investments in automotive technology and renewable energy solutions. The EU's commitment to reducing carbon emissions is driving the development of advanced PMICs to support sustainable energy consumption in various applications.
Latin America & Middle East: In Latin America, the power management ic market is gradually expanding, primarily due to increasing investments in consumer electronics and automotive sectors. Brazil and Mexico are key markets, with growing interest in energy-efficient technologies. However, the market faces challenges, including economic instability and regulatory hurdles that may impact growth. The power management icmarket in the Middle East and Africa is still developing, with an increasing focus on energy efficiency and smart city initiatives. The region's investments in renewable energy and smart infrastructure are expected to drive the demand for PMICs in the coming years. However, challenges such as a lack of advanced manufacturing facilities and political instability could hinder growth.
[ENDUSEGRAPH]
Get more information on this report : Request Sample Pages
The significant impacting factors in the power management integrated circuits market include an increase in application domains of PMICs, technological advancements, a rise in demand for battery-operated devices, and growing sales of consumer electronics and automotive. However, challenges poised to develop multi-power domain SOC of PMICs are expected to hinder the market growth. Conversely, multifunctional features for PMIC-embedded application devices and growth in the semiconductor industry and semiconductor applications are projected to offer remunerative opportunities to the power management integrated circuits market. Each of these factors is anticipated to have a definite impact on the power management integrated circuits industry during the forecast period.
Competitive analysis and profiles of the major power management integrated circuits market players, such as Texas Instruments Inc., ON Semiconductor Corp., Analog Devices Inc., Dialog Semiconductor PLC, Maxim Integrated Products Inc., NXP Semiconductors, Infineon Technologies AG, Mitsubishi Group, Renesas Electronics Corporation, and STMicroelectronics N.V. are provided in this report. These key players have adopted strategies such as product portfolio expansion, mergers & acquisitions, agreements, geographical expansion, and collaborations to enhance their power management integrated circuits market penetration.
[GEOGRAPHYGRAPH]
Get more information on this report : Request Sample Pages
This report delivers in-depth insights into the power management integrated circuits market by product type, and end use, region, and key strategies employed by major players. It offers detailed power management integrated circuits market forecasts and emerging trends.
These devices are essential for providing a constant output voltage despite variations in input voltage or load conditions. They are favored in applications where low noise and simplicity are required, such as in consumer electronics and automotive systems**: DC/DC converters are crucial for converting voltage levels efficiently, making them vital for battery-powered devices, electric vehicles, and industrial applications. The increasing demand for energy-efficient solutions is driving the growth of this segment.
The automotive sector is a significant contributor to the PMIC market, driven by the transition towards electric vehicles and the integration of advanced driver-assistance systems (ADAS). PMICs are essential for managing power in electric drivetrains, infotainment systems, and safety features. In industrial applications, PMICs are utilized for automation systems, robotics, and power supply management. The push for Industry 4.0 and increased automation is propelling the adoption of PMICs in this sector.
North America leads the PMIC market due to its advanced technological ecosystem and significant investments in research and development. The United States is home to major semiconductor manufacturers such as Texas Instruments and Analog Devices. The growing adoption of electric vehicles (EVs) and renewable energy solutions is expected to further enhance the demand for PMICs in the region. The automotive industry's shift towards electrification is a key driver, with PMICs being crucial for power management in electric drivetrains and smart systems. The Asia-Pacific region is experiencing the fastest growth in the power management integrated circuits market, driven by the increasing production of consumer electronics and electric vehicles. China, Japan, and South Korea are significant players, with their strong emphasis on technological advancement and high demand for power-efficient solutions. The proliferation of IoT devices and smart appliances is also boosting the market. Local semiconductor manufacturers are investing heavily in developing advanced PMIC technologies to cater to this growing demand.
Key Market Segments
Key Market Players
Chapter 1:Introduction
1.1.Report description
1.2.Key benefits for stakeholders
1.3.Key market segments
1.4.Research methodology
1.4.1.Primary research
1.4.2.Secondary research
1.4.3.Analyst tools and models
Chapter 2:Executive summary
2.1.CXO perspective
Chapter 3:MARKET OVERVIEW
3.1.Market definition and scope
3.2.Key findings
3.2.1.Top impacting factors
3.2.2.Top investment pockets
3.2.3.Top winning strategies
3.3.Porter’s five forces analysis
3.4.Market Share Analysis, 2019
3.5.Market dynamics
3.5.1.Drivers
3.5.1.1.Technological advancements and increase in demand for battery-operated devices
3.5.1.2.Rise in sales of consumer electronics and automobiles
3.5.1.3.Growth of the semiconductor industry and semiconductor applications
3.5.1.4.Multifunctional features for PMIC-embedded application devices
3.5.1.5.Reduction in cost & area density
3.5.2.Restraints
3.5.2.1.Multi-power domain system on chip (SOC) of PMICs
3.5.3.Opportunity
3.5.3.1.Increase in application domains of PMICs
3.6.Demand and supply analysis of PMIC market
3.6.1.Wafer capacity by geographic region
3.6.2.Assembly capacity by geographic region
3.7.Covid-19 Impact Analysis on PMIC market
Chapter 4:power management integrated circuits Market, By product type
4.1.Overview
4.2.Voltage regulators
4.2.1.Key market trends, growth factors, and opportunities
4.2.2.Market size and forecast, by region
4.2.3.Market size and forecast, by subtype
4.2.3.1.Linear voltage regulators
4.2.3.2.DC/DC converters
4.2.4.Market analysis, by country
4.3.Motor control IC
4.3.1.Key market trends, growth factors, and opportunities
4.3.2.Market size and forecast, by region
4.3.3.Market analysis, by country
4.4.Integrated ASSP power management IC
4.4.1.Key market trends, growth factors, and opportunities
4.4.2.Market size and forecast, by region
4.4.3.Market analysis, by country
4.5.Battery management IC
4.5.1.Key market trends, growth factors, and opportunities
4.5.2.Market size and forecast, by region
4.5.3.Market analysis, by country
4.6.Other power management IC
4.6.1.Key market trends, growth factors, and opportunities
4.6.2.Market size and forecast, by region
4.6.3.Market analysis, by country
Chapter 5:power management integrated circuits Market, BY End Use
5.1.Overview
5.2.Automotive & transportation
5.2.1.Key market trends, growth factors, and opportunities
5.2.2.Market size and forecast, by region
5.2.3.Market analysis, by country
5.3.Consumer electronics
5.3.1.Key market trends, growth factors, and opportunities
5.3.2.Market size and forecast, by region
5.3.3.Market analysis, by country
5.4.Industrial
5.4.1.Key market trends, growth factors, and opportunities
5.4.2.Market size and forecast, by region
5.4.3.Market analysis, by country
5.5.Telecom & networking
5.5.1.Key market trends, growth factors, and opportunities
5.5.2.Market size and forecast, by region
5.5.3.Market analysis, by country
5.6.Others
5.6.1.Key market trends, growth factors, and opportunities
5.6.2.Market size and forecast, by region
5.6.3.Market analysis, by country
Chapter 6:power management integrated circuits Market, BY Region
6.1.Overview
6.2.North America
6.2.1.Key market trends, growth factors, and opportunities
6.2.2.Market size and forecast, by product type
6.2.3.Market size and forecast, by end use
6.2.4.Market analysis, by country
6.2.4.1.U.S.
6.2.4.1.1.Market size and forecast, by product type
6.2.4.1.2.Market size and forecast, by end use
6.2.4.2.Canada
6.2.4.2.1.Market size and forecast, by product type
6.2.4.2.2.Market size and forecast, by end use
6.2.4.3.Mexico
6.2.4.3.1.Market size and forecast, by product type
6.2.4.3.2.Market size and forecast, by end use
6.3.Europe
6.3.1.Key market trends, growth factors, and opportunities
6.3.2.Market size and forecast, by product type
6.3.3.Market size and forecast, by end use
6.3.4.Market analysis, by country
6.3.4.1.UK
6.3.4.1.1.Market size and forecast, by product type
6.3.4.1.2.Market size and forecast, by end use
6.3.4.2.Germany
6.3.4.2.1.Market size and forecast, by product type
6.3.4.2.2.Market size and forecast, by end use
6.3.4.3.France
6.3.4.3.1.Market size and forecast, by product type
6.3.4.3.2.Market size and forecast, by end use
6.3.4.4.Italy
6.3.4.4.1.Market size and forecast, by product type
6.3.4.4.2.Market size and forecast, by end use
6.3.4.5.Rest of Europe
6.3.4.5.1.Market size and forecast, by product type
6.3.4.5.2.Market size and forecast, by end use
6.4.Asia-Pacific
6.4.1.Key market trends, growth factors, and opportunities
6.4.2.Market size and forecast, by product type
6.4.3.Market size and forecast, by end use
6.4.4.Market analysis, by country
6.4.4.1.China
6.4.4.1.1.Market size and forecast, by product type
6.4.4.1.2.Market size and forecast, by end use
6.4.4.2.Japan
6.4.4.2.1.Market size and forecast, by product type
6.4.4.2.2.Market size and forecast, by end use
6.4.4.3.India
6.4.4.3.1.Market size and forecast, by product type
6.4.4.3.2.Market size and forecast, by end use
6.4.4.4.South Korea
6.4.4.4.1.Market size and forecast, by product type
6.4.4.4.2.Market size and forecast, by end use
6.4.4.5.Rest of Asia-Pacific
6.4.4.5.1.Market size and forecast, by product type
6.4.4.5.2.Market size and forecast, by end use
6.5.LAMEA
6.5.1.Key market trends, growth factors, and opportunities
6.5.2.Market size and forecast, by product type
6.5.3.Market size and forecast, by end use
6.5.4.Market analysis, by country
6.5.4.1.Latin America
6.5.4.1.1.Market size and forecast, by product type
6.5.4.1.2.Market size and forecast, by end use
6.5.4.2.Middle East
6.5.4.2.1.Market size and forecast, by product type
6.5.4.2.2.Market size and forecast, by end use
6.5.4.3.Africa
6.5.4.3.1.Market size and forecast, by product type
6.5.4.3.2.Market size and forecast, by end use
Chapter 7:COMPETITIVE LANDSCAPE
7.1.Introduction
7.1.1.Market player positioning, 2019
7.2.Competitive dashboard
7.3.Competitive heatmap
7.4.Key developments
7.4.1.New product launches
7.4.2.Collaborations
7.4.3.Other Developments
Chapter 8:COMPANY PROFILES
8.1.ANALOG DEVICES, INC.
8.1.1.Company overview
8.1.2.Key executives
8.1.3.Company snapshot
8.1.4.Operating business segments
8.1.5.Product portfolio
8.1.6.R&D Expenditure
8.1.7.Business performance
8.1.8.Key strategic moves and developments
8.1.9.Revenue share of PMICs end use
8.2.DIALOG SEMICONDUCTOR PLC.
8.2.1.Company overview
8.2.2.Key executives
8.2.3.Company snapshot
8.2.4.Operating business segments
8.2.5.Product portfolio
8.2.6.R&D expenditure
8.2.7.Business performance
8.2.8.Key strategic moves and developments
8.2.9.Revenue share of PMICs end use
8.3.INFINEON TECHNOLOGIES AG
8.3.1.Company overview
8.3.2.Key executives
8.3.3.Company snapshot
8.3.4.Operating business segments
8.3.5.Product portfolio
8.3.6.R&D Expenditure
8.3.7.Business performance
8.3.8.Revenue share of PMICs end use
8.4.NXP SEMICONDUCTOR
8.4.1.Company overview
8.4.2.Key executives
8.4.3.Company snapshot
8.4.4.Operating business segments
8.4.5.Product portfolio
8.4.6.R&D Expenditure
8.4.7.Business performance
8.4.8.Key strategic moves and developments
8.4.9.Revenue share of PMICs end use
8.5.MAXIM INTEGRATED PRODUCTS INC.
8.5.1.Company overview
8.5.2.Key executives
8.5.3.Company snapshot
8.5.4.Operating business segments
8.5.5.Product portfolio
8.5.6.R&D Expenditure
8.5.7.Business performance
8.5.8.Key strategic moves and developments
8.5.9.Revenue share of PMICs end use
8.6.MITSUBISHI GROUP
8.6.1.Company overview
8.6.2.Key executives
8.6.3.Company snapshot
8.6.4.Operating business segments
8.6.5.Product portfolio
8.6.6.R&D expenditure
8.6.7.Business performance
8.6.8.Key strategic moves and developments
8.6.9.Revenue share of PMICs end use
8.7.ON SEMICONDUCTOR CORPORATION
8.7.1.Company overview
8.7.2.Key executives
8.7.3.Company snapshot
8.7.4.Operating business segments
8.7.5.Product portfolio
8.7.6.R&D expenditure
8.7.7.Business performance
8.7.8.Key strategic moves and developments
8.7.9.Revenue share of PMICs end use
8.8.RENESAS ELECTRONICS CORPORATION
8.8.1.Company overview
8.8.2.Key executives
8.8.3.Company snapshot
8.8.4.Operating business segments
8.8.5.Product portfolio
8.8.6.R&D expenditure
8.8.7.Business performance
8.8.8.Key strategic moves and developments
8.8.9.Revenue share of PMICs end use
8.9.STMICROELECTRONICS N.V.
8.9.1.Company overview
8.9.2.Key executives
8.9.3.Company snapshot
8.9.4.Operating business segments
8.9.5.Product portfolio
8.9.6.R&D Expenditure
8.9.7.Business performance
8.9.8.Revenue share of PMICs end use
8.10.TEXAS INSTRUENTS, INC.
8.10.1.Company overview
8.10.2.Key executives
8.10.3.Company snapshot
8.10.4.Operating business segments
8.10.5.Product portfolio
8.10.6.R&D Expenditure
8.10.7.Business performance
8.10.8.Key strategic moves and developments
8.10.9.Revenue share of PMICs end use
LIST OF TABLES
TABLE 01.GLOBAL POWER MANAGEMENT INTEGRATED CIRCUITS MARKET REVENUE, BY PRODUCT TYPE, 2019-2027 ($MILLION)
TABLE 02.GLOBAL POWER MANAGEMENT INTEGRATED CIRCUITS MARKET VOLUME, BY PRODUCT TYPE, 2019-2027 (MILLION UNITS)
TABLE 03.VOLTAGE REGULATORS POWER MANAGEMENT INTEGRATED CIRCUITS MARKET REVENUE, BY REGION, 2019-2027 ($MILLION)
TABLE 04.VOLTAGE REGULATORS POWER MANAGEMENT INTEGRATED CIRCUITS MARKET VOLUME, BY REGION, 2019-2027 (MILLION UNITS)
TABLE 05.VOLTAGE REGULATORS POWER MANAGEMENT INTEGRATED CIRCUITS MARKET REVENUE, BY SUB TYPE, 2019-2027 ($MILLION)
TABLE 06.MOTOR CONTROL POWER MANAGEMENT INTEGRATED CIRCUITS MARKET REVENUE, BY REGION 2019-2027 ($MILLION)
TABLE 07.MOTOR CONTROL POWER MANAGEMENT INTEGRATED CIRCUITS MARKET VOLUME, BY REGION 2019-2027 (MILLION UNITS)
TABLE 08.INTEGRATED ASSP POWER MANAGEMENT INTEGRATED CIRCUITS MARKET REVENUE, BY REGION 2019-2027 ($MILLION)
TABLE 09.INTEGRATED ASSP POWER MANAGEMENT INTEGRATED CIRCUITS MARKET VOLUME, BY REGION 2019-2027 (MILLION UNITS)
TABLE 10.BATTERY MANAGEMENT INTEGRATED CIRCUITS MARKET REVENUE, BY REGION 2019-2027 ($MILLION)
TABLE 11.BATTERY MANAGEMENT INTEGRATED CIRCUITS MARKET VOLUME, BY REGION 2019-2027 (MILLION UNITS)
TABLE 12.OTHER POWER MANAGEMENT INTEGRATED CIRCUITS MARKET, BY REGION 2019-2027 ($MILLION)
TABLE 13.OTHER POWER MANAGEMENT INTEGRATED CIRCUITS MARKET, BY REGION 2019-2027 ($MILLION)
TABLE 14.GLOBAL POWER MANAGEMENT INTEGRATED CIRCUITS MARKET, BY END USE, 2019-2027($MILLION)
TABLE 15.POWER MANAGEMENT INTEGRATED CIRCUITS MARKET FOR AUTOMOTIVE AND TRANSPORTATION, BY REGION 2019-2027 ($MILLION)
TABLE 16.POWER MANAGEMENT INTEGRATED CIRCUITS MARKET FOR CONSUMER ELECTRONICS, BY REGION 2019-2027 ($MILLION)
TABLE 17.POWER MANAGEMENT INTEGRATED CIRCUITS MARKET FOR INDUSTRIAL, BY REGION 2019-2027 ($MILLION)
TABLE 18.POWER MANAGEMENT INTEGRATED CIRCUITS MARKET FOR TELECOM & NETWORKING, BY REGION 2019-2027 ($MILLION)
TABLE 19.POWER MANAGEMENT INTEGRATED CIRCUITS MARKET FOR OTHERS, BY REGION 2019-2027 ($MILLION)
TABLE 20.POWER MANAGEMENT INTEGRATED CIRCUITS MARKET REVENUE, BY REGION, 2019–2027 ($MILLION)
TABLE 21.NORTH AMERICA POWER MANAGEMENT INTEGRATED CIRCUITS MARKET, BY PRODUCT TYPE, 2019–2027 ($MILLION)
TABLE 22.NORTH AMERICA POWER MANAGEMENT INTEGRATED CIRCUITS MARKET, BY END USE, 2019–2027 ($MILLION)
TABLE 23.U.S. POWER MANAGEMENT INTEGRATED CIRCUITS MARKET, BY PRODUCT TYPE, 2019–2027 ($MILLION)
TABLE 24.U.S. POWER MANAGEMENT INTEGRATED CIRCUITS MARKET, BY END USE, 2019–2027 ($MILLION)
TABLE 25.CANADA POWER MANAGEMENT INTEGRATED CIRCUITS MARKET, BY PRODUCT TYPE, 2019–2027 ($MILLION)
TABLE 26.CANADA POWER MANAGEMENT INTEGRATED CIRCUITS MARKET, BY END USE, 2019–2027 ($MILLION)
TABLE 27.MEXICO POWER MANAGEMENT INTEGRATED CIRCUITS MARKET, BY PRODUCT TYPE, 2019–2027 ($MILLION)
TABLE 28.MEXICO POWER MANAGEMENT INTEGRATED CIRCUITS MARKET, BY END USE, 2019–2027 ($MILLION)
TABLE 29.EUROPE POWER MANAGEMENT INTEGRATED CIRCUITS MARKET, BY PRODUCT TYPE, 2019–2027 ($MILLION)
TABLE 30.EUROPE POWER MANAGEMENT INTEGRATED CIRCUITS MARKET, BY END USE, 2019–2027 ($MILLION)
TABLE 31.UK POWER MANAGEMENT INTEGRATED CIRCUITS MARKET, BY PRODUCT TYPE, 2019–2027 ($MILLION)
TABLE 32.UK POWER MANAGEMENT INTEGRATED CIRCUITS MARKET, BY END USE, 2019–2027 ($MILLION)
TABLE 33.GERMANY POWER MANAGEMENT INTEGRATED CIRCUITS MARKET, BY PRODUCT TYPE, 2019–2027 ($MILLION)
TABLE 34.GERMANY POWER MANAGEMENT INTEGRATED CIRCUITS MARKET, BY END USE, 2019–2027 ($MILLION)
TABLE 35.FRANCE POWER MANAGEMENT INTEGRATED CIRCUITS MARKET, BY PRODUCT TYPE, 2019–2027 ($MILLION)
TABLE 36.FRANCE POWER MANAGEMENT INTEGRATED CIRCUITS MARKET, BY END USE, 2019–2027 ($MILLION)
TABLE 37.ITALY POWER MANAGEMENT INTEGRATED CIRCUITS MARKET, BY PRODUCT TYPE, 2019–2027 ($MILLION)
TABLE 38.ITALY POWER MANAGEMENT INTEGRATED CIRCUITS MARKET, BY END USE, 2019–2027 ($MILLION)
TABLE 39.REST OF EUROPE POWER MANAGEMENT INTEGRATED CIRCUITS MARKET, BY PRODUCT TYPE, 2019–2027 ($MILLION)
TABLE 40.REST OF EUROPE POWER MANAGEMENT INTEGRATED CIRCUITS MARKET, BY END USE, 2019–2027 ($MILLION)
TABLE 41.ASIA-PACIFIC POWER MANAGEMENT INTEGRATED CIRCUITS MARKET, BY PRODUCT TYPE, 2019–2027 ($MILLION)
TABLE 42.ASIA-PACIFIC POWER MANAGEMENT INTEGRATED CIRCUITS MARKET, BY END USE, 2019–2027 ($MILLION)
TABLE 43.CHINA POWER MANAGEMENT INTEGRATED CIRCUITS MARKET, BY PRODUCT TYPE, 2019–2027 ($MILLION)
TABLE 44.CHINA POWER MANAGEMENT INTEGRATED CIRCUITS MARKET, BY END USE, 2019–2027 ($MILLION)
TABLE 45.JAPAN POWER MANAGEMENT INTEGRATED CIRCUITS MARKET, BY PRODUCT TYPE, 2019–2027 ($MILLION)
TABLE 46.JAPAN POWER MANAGEMENT INTEGRATED CIRCUITS MARKET, BY END USE, 2019–2027 ($MILLION)
TABLE 47.INDIA POWER MANAGEMENT INTEGRATED CIRCUITS MARKET, BY PRODUCT TYPE, 2019–2027 ($MILLION)
TABLE 48.INDIA POWER MANAGEMENT INTEGRATED CIRCUITS MARKET, BY END USE, 2019–2027 ($MILLION)
TABLE 49.SOUTH KOREA POWER MANAGEMENT INTEGRATED CIRCUITS MARKET, BY PRODUCT TYPE, 2019–2027 ($MILLION)
TABLE 50.SOUTH KOREA POWER MANAGEMENT INTEGRATED CIRCUITS MARKET, BY END USE, 2019–2027 ($MILLION)
TABLE 51.REST OF ASIA-PACIFIC POWER MANAGEMENT INTEGRATED CIRCUITS MARKET, BY PRODUCT TYPE, 2019–2027 ($MILLION)
TABLE 52.REST OF ASIA-PACIFIC POWER MANAGEMENT INTEGRATED CIRCUITS MARKET, BY END USE, 2019–2027 ($MILLION)
TABLE 53.LAMEA POWER MANAGEMENT INTEGRATED CIRCUITS MARKET, BY PRODUCT TYPE, 2019–2027 ($MILLION)
TABLE 54.LAMEA POWER MANAGEMENT INTEGRATED CIRCUITS MARKET, BY END USE, 2019–2027 ($MILLION)
TABLE 55.LATIN AMERICA POWER MANAGEMENT INTEGRATED CIRCUITS MARKET, BY PRODUCT TYPE, 2019–2027 ($MILLION)
TABLE 56.LATIN AMERICA POWER MANAGEMENT INTEGRATED CIRCUITS MARKET, BY END USE, 2019–2027 ($MILLION)
TABLE 57.MIDDLE EAST POWER MANAGEMENT INTEGRATED CIRCUITS MARKET, BY PRODUCT TYPE, 2019–2027 ($MILLION)
TABLE 58.MIDDLE EAST POWER MANAGEMENT INTEGRATED CIRCUITS MARKET, BY END USE, 2019–2027 ($MILLION)
TABLE 59.AFRICA POWER MANAGEMENT INTEGRATED CIRCUITS MARKET, BY PRODUCT TYPE, 2019–2027 ($MILLION)
TABLE 60.AFRICA POWER MANAGEMENT INTEGRATED CIRCUITS MARKET, BY END USE, 2019–2027 ($MILLION)
TABLE 61.KEY NEW PRODUCT LAUNCHES (2018-2020)
TABLE 62.KEY COLLABORATIONS (2018-2020)
TABLE 63.OTHER DEVELOPMENTS (2018 – 2020)
TABLE 64.KEY EXECUTIVES
TABLE 65.ANALOG DEVICES, INC.: COMPANY SNAPSHOT
TABLE 66.ANALOG DEVICES, INC.: OPERATING SEGMENTS
TABLE 67.ANALOG DEVICES, INC.: PRODUCT PORTFOLIO
TABLE 68.KEY EXECUTIVES
TABLE 69.DIALOG SEMICONDUCTOR PLC.: COMPANY SNAPSHOT
TABLE 70.DIALOG SEMICONDUCTOR PLC.: OPERATING SEGMENTS
TABLE 71.DIALOG SEMICONDUCTOR PLC.: PRODUCT PORTFOLIO
TABLE 72.KEY EXECUTIVES
TABLE 73.INFINEON TECHNOLOGIES: COMPANY SNAPSHOT
TABLE 74.INFINEON TECHNOLOGIES: OPERATING SEGMENTS
TABLE 75.INFINEON TECHNOLOGIES: PRODUCT PORTFOLIO
TABLE 76.KEY EXECUTIVES
TABLE 77.NXP SEMICONDUCTOR: COMPANY SNAPSHOT
TABLE 78.NXP SEMICONDUCTOR: OPERATING SEGMENTS
TABLE 79.NXP SEMICONDUCTOR: PRODUCT PORTFOLIO
TABLE 80.KEY EXECUTIVES
TABLE 81.MAXIM: COMPANY SNAPSHOT
TABLE 82.MAXIM: OPERATING SEGMENTS
TABLE 83.MAXIM: PRODUCT PORTFOLIO
TABLE 84.KEY EXECUTIVES
TABLE 85.MITSUBISHI: COMPANY SNAPSHOT
TABLE 86.MITSUBISHI: OPERATING SEGMENTS
TABLE 87.MITSUBISHI: PRODUCT PORTFOLIO
TABLE 88.KEY EXECUTIVES
TABLE 89.ON SEMICONDUCTOR: COMPANY SNAPSHOT
TABLE 90.ON SEMICONDUCTOR: OPERATING SEGMENTS
TABLE 91.ON SEMICONDUCTOR: PRODUCT PORTFOLIO
TABLE 92.KEY EXECUTIVES
TABLE 93.RENESAS: COMPANY SNAPSHOT
TABLE 94.RENESAS: OPERATING SEGMENTS
TABLE 95.RENESAS: PRODUCT PORTFOLIO
TABLE 96.KEY EXECUTIVES
TABLE 97.STMICROELECTRONICS: COMPANY SNAPSHOT
TABLE 98.STMICROELECTRONICS: OPERATING SEGMENTS
TABLE 99.STMICROELECTRONICS: PRODUCT PORTFOLIO
TABLE 100.KEY EXECUTIVES
TABLE 101.TEXAS INSTRUMENTS: COMPANY SNAPSHOT
TABLE 102.TEXAS INSTRUMENTS: OPERATING SEGMENTS
TABLE 103.TEXAS INSTRUMENTS: PRODUCT PORTFOLIO
LIST OF FIGURES
FIGURE 01.KEY MARKET SEGMENTS
FIGURE 02.EXECUTIVE SUMMARY, BY SEGMENTATION
FIGURE 03.EXECUTIVE SUMMARY, BY REGION
FIGURE 04.TOP IMPACTING FACTORS
FIGURE 05.TOP INVESTMENT POCKETS
FIGURE 06.TOP WINNING STRATEGIES, BY YEAR, 2018-2020*
FIGURE 07.TOP WINNING STRATEGIES, BY DEVELOPMENT, 2018-2020*
FIGURE 08.TOP WINNING STRATEGIES, BY COMPANY, 2018-2020*
FIGURE 09.MODERATE BARGAINING POWER OF SUPPLIERS
FIGURE 10.LOW TO MODERATE THREAT OF NEW ENTRANTS
FIGURE 11.MODERATE THREAT OF SUBSTITUTES
FIGURE 12.MODERATE TO HIGH INTENSITY OF RIVALRY
FIGURE 13.LOW BARGAINING POWER OF BUYERS
FIGURE 14.NUMBER OF MOBILE CELLULAR SUBSCRIPTIONS (PER 100 PEOPLE), 2010-2018
FIGURE 15.GLOBAL MOBILE CELLULAR PHONES PENETRATION (IN MILLION UNITS), 2010-2017
FIGURE 16.GLOBAL SEMICONDUCTOR SALES ($BILLION), 2016-2022
FIGURE 17.GLOBAL POWER MANAGEMENT INTEGRATED CIRCUITS MARKET SHARE, BY PRODUCT TYPE, 2019–2027 (%)
FIGURE 18.COMPARATIVE SHARE ANALYSIS VOLTAGE REGULATORS POWER MANAGEMENT INTEGRATED CIRCUITS MARKET, BY COUNTRY, 2019 & 2027 (%)
FIGURE 19.COMPARATIVE SHARE ANALYSIS MOTOR CONTROL POWER MANAGEMENT INTEGRATED CIRCUITS MARKET, BY COUNTRY, 2019 & 2027 (%)
FIGURE 20.COMPARATIVE SHARE ANALYSIS INTEGRATED ASSP POWER MANAGEMENT INTEGRATED CIRCUITS MARKET, BY COUNTRY, 2019 & 2027 (%)
FIGURE 21.COMPARATIVE SHARE ANALYSIS BATTERY MANAGEMENT INTEGRATED CIRCUITS MARKET, BY COUNTRY, 2019 & 2027 (%)
FIGURE 22.COMPARATIVE SHARE ANALYSIS OTHER POWER MANAGEMENT INTEGRATED CIRCUITS MARKET, BY COUNTRY, 2019 & 2027 (%)
FIGURE 23.GLOBAL POWER MANAGEMENT INTEGRATED CIRCUITS MARKET SHARE, BY END USE, 2019–2027 (%)
FIGURE 24.COMPARATIVE SHARE ANALYSIS OF POWER MANAGEMENT INTEGRATED CIRCUITS MARKET FOR AUTOMOTIVE AND TRANSPORTATION, BY COUNTRY, 2019 & 2027 (%)
FIGURE 25.COMPARATIVE SHARE ANALYSIS OF POWER MANAGEMENT INTEGRATED CIRCUITS MARKET FOR CONSUMER ELECTRONICS, BY COUNTRY, 2019 & 2027 (%)
FIGURE 26.COMPARATIVE SHARE ANALYSIS OF POWER MANAGEMENT INTEGRATED CIRCUITS MARKET FOR INDUSTRIAL, BY COUNTRY, 2019 & 2027 (%)
FIGURE 27.COMPARATIVE SHARE ANALYSIS OF POWER MANAGEMENT INTEGRATED CIRCUITS MARKET FOR TELECOM & NETWORKING, BY COUNTRY, 2019 & 2027 (%)
FIGURE 28.COMPARATIVE SHARE ANALYSIS OF POWER MANAGEMENT INTEGRATED CIRCUITS MARKET FOR OTHERS, BY COUNTRY, 2019 & 2027 (%)
FIGURE 29.POWER MANAGEMENT INTEGRATED CIRCUITS MARKET, BY REGION, 2019-2027 (%)
FIGURE 30.COMPARATIVE SHARE ANALYSIS OF NORTH AMERICA POWER MANAGEMENT INTEGRATED CIRCUITS MARKET, BY COUNTRY, 2019–2027 (%)
FIGURE 31.U.S. POWER MANAGEMENT INTEGRATED CIRCUITS MARKET, 2019–2027 ($MILLION)
FIGURE 32.CANADA POWER MANAGEMENT INTEGRATED CIRCUITS MARKET, 2019–2027 ($MILLION)
FIGURE 33.MEXICO POWER MANAGEMENT INTEGRATED CIRCUITS MARKET, 2019–2027 ($MILLION)
FIGURE 34.COMPARATIVE SHARE ANALYSIS OF EUROPE POWER MANAGEMENT INTEGRATED CIRCUITS MARKET, BY COUNTRY, 2019–2027 (%)
FIGURE 35.UK POWER MANAGEMENT INTEGRATED CIRCUITS MARKET, 2019–2027 ($MILLION)
FIGURE 36.GERMANY POWER MANAGEMENT INTEGRATED CIRCUITS MARKET, 2019–2027 ($MILLION)
FIGURE 37.FRANCE POWER MANAGEMENT INTEGRATED CIRCUITS MARKET, 2019–2027 ($MILLION)
FIGURE 38.ITALY POWER MANAGEMENT INTEGRATED CIRCUITS MARKET, 2019–2027 ($MILLION)
FIGURE 39.REST OF EUROPE POWER MANAGEMENT INTEGRATED CIRCUITS MARKET, 2019–2027 ($MILLION)
FIGURE 40.COMPARATIVE SHARE ANALYSIS OF ASIA-PACIFIC POWER MANAGEMENT INTEGRATED CIRCUITS MARKET, BY COUNTRY, 2019–2027 (%)
FIGURE 41.CHINA POWER MANAGEMENT INTEGRATED CIRCUITS MARKET, 2019–2027 ($MILLION)
FIGURE 42.JAPAN POWER MANAGEMENT INTEGRATED CIRCUITS MARKET, 2019–2027 ($MILLION)
FIGURE 43.INDIA POWER MANAGEMENT INTEGRATED CIRCUITS MARKET, 2019–2027 ($MILLION)
FIGURE 44.SOUTH KOREA POWER MANAGEMENT INTEGRATED CIRCUITS MARKET, 2019–2027 ($MILLION)
FIGURE 45.REST OF ASIA-PACIFIC POWER MANAGEMENT INTEGRATED CIRCUITS MARKET, 2019–2027 ($MILLION)
FIGURE 46.COMPARATIVE SHARE ANALYSIS OF LAMEA POWER MANAGEMENT INTEGRATED CIRCUITS MARKET, BY COUNTRY, 2019–2027 (%)
FIGURE 47.LATIN AMERICA POWER MANAGEMENT INTEGRATED CIRCUITS MARKET, 2019–2027 ($MILLION)
FIGURE 48.MIDDLE EAST POWER MANAGEMENT INTEGRATED CIRCUITS MARKET, 2019–2027 ($MILLION)
FIGURE 49.AFRICA POWER MANAGEMENT INTEGRATED CIRCUITS MARKET, 2019–2027 ($MILLION)
FIGURE 50.MARKET PLAYER POSITIONING, 2019
FIGURE 51.COMPETITIVE DASHBOARD
FIGURE 52.COMPETITIVE HEATMAP OF KEY PLAYERS
FIGURE 53.ANALOG DEVICES, INC., 2017–2019 ($MILLION)
FIGURE 54.ANALOG DEVICES, INC.: REVENUE, 2017–2019 ($MILLION)
FIGURE 55.ANALOG DEVICES, INC.: REVENUE SHARE BY SEGMENT, 2019 (%)
FIGURE 56.ANALOG DEVICES, INC.: REVENUE SHARE BY TARGET MARKET, 2019 (%)
FIGURE 57.DIALOG SEMICONDUCTOR PLC., 2017–2019 ($MILLION)
FIGURE 58.DIALOG SEMICONDUCTOR PLC: REVENUE, 2017–2019 ($MILLION)
FIGURE 59.DIALOG SEMICONDUCTOR PLC: REVENUE SHARE BY SEGMENT, 2019 (%)
FIGURE 60.DIALOG SEMICONDUCTOR PLC: REVENUE SHARE BY TARGET MARKET, 2019 (%)
FIGURE 61.INFINEON TECHNOLOGIES, 2017–2019 ($MILLION)
FIGURE 62.INFINEON TECHNOLOGIES: REVENUE, 2017–2019 ($MILLION)
FIGURE 63.INFINEON TECHNOLOGIES: REVENUE SHARE BY SEGMENT, 2019 (%)
FIGURE 64.INFINEON TECHNOLOGIES: REVENUE SHARE BY TARGET MARKET, 2019 (%)
FIGURE 65.NXP SEMICONDUCTOR, 2017–2019 ($MILLION)
FIGURE 66.NXP SEMICONDUCTOR: REVENUE, 2017–2019 ($MILLION)
FIGURE 67.NXP SEMICONDUCTOR: REVENUE SHARE BY SEGMENT, 2019 (%)
FIGURE 68.NXP SEMICONDUCTOR: REVENUE SHARE BY TARGET MARKET, 2019 (%)
FIGURE 69.MAXIM, 2017–2019 ($MILLION)
FIGURE 70.MAXIM: REVENUE, 2017–2019 ($MILLION)
FIGURE 71.MAXIM: REVENUE SHARE BY SEGMENT, 2019 (%)
FIGURE 72.MAXIM: REVENUE SHARE BY TARGET MARKET, 2019 (%)
FIGURE 73.MITSUBISHI, 2017–2019 ($MILLION)
FIGURE 74.MITSUBISHI: REVENUE, 2017–2019 ($MILLION)
FIGURE 75.MITSUBISHI: REVENUE SHARE BY SEGMENT, 2019 (%)
FIGURE 76.MITSUBISHI: REVENUE SHARE BY TARGET MARKET, 2019 (%)
FIGURE 77.ON SEMICONDUCTOR, 2017–2019 ($MILLION)
FIGURE 78.ON SEMICONDUCTOR: REVENUE, 2017–2019 ($MILLION)
FIGURE 79.ON SEMICONDUCTOR: REVENUE SHARE BY SEGMENT, 2019 (%)
FIGURE 80.ON SEMICONDUCTOR: REVENUE SHARE BY TARGET MARKET, 2019 (%)
FIGURE 81.RENESAS, 2017–2019 ($MILLION)
FIGURE 82.RENESAS: REVENUE, 2017–2019 ($MILLION)
FIGURE 83.RENESAS: REVENUE SHARE BY SEGMENT, 2019 (%)
FIGURE 84.RENESAS: REVENUE SHARE BY TARGET MARKET, 2019 (%)
FIGURE 85.STMICROELECTRONICS, 2017–2019 ($MILLION)
FIGURE 86.STMICROELECTRONICS: REVENUE, 2018–2019 ($MILLION)
FIGURE 87.STMICROELECTRONICS: REVENUE SHARE BY SEGMENT, 2019 (%)
FIGURE 88.STMICROELECTRONICS: REVENUE SHARE BY TARGET MARKET, 2019 (%)
FIGURE 89.TEXAS INSTRUMENTS, 2017–2019 ($MILLION)
FIGURE 90.TEXAS INSTRUMENTS: REVENUE, 2018–2019 ($MILLION)
FIGURE 91.TEXAS INSTRUMENTS: REVENUE SHARE BY SEGMENT, 2019 (%)
FIGURE 92.TEXAS INSTRUMENTS: REVENUE SHARE BY TARGET MARKET, 2019 (%)