Int'l : +1-503-894-6022 | Toll Free : +1-800-792-5285 | help@alliedmarketresearch.com
A03411 | Pages: 219 | Charts: 44 | Tables: 117 |
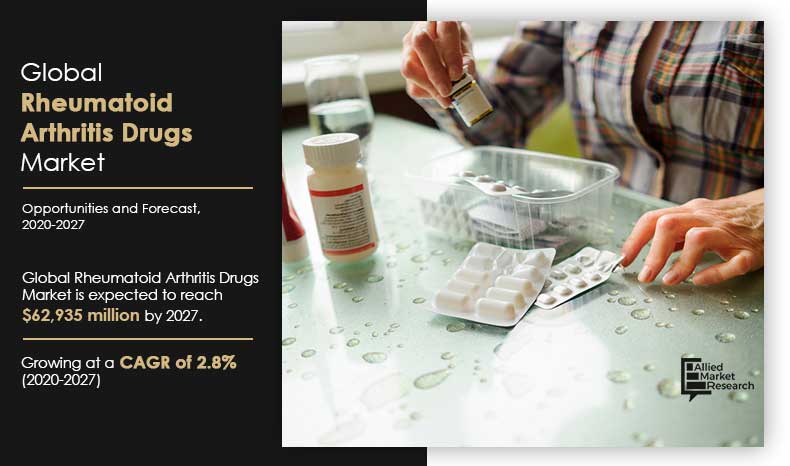
The global rheumatoid arthritis drugs market size was valued at $57,929 million in 2019, and is projected to reach $62,935 million by 2027, registering a CAGR of 2.8% from 2020 to 2027.
Rheumatoid arthritis is a disease that causes pain and inflammation in joints. It affects individuals of all ages; however, the geriatric population is highly susceptible to develop this disease. The symptoms of rheumatoid arthritis include pain, stiffness, tender, and swelling of joints. Currently, no cure is available for rheumatoid arthritis. However, certain drugs are used to efficiently control the conditions of rheumatoid arthritis, which include disease-modifying anti-rheumatic drugs (DMARDs), nonsteroidal anti-inflammatory drugs (NSAIDs), corticosteroids, and uric acid drugs.
Get more information on this report : Request Sample Pages
Rise in prevalence of rheumatoid arthritis, increase in demand for rheumatoid arthritis drugs, expiration of patents & the entry of biosimilar drugs, surge in geriatric population, increase in adoption of conventional DMARDs, and government initiatives toward spread in awareness for rheumatoid arthritis symptoms are the major factors that drive growth of the rheumatoid arthritis drugs market. In addition, innovations in advanced biologics, rise in healthcare expenditure, improvement in buying power, and access to quality drugs to poor & middle-class families globally are some other factors that contribute toward growth of the market. However, side effects associated with the medication and high costs of biological DMARD therapies are expected to act as the key restraints of the global market. On the contrary, rise in awareness related to early screening and treatment of rheumatoid arthritis is anticipated to offer high growth potential for the rheumatoid arthritis drugs market during the forecast period.
The World Health Organization (WHO) on January 30, 2020 declared COVID-19 outbreak a public health emergency of international concern. COVID-19 has affected around 210 countries across the globe. According to the Lancet Rheumatology 2020, patients with rheumatoid arthritis who develop COVID-19 infection may be at high risk for developing severe symptoms and additional complications. Some DMARDs commonly used to treat rheumatoid arthritis, such as hydroxychloroquine drug, are being investigated as potential therapy for COVID-19. Moreover, other generally used therapies such as biologics targeting interleukin (IL)-6 (sarilumab, tocilizumab) and IL-1 (anakinra) are being assessed in patients with COVID-19. Thus, COVID-19 infection uplifted growth opportunities for manufacturers of rheumatoid arthritis drugs during the forecast period.
The global rheumatoid arthritis drugs market is segmented into drug class, route of administration, sales channel, and region. Depending on drug class, the market is categorized into disease-modifying anti-rheumatic drugs (DMARDs), nonsteroidal anti-inflammatory drugs (NSAIDs), corticosteroids, uric acid drugs, and others. By route of administration, it is segregated into oral and parenteral. On the basis of sales channel, it is fragmented into prescription-based drugs and over-the-counter drugs. Region wise, the market is analyzed across North America, Europe, Asia-Pacific, and LAMEA.
[DRUGCLASSGRAPH]
Get more information on this report : Request Sample Pages
Presently, on the basis of drug class, the disease-modifying anti-rheumatic drugs (DMARDs) is the major revenue contributor, and is projected to grow significantly during the forecast period. Rise in awareness related to the use of DMARDs, surge in prevalence of rheumatoid arthritis, rise in obese & overweight population across the globe, and increase in adoption of DMARDs as a first-line treatment for rheumatoid arthritis are the key factors that boost growth of the segment.
Depending on sales channel, the prescription-based drugs segment is the major shareholder in the global rheumatoid arthritis drugs market, owing to advantages offered by prescription-based drugs such as patients gets the correct dosage of the drug during the treatment of rheumatoid arthritis, without causing any side effects, and it prevents the potential scope of drug misuse. However, the OTC drugs segment is expected to exhibit the fastest growth rate during the forecast period, owing to convenience of direct purchase and increase in innovations & developments in OTC drugs.
[SALESCHANNELGRAPH]
Get more information on this report : Request Sample Pages
Asia-Pacific presents lucrative opportunities for key players operating in the rheumatoid arthritis drugs market, owing to the presence of large population base susceptible to rheumatoid arthritis, increase in public awareness toward use & benefits of these drugs, development of the R&D sector, rise in healthcare reforms, and increase in adoption of rheumatoid arthritis drugs. Moreover, increase in demand for DMARDs and rise in geriatric population contribute toward growth of the market. Moreover, surge in focus of leading manufacturers on expanding their geographical presence in emerging Asia-Pacific countries to capture high rheumatoid arthritis drugs market share is expected to drive growth of the market in the region.
The key players profiled in this report include AbbVie Inc., Amgen Inc., Bristol-Myers Squibb Company, Eli Lilly and Company, F. Hoffmann-La Roche Ltd, Johnson & Johnson, Merck & Co., Inc., Novartis AG, Pfizer Inc., and UCB S.A.
[REGIONGRAPH]
Get more information on this report : Request Sample Pages
Key Benefits For Stakeholders
Key Market Segments
Key Market Players
CHAPTER 1:INTRODUCTION
1.1.Report description
1.2.Key benefits for stakeholders
1.3.Key market segments
1.3.1.List of key players profiled in the report
1.4.Research methodology
1.4.1.Secondary research
1.4.2.Primary research
1.4.3.Analyst tools and models
CHAPTER 2:EXECUTIVE SUMMARY
2.1.Key findings of the study
2.2.CXO perspective44
CHAPTER 3:MARKET OVERVIEW
3.1.Market definition and scope
3.2.Key findings
3.2.1.Top investment pockets
3.3.Top player positioning, 2019
3.4.Porter’s five force analysis
3.5.Market dynamics
3.5.1.Drivers
3.5.1.1.Surge in geriatric population across the globe
3.5.1.2.Increase in healthcare expenditure worldwide
3.5.1.3.Rise in prevalence of rheumatoid arthritis across the globe
3.5.2.Restraint
3.5.2.1.Lack of access to treatment of rheumatoid arthritis in underdeveloped countries
3.5.3.Opportunity
3.5.3.1.High growth potential in emerging markets
3.5.4.Impact analysis
3.6.Covid-19 impact analysis on rheumatoid arthritis drugs market
CHAPTER 4:RHEUMATOID ARTHRITIS DRUGS MARKET, BY DRUG CLASS
4.1.Overview
4.1.1.Market size and forecast
4.2.Disease-modifying anti-rheumatic drugs
4.2.1.Key market trends, growth factors, and opportunities
4.2.2.Market size and forecast, by region
4.2.3.Market analysis, by country
4.3.Nonsteroidal anti-inflammatory drugs
4.3.1.Key market trends, growth factors, and opportunities
4.3.2.Market size and forecast
4.3.3.Market analysis, by country
4.4.Corticosteroids
4.4.1.Key market trends, growth factors, and opportunities
4.4.2.Market size and forecast
4.4.3.Market analysis, by country
4.5.Uric acid drugs
4.5.1.Key market trends, growth factors, and opportunities
4.5.2.Market size and forecast
4.5.3.Market analysis, by country
4.6.Others
4.6.1.Key market trends, growth factors, and opportunities
4.6.2.Market size and forecast
4.6.3.Market analysis, by country
CHAPTER 5:RHEUMATOID ARTHRITIS DRUGS MARKET, BY ROUTE OF ADMINISTRATION
5.1.Overview
5.1.1.Market size and forecast
5.2.Oral
5.2.1.Market size and forecast, by region
5.2.2.Market analysis, by country
5.3.Parenteral
5.3.1.Market size and forecast, by region
5.3.2.Market analysis, by country
CHAPTER 6:RHEUMATOID ARTHRITIS DRUGS MARKET, BY SALES CHANNEL
6.1.Overview
6.1.1.Market size and forecast
6.2.Prescription-based drugs
6.2.1.Market size and forecast, by region
6.2.2.Market analysis, by country
6.3.Over-the-counter drugs
6.3.1.Market size and forecast, by region
6.3.2.Market analysis, by country
CHAPTER 7:RHEUMATOID ARTHRITIS DRUGS MARKET, BY REGION
7.1.Overview
7.1.1.Market size and forecast
7.2.North America
7.2.1.Key market trends, growth factors, and opportunities
7.2.2.Market size and forecast, by country
7.2.2.1.U.S.
7.2.2.1.1.U.S. rheumatoid arthritis drugs market, by drug class
7.2.2.1.2.U.S. rheumatoid arthritis drugs market, by route of administration
7.2.2.1.3.U.S. rheumatoid arthritis drugs market, by sales channel
7.2.2.2.Canada
7.2.2.2.1.Canada rheumatoid arthritis drugs market, by drug class
7.2.2.2.2.Canada rheumatoid arthritis drugs market, by route of administration
7.2.2.2.3.Canada rheumatoid arthritis drugs market, by sales channel
7.2.2.3.Mexico
7.2.2.3.1.Mexico rheumatoid arthritis drugs market, by drug class
7.2.2.3.2.Mexico rheumatoid arthritis drugs market, by route of administration
7.2.2.3.3.Mexico rheumatoid arthritis drugs market, by sales channel
7.2.3.North America market size and forecast, by drug class
7.2.4.North America market size and forecast, by route of administration
7.2.5.North America market size and forecast, by sales channel
7.3.Europe
7.3.1.Key market trends, growth factors, and opportunities
7.3.2.Market size and forecast, by country
7.3.2.1.Germany
7.3.2.1.1.Germany rheumatoid arthritis drugs market, by drug class
7.3.2.1.2.Germany rheumatoid arthritis drugs market, by route of administration
7.3.2.1.3.Germany rheumatoid arthritis drugs market, by sales channel
7.3.2.2.France
7.3.2.2.1.France rheumatoid arthritis drugs market, by drug class
7.3.2.2.2.France rheumatoid arthritis drugs market, by route of administration
7.3.2.2.3.France rheumatoid arthritis drugs market, by sales channel
7.3.2.3.UK
7.3.2.3.1.UK rheumatoid arthritis drugs market, by drug class
7.3.2.3.2.UK rheumatoid arthritis drugs market, by route of administration
7.3.2.3.3.UK rheumatoid arthritis drugs market, by sales channel
7.3.2.4.Italy
7.3.2.4.1.Italy rheumatoid arthritis drugs market, by drug class
7.3.2.4.2.Italy rheumatoid arthritis drugs market, by route of administration
7.3.2.4.3.Italy rheumatoid arthritis drugs market, by sales channel
7.3.2.5.Spain
7.3.2.5.1.Spain rheumatoid arthritis drugs market, by drug class
7.3.2.5.2.Spain rheumatoid arthritis drugs market, by route of administration
7.3.2.5.3.Spain rheumatoid arthritis drugs market, by sales channel
7.3.2.6.Rest of Europe
7.3.2.6.1.Rest of Europe rheumatoid arthritis drugs market, by drug class
7.3.2.6.2.Rest of Europe rheumatoid arthritis drugs market, by route of administration
7.3.2.6.3.Rest of Europe rheumatoid arthritis drugs market, by sales channel
7.3.3.Europe market size and forecast, by drug class
7.3.4.Europe market size and forecast, by route of administration
7.3.5.Europe market size and forecast, by sales channel
7.4.Asia-Pacific
7.4.1.Key market trends, growth factors, and opportunities
7.4.2.Market size and forecast, by country
7.4.2.1.Japan
7.4.2.1.1.Japan rheumatoid arthritis drugs market, by drug class
7.4.2.1.2.Japan rheumatoid arthritis drugs market, by route of administration
7.4.2.1.3.Japan rheumatoid arthritis drugs market, by sales channel
7.4.2.2.China
7.4.2.2.1.China rheumatoid arthritis drugs market, by drug class
7.4.2.2.2.China rheumatoid arthritis drugs market, by route of administration
7.4.2.2.3.China rheumatoid arthritis drugs market, by sales channel
7.4.2.3.Australia
7.4.2.3.1.Australia rheumatoid arthritis drugs market, by drug class
7.4.2.3.2.Australia rheumatoid arthritis drugs market, by route of administration
7.4.2.3.3.Australia rheumatoid arthritis drugs market, by sales channel
7.4.2.4.India
7.4.2.4.1.India rheumatoid arthritis drugs market, by drug class
7.4.2.4.2.India rheumatoid arthritis drugs market, by route of administration
7.4.2.4.3.India rheumatoid arthritis drugs market, by sales channel
7.4.2.5.South Korea
7.4.2.5.1.South Korea rheumatoid arthritis drugs market, by drug class
7.4.2.5.2.South Korea rheumatoid arthritis drugs market, by route of administration
7.4.2.5.3.South Korea rheumatoid arthritis drugs market, by sales channel
7.4.2.6.Rest of Asia-Pacific
7.4.2.6.1.Rest of Asia-Pacific rheumatoid arthritis drugs market, by drug class
7.4.2.6.2.Rest of Asia-Pacific rheumatoid arthritis drugs market, by route of administration
7.4.2.6.3.Rest of Asia-Pacific rheumatoid arthritis drugs market, by sales channel
7.4.3.Asia-Pacific market size and forecast, by drug class
7.4.4.Asia-Pacific market size and forecast, by route of administration
7.4.5.Asia-Pacific market size and forecast, by sales channel
7.5.LAMEA
7.5.1.Key market trends, growth factors, and opportunities
7.5.2.Market size and forecast, by country
7.5.2.1.Brazil
7.5.2.1.1.Brazil rheumatoid arthritis drugs market, by drug class161
7.5.2.1.2.Brazil rheumatoid arthritis drugs market, by route of administration
7.5.2.1.3.Brazil rheumatoid arthritis drugs market, by sales channel
7.5.2.2.Saudi Arabia
7.5.2.2.1.Saudi Arabia rheumatoid arthritis drugs market, by drug class
7.5.2.2.2.Saudi Arabia rheumatoid arthritis drugs market, by route of administration
7.5.2.2.3.Saudi Arabia rheumatoid arthritis drugs market, by sales channel
7.5.2.3.South Africa
7.5.2.3.1.South Africa rheumatoid arthritis drugs market, by drug class
7.5.2.3.2.South Africa rheumatoid arthritis drugs market, by route of administration
7.5.2.3.3.South Africa rheumatoid arthritis drugs market, by sales channel
7.5.2.4.Rest of LAMEA
7.5.2.4.1.Rest of LAMEA rheumatoid arthritis drugs market, by drug class
7.5.2.4.2.Rest of LAMEA rheumatoid arthritis drugs market, by route of administration
7.5.2.4.3.Rest of LAMEA rheumatoid arthritis drugs market, by sales channel
7.5.3.LAMEA market size and forecast, by drug class
7.5.4.LAMEA market size and forecast, by route of administration
7.5.5.LAMEA market size and forecast, by sales channel
CHAPTER 8:COMPANY PROFILES
8.1.ABBVIE INC.
8.1.1.Company overview
8.1.2.Company snapshot
8.1.3.Operating business segments
8.1.4.Product portfolio
8.1.5.Business performance
8.1.6.Key strategic moves and developments
8.2.AMGEN INC.
8.2.1.Company overview
8.2.2.Company snapshot
8.2.3.Operating business segments
8.2.4.Product portfolio
8.2.5.Business performance
8.3.BRISTOL-MYERS SQUIBB COMPANY
8.3.1.Company overview
8.3.2.Company snapshot
8.3.3.Operating business segments
8.3.4.Product portfolio
8.3.5.Business performance
8.4.ELI LILLY AND COMPANY
8.4.1.Company overview
8.4.2.Company snapshot
8.4.3.Operating business segments
8.4.4.Product portfolio
8.4.5.Business performance
8.4.6.Key strategic moves and developments
8.5.F. HOFFMANN-LA ROCHE LTD.
8.5.1.Company overview
8.5.2.Company snapshot
8.5.3.Operating business segments
8.5.4.Product portfolio
8.5.5.Business performance
8.6.JOHNSON & JOHNSON
8.6.1.Company overview
8.6.2.Company snapshot
8.6.3.Operating business segments
8.6.4.Product portfolio
8.6.5.Business performance
8.7.MERCK & CO., INC.
8.7.1.Company overview
8.7.2.Company snapshot
8.7.3.Operating business segments
8.7.4.Product portfolio
8.7.5.Business performance
8.7.6.Key strategic moves and developments
8.8.NOVARTIS AG (SANDOZ)
8.8.1.Company overview
8.8.2.Company snapshot
8.8.3.Operating business segments
8.8.4.Product portfolio
8.8.5.Business performance
8.9.PFIZER INC.
8.9.1.Company overview
8.9.2.Company snapshot
8.9.3.Operating business segments
8.9.4.Product portfolio
8.9.5.Business performance
8.9.6.Key strategic moves and developments
8.10.UCB S.A.
8.10.1.Company overview
8.10.2.Company snapshot
8.10.3.Operating business segments
8.10.4.Product portfolio
8.10.5.Business performance
8.10.6.Key strategic moves and developments
LIST OF TABLES
TABLE 01.GLOBAL RHEUMATOID ARTHRITIS DRUGS MARKET, BY DRUG CLASS, 2019–2027 ($MILLION)
TABLE 02.DISEASE-MODIFYING ANTI-RHEUMATIC DRUGS MARKET, BY REGION, 2019–2027 ($MILLION)
TABLE 03.NONSTEROIDAL ANTI-INFLAMMATORY DRUGS MARKET, BY REGION, 2019–2027 ($MILLION)
TABLE 04.CORTICOSTEROIDS RHEUMATOID ARTHRITIS DRUGS MARKET, BY REGION, 2019–2027 ($MILLION)
TABLE 05.URIC ACID RHEUMATOID ARTHRITIS DRUGS MARKET, BY REGION, 2019–2027 ($MILLION)
TABLE 06.OTHERS RHEUMATOID ARTHRITIS DRUGS MARKET, BY REGION, 2019–2027 ($MILLION)
TABLE 07.GLOBAL RHEUMATOID ARTHRITIS DRUGS MARKET, BY ROUTE OF ADMINISTRATION, 2019–2027 ($MILLION)
TABLE 08.ORAL RHEUMATOID ARTHRITIS DRUGS MARKET, BY REGION, 2019–2027 ($MILLION)
TABLE 09.PARENTERAL RHEUMATOID ARTHRITIS DRUGS MARKET, BY REGION, 2019–2027 ($MILLION)
TABLE 10.GLOBAL RHEUMATOID ARTHRITIS DRUGS MARKET, BY SALES CHANNEL, 2019–2027 ($MILLION)
TABLE 11.PRESCRIPTION-BASED RHEUMATOID ARTHRITIS DRUGS MARKET, BY REGION, 2019–2027 ($MILLION)
TABLE 12.OVER-THE-COUNTER RHEUMATOID ARTHRITIS DRUGS MARKET, BY REGION, 2019–2027 ($MILLION)
TABLE 13.RHEUMATOID ARTHRITIS DRUGS MARKET, BY REGION, 2019–2027 ($MILLION)
TABLE 14.NORTH AMERICA RHEUMATOID ARTHRITIS DRUGS MARKET, BY COUNTRY, 2019–2027 ($MILLION)
TABLE 15.U.S. RHEUMATOID ARTHRITIS DRUGS MARKET, BY DRUG CLASS, 2019–2027
TABLE 16.U.S. RHEUMATOID ARTHRITIS DRUGS MARKET, BY ROUTE OF ADMINISTRATION, 2019–2027
TABLE 17.U.S. RHEUMATOID ARTHRITIS DRUGS MARKET, BY SALES CHANNEL, 2019–2027
TABLE 18.CANADA RHEUMATOID ARTHRITIS DRUGS MARKET, BY DRUG CLASS, 2019–2027
TABLE 19.CANADA RHEUMATOID ARTHRITIS DRUGS MARKET, BY ROUTE OF ADMINISTRATION, 2019–2027
TABLE 20.CANADA RHEUMATOID ARTHRITIS DRUGS MARKET, BY SALES CHANNEL, 2019–2027
TABLE 21.MEXICO RHEUMATOID ARTHRITIS DRUGS MARKET, BY DRUG CLASS, 2019–2027
TABLE 22.MEXICO RHEUMATOID ARTHRITIS DRUGS MARKET, BY ROUTE OF ADMINISTRATION, 2019–2027
TABLE 23.MEXICO RHEUMATOID ARTHRITIS DRUGS MARKET, BY SALES CHANNEL, 2019–2027
TABLE 24.NORTH AMERICA RHEUMATOID ARTHRITIS DRUGS MARKET, BY DRUG CLASS, 2019–2027
TABLE 25.NORTH AMERICA RHEUMATOID ARTHRITIS DRUGS MARKET, BY ROUTE OF ADMINISTRATION, 2019–2027
TABLE 26.NORTH AMERICA RHEUMATOID ARTHRITIS DRUGS MARKET, BY SALES CHANNEL, 2019–2027
TABLE 27.EUROPE RHEUMATOID ARTHRITIS DRUGS MARKET, BY COUNTRY, 2019–2027 ($MILLION)
TABLE 28.GERMANY RHEUMATOID ARTHRITIS DRUGS MARKET, BY DRUG CLASS, 2019–2027
TABLE 29.GERMANY RHEUMATOID ARTHRITIS DRUGS MARKET, BY ROUTE OF ADMINISTRATION, 2019–2027
TABLE 30.GERMANY RHEUMATOID ARTHRITIS DRUGS MARKET, BY SALES CHANNEL, 2019–2027
TABLE 31.FRANCE RHEUMATOID ARTHRITIS DRUGS MARKET, BY DRUG CLASS, 2019–2027
TABLE 32.FRANCE RHEUMATOID ARTHRITIS DRUGS MARKET, BY ROUTE OF ADMINISTRATION, 2019–2027
TABLE 33.FRANCE RHEUMATOID ARTHRITIS DRUGS MARKET, BY SALES CHANNEL, 2019–2027
TABLE 34.UK RHEUMATOID ARTHRITIS DRUGS MARKET, BY DRUG CLASS, 2019–2027
TABLE 35.UK RHEUMATOID ARTHRITIS DRUGS MARKET, BY ROUTE OF ADMINISTRATION, 2019–2027
TABLE 36.UK RHEUMATOID ARTHRITIS DRUGS MARKET, BY SALES CHANNEL, 2019–2027
TABLE 37.ITALY RHEUMATOID ARTHRITIS DRUGS MARKET, BY DRUG CLASS, 2019–2027
TABLE 38.ITALY RHEUMATOID ARTHRITIS DRUGS MARKET, BY ROUTE OF ADMINISTRATION, 2019–2027
TABLE 39.ITALY RHEUMATOID ARTHRITIS DRUGS MARKET, BY SALES CHANNEL, 2019–2027
TABLE 40.SPAIN RHEUMATOID ARTHRITIS DRUGS MARKET, BY DRUG CLASS, 2019–2027
TABLE 41.SPAIN RHEUMATOID ARTHRITIS DRUGS MARKET, BY ROUTE OF ADMINISTRATION, 2019–2027
TABLE 42.SPAIN RHEUMATOID ARTHRITIS DRUGS MARKET, BY SALES CHANNEL, 2019–2027
TABLE 43.REST OF EUROPE RHEUMATOID ARTHRITIS DRUGS MARKET, BY DRUG CLASS, 2019–2027
TABLE 44.REST OF EUROPE RHEUMATOID ARTHRITIS DRUGS MARKET, BY ROUTE OF ADMINISTRATION, 2019–2027
TABLE 45.REST OF EUROPE RHEUMATOID ARTHRITIS DRUGS MARKET, BY SALES CHANNEL, 2019–2027
TABLE 46.EUROPE RHEUMATOID ARTHRITIS DRUGS MARKET, BY DRUG CLASS, 2019–2027
TABLE 47.EUROPE RHEUMATOID ARTHRITIS DRUGS MARKET, BY ROUTE OF ADMINISTRATION, 2019–2027
TABLE 48.EUROPE RHEUMATOID ARTHRITIS DRUGS MARKET, BY SALES CHANNEL, 2019–2027
TABLE 49.ASIA-PACIFIC RHEUMATOID ARTHRITIS DRUGS MARKET, BY COUNTRY, 2019–2027 ($MILLION)
TABLE 50.JAPAN RHEUMATOID ARTHRITIS DRUGS MARKET, BY DRUG CLASS, 2019–2027
TABLE 51.JAPAN RHEUMATOID ARTHRITIS DRUGS MARKET, BY ROUTE OF ADMINISTRATION, 2019–2027
TABLE 52.JAPAN RHEUMATOID ARTHRITIS DRUGS MARKET, BY SALES CHANNEL, 2019–2027
TABLE 53.CHINA RHEUMATOID ARTHRITIS DRUGS MARKET, BY DRUG CLASS, 2019–2027
TABLE 54.CHINA RHEUMATOID ARTHRITIS DRUGS MARKET, BY ROUTE OF ADMINISTRATION, 2019–2027
TABLE 55.CHINA RHEUMATOID ARTHRITIS DRUGS MARKET, BY SALES CHANNEL, 2019–2027
TABLE 56.AUSTRALIA RHEUMATOID ARTHRITIS DRUGS MARKET, BY DRUG CLASS, 2019–2027
TABLE 57.AUSTRALIA RHEUMATOID ARTHRITIS DRUGS MARKET, BY ROUTE OF ADMINISTRATION, 2019–2027
TABLE 58.AUSTRALIA RHEUMATOID ARTHRITIS DRUGS MARKET, BY SALES CHANNEL, 2019–2027
TABLE 59.INDIA RHEUMATOID ARTHRITIS DRUGS MARKET, BY DRUG CLASS, 2019–2027
TABLE 60.INDIA RHEUMATOID ARTHRITIS DRUGS MARKET, BY ROUTE OF ADMINISTRATION, 2019–2027
TABLE 61.INDIA RHEUMATOID ARTHRITIS DRUGS MARKET, BY SALES CHANNEL, 2019–2027
TABLE 62.SOUTH KOREA RHEUMATOID ARTHRITIS DRUGS MARKET, BY DRUG CLASS, 2019–2027
TABLE 63.SOUTH KOREA RHEUMATOID ARTHRITIS DRUGS MARKET, BY ROUTE OF ADMINISTRATION, 2019–2027
TABLE 64.SOUTH KOREA RHEUMATOID ARTHRITIS DRUGS MARKET, BY SALES CHANNEL, 2019–2027
TABLE 65.REST OF ASIA-PACIFIC RHEUMATOID ARTHRITIS DRUGS MARKET, BY DRUG CLASS, 2019–2027
TABLE 66.REST OF ASIA-PACIFIC RHEUMATOID ARTHRITIS DRUGS MARKET, BY ROUTE OF ADMINISTRATION, 2019–2027
TABLE 67.REST OF ASIA-PACIFIC RHEUMATOID ARTHRITIS DRUGS MARKET, BY SALES CHANNEL, 2019–2027
TABLE 68.ASIA-PACIFIC RHEUMATOID ARTHRITIS DRUGS MARKET, BY DRUG CLASS, 2019–2027
TABLE 69.ASIA-PACIFIC RHEUMATOID ARTHRITIS DRUGS MARKET, BY ROUTE OF ADMINISTRATION, 2019–2027
TABLE 70.ASIA-PACIFIC RHEUMATOID ARTHRITIS DRUGS MARKET, BY SALES CHANNEL, 2019–2027
TABLE 71.LAMEA RHEUMATOID ARTHRITIS DRUGS MARKET, BY COUNTRY, 2019–2027 ($MILLION)
TABLE 72.BRAZIL RHEUMATOID ARTHRITIS DRUGS MARKET, BY DRUG CLASS, 2019–2027
TABLE 73.BRAZIL RHEUMATOID ARTHRITIS DRUGS MARKET, BY ROUTE OF ADMINISTRATION, 2019–2027
TABLE 74.BRAZIL RHEUMATOID ARTHRITIS DRUGS MARKET, BY SALES CHANNEL, 2019–2027
TABLE 75.SAUDI ARABIA RHEUMATOID ARTHRITIS DRUGS MARKET, BY DRUG CLASS, 2019–2027
TABLE 76.SAUDI ARABIA RHEUMATOID ARTHRITIS DRUGS MARKET, BY ROUTE OF ADMINISTRATION, 2019–2027
TABLE 77.SAUDI ARABIA RHEUMATOID ARTHRITIS DRUGS MARKET, BY SALES CHANNEL, 2019–2027
TABLE 78.SOUTH AFRICA RHEUMATOID ARTHRITIS DRUGS MARKET, BY DRUG CLASS, 2019–2027
TABLE 79.SOUTH AFRICA RHEUMATOID ARTHRITIS DRUGS MARKET, BY ROUTE OF ADMINISTRATION, 2019–2027
TABLE 80.SOUTH AFRICA RHEUMATOID ARTHRITIS DRUGS MARKET, BY SALES CHANNEL, 2019–2027
TABLE 81.REST OF LAMEA RHEUMATOID ARTHRITIS DRUGS MARKET, BY DRUG CLASS, 2019–2027
TABLE 82.REST OF LAMEA RHEUMATOID ARTHRITIS DRUGS MARKET, BY ROUTE OF ADMINISTRATION, 2019–2027
TABLE 83.REST OF LAMEA RHEUMATOID ARTHRITIS DRUGS MARKET, BY SALES CHANNEL, 2019–2027
TABLE 84.LAMEA RHEUMATOID ARTHRITIS DRUGS MARKET, BY DRUG CLASS, 2019–2027
TABLE 85.LAMEA RHEUMATOID ARTHRITIS DRUGS MARKET, BY ROUTE OF ADMINISTRATION, 2019–2027
TABLE 86.LAMEA RHEUMATOID ARTHRITIS DRUGS MARKET, BY SALES CHANNEL, 2019–2027
TABLE 87.ABBVIE INC.: COMPANY SNAPSHOT
TABLE 88.ABBVIE INC.: PRODUCT PORTFOLIO
TABLE 89.ABBVIE: KEY STRATEGIC MOVES AND DEVELOPMENTS
TABLE 90.AMGEN: COMPANY SNAPSHOT
TABLE 91.AMGEN: PRODUCT PORTFOLIO
TABLE 92.BMS: COMPANY SNAPSHOT
TABLE 93.BMS: PRODUCT PORTFOLIO
TABLE 94.LILLY: COMPANY SNAPSHOT
TABLE 95.LILLY: PRODUCT PORTFOLIO
TABLE 96.LILLY: KEY STRATEGIC MOVES AND DEVELOPMENTS
TABLE 97.ROCHE: COMPANY SNAPSHOT
TABLE 98.ROCHE: OPERATING SEGMENT
TABLE 99.ROCHE: PRODUCT PORTFOLIO
TABLE 100.J&J: COMPANY SNAPSHOT
TABLE 101.J&J: OPERATING SEGMENTS
TABLE 102.JOHNSON AND JOHNSON: PRODUCT PORTFOLIO
TABLE 103.MERCK & CO., INC.: COMPANY SNAPSHOT
TABLE 104.MERCK & CO., INC.: OPERATING SEGMENTS
TABLE 105.MERCK & CO., INC.: PRODUCT PORTFOLIO
TABLE 106.MERCK & CO., INC.: KEY STRATEGIC MOVES AND DEVELOPMENTS
TABLE 107.NOVARTIS: COMPANY SNAPSHOT
TABLE 108.NOVARTIS: OPERATING SEGMENT
TABLE 109.NOVARTIS: PRODUCT PORTFOLIO
TABLE 110.PFIZER: COMPANY SNAPSHOT
TABLE 111.PFIZER: OPERATING SEGMENT
TABLE 112.PFIZER: PRODUCT PORTFOLIO
TABLE 113.PFIZER: KEY STRATEGIC MOVES AND DEVELOPMENTS
TABLE 114.UCB: COMPANY SNAPSHOT
TABLE 115.UCB: OPERATING SEGMENT
TABLE 116.UCB: PRODUCT PORTFOLIO
TABLE 117.UCB: KEY STRATEGIC MOVES AND DEVELOPMENTS
LIST OF FIGURES
FIGURE 01.GLOBAL RHEUMATOID ARTHRITIS DRUGS MARKET SEGMENTATION
FIGURE 02.TOP INVESTMENT POCKETS
FIGURE 03.TOP PLAYER POSITIONING, 2019
FIGURE 04.MODERATE BARGAINING POWER OF SUPPLIERS
FIGURE 05.MODERATE BARGAINING POWER OF BUYERS
FIGURE 06.HIGH THREAT OF SUBSTITUTES
FIGURE 07.HIGH THREAT OF NEW ENTRANTS
FIGURE 08.MODERATE INTENSITY OF RIVALRY
FIGURE 09.IMPACT ANALYSIS
FIGURE 10.COMPARATIVE ANALYSIS OF DISEASE-MODIFYING ANTI-RHEUMATIC DRUGS MARKET, BY COUNTRY, 2019 & 2027 ($MILLION)
FIGURE 11.COMPARATIVE ANALYSIS OF NONSTEROIDAL ANTI-INFLAMMATORY DRUGS MARKET, BY COUNTRY, 2019 & 2027 ($MILLION)
FIGURE 12.COMPARATIVE ANALYSIS OF CORTICOSTEROIDS RHEUMATOID ARTHRITIS DRUGS MARKET, BY COUNTRY, 2019 & 2027 ($MILLION)
FIGURE 13.COMPARATIVE ANALYSIS OF URIC ACID RHEUMATOID ARTHRITIS DRUGS MARKET, BY COUNTRY, 2019 & 2027 ($MILLION)
FIGURE 14.COMPARATIVE ANALYSIS OF OTHER RHEUMATOID ARTHRITIS DRUGS MARKET, BY COUNTRY, 2019 & 2027 ($MILLION)
FIGURE 15.COMPARATIVE ANALYSIS OF ORAL RHEUMATOID ARTHRITIS DRUGS MARKET, BY COUNTRY, 2019 & 2027 ($MILLION)
FIGURE 16.COMPARATIVE ANALYSIS OF PARENTERAL RHEUMATOID ARTHRITIS DRUGS MARKET, BY COUNTRY, 2019 & 2027 ($MILLION)
FIGURE 17.COMPARATIVE ANALYSIS OF PRESCRIPTION-BASED RHEUMATOID ARTHRITIS DRUGS MARKET, BY COUNTRY, 2019 & 2027 ($MILLION)
FIGURE 18.COMPARATIVE ANALYSIS OF OVER-THE-COUNTER RHEUMATOID ARTHRITIS DRUGS MARKET, BY COUNTRY, 2019 & 2027 ($MILLION)
FIGURE 19.ABBVIE INC: NET SALES, 2017–2019 ($MILLION)
FIGURE 20.ABBVIE INC.: REVENUE SHARE BY REGION, 2019 (%)
FIGURE 21.AMGEN: NET SALES, 2017–2019 ($MILLION)
FIGURE 22.AMGEN: REVENUE SHARE BY REGION, 2019 (%)
FIGURE 23.BMS: NET SALES, 2017–2019 ($MILLION)
FIGURE 24.BMS: REVENUE SHARE BY REGION, 2019 (%)
FIGURE 25.LILLY: NET SALES, 2017–2019 ($MILLION)
FIGURE 26.LILLY: REVENUE SHARE BY REGION, 2019 (%)
FIGURE 27.ROCHE: NET SALES, 2017–2019 ($MILLION)
FIGURE 28.ROCHE: REVENUE SHARE BY SEGMENT, 2019 (%)
FIGURE 29.ROCHE: REVENUE SHARE, BY REGION, 2019 (%)
FIGURE 30.J&J: NET SALES, 2017–2019 ($MILLION)
FIGURE 31.J&J: REVENUE SHARE, BY SEGMENT, 2019 (%)
FIGURE 32.J&J: REVENUE SHARE, BY REGION, 2019 (%)
FIGURE 33.MERCK & CO., INC.: NET SALES, 2017–2019 ($MILLION)
FIGURE 34.MERCK & CO., INC.: REVENUE SHARE, BY SEGMENT, 2019 (%)
FIGURE 35.MERCK & CO., INC.: REVENUE SHARE, BY REGION, 2019 (%)
FIGURE 36.NOVARTIS: NET SALES, 2017–2019 ($MILLION)
FIGURE 37.NOVARTIS: REVENUE SHARE BY SEGMENT, 2019 (%)
FIGURE 38.NOVARTIS: REVENUE SHARE BY REGION, 2019 (%)
FIGURE 39.PFIZER: NET SALES, 2017–2019 ($MILLION)
FIGURE 40.PFIZER: REVENUE SHARE BY SEGMENT, 2019 (%)
FIGURE 41.PFIZER: REVENUE SHARE BY REGION, 2019 (%)
FIGURE 42.UCB: NET SALES, 2017–2019 ($MILLION)
FIGURE 43.UCB: REVENUE SHARE BY SEGMENT, 2019 (%)
FIGURE 44.UCB: REVENUE SHARE BY REGION, 2019 (%)