Int'l : +1-503-894-6022 | Toll Free : +1-800-792-5285 | help@alliedmarketresearch.com
A09434 | Pages: 210 | Charts: 50 | Tables: 90 |
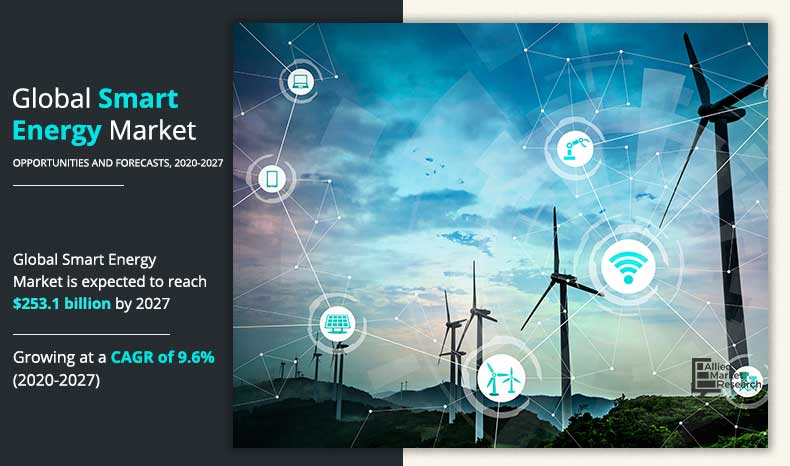
Global smart energy market size was valued at $124.0 billion in 2019, and is projected to reach $253.1 billion by 2027, growing at a CAGR of 9.6% from 2020 to 2027. Smart energy is a cost-effective, sustainable, and secure energy system, which focuses on sustainable energy production while reducing the production cost. The smart energy system consists of smart electricity, smart gas, and smart thermal grids. In addition, the application of smart energy system can also eliminate need of conventional fossil fuels.
Get more information on this report : Request Sample Pages
Smart energy refers to an integrated approach to energy generation, distribution, consumption, and management that leverages advanced technologies and innovative practices to enhance the efficiency, reliability, and sustainability of energy systems. It encompasses a wide range of solutions, including smart grids, energy management systems, demand response technologies, and renewable energy integration. The goal of smart energy is to optimize energy use while minimizing environmental impact, facilitating a transition towards a more sustainable and resilient energy ecosystem.
As the global population increases and energy consumption rises, there is a significant shift towards cleaner and more sustainable energy solutions. This transition is driven by the urgent need to mitigate climate change, reduce greenhouse gas emissions, and decrease reliance on fossil fuels. Renewable energy sources, such as solar, wind, hydroelectric, and geothermal power, offer a sustainable alternative that addresses environmental concerns but also ensures energy security.
In addition, advancements in technology have made renewable energy more accessible and cost-effective. The decreasing costs of solar panels and wind turbines, combined with improved efficiency and storage solutions, have fueled widespread adoption of these energy sources. As more businesses and households embrace renewables, the demand for smart energy solutions increases. Smart energy technologies facilitate the integration of renewable energy into existing grids, allowing for real-time monitoring, management, and optimization of energy resources. All these factors are expected to drive the demand for the smart energy market during the forecast period.
However, high initial investment costs present a significant challenge to the growth of the smart energy market. Implementing smart energy solutions often requires substantial upfront capital for infrastructure development, including advanced metering systems, energy management software, and the integration of renewable energy sources. For many organizations and consumers, particularly in emerging markets, these costs can be prohibitive, limiting their ability to transition to smarter energy solutions. In addition, the high initial costs are often compounded by the need for ongoing maintenance and upgrades. Smart energy systems require continuous investment to keep up with technological advancements and ensure optimal performance. All these factors hamper the growth of the smart energy market during the forecast period.
Robust investment in smart grid technologies is one of the major drivers in the smart energy market. In addition, shift toward efficient energy technologies in China, the U.S., and the UK will further boost the market demand for smart grids. For instance, Government of India is planning to replace 250 million conventional meters into smart meters by 2022. Furthermore, advanced metering infrastructure technology is expected to gain traction during the forecast timeframe, owing to increase in expenditure on infrastructure development. Advanced metering devices have strong demand in homes, offices and industrial plants for efficient energy management and easy monitoring of energy usage. However, smart energy requires high capital investment and integration of complex technologies, which are the major challenges during the initial phase. Installation of smart energy involves hardware and software components, including instrumentation, network infrastructure and network management software. In addition, the system requires integration of large number of systems, including work management systems, mobile workforce management, SCADA/DMS, and distribution automation systems. Nonetheless, favorable government policies and increase in emphasis on renewable power sources are expected to create lucrative opportunities in the market.
The global smart energy market is segmented on the basis of product, end-user industry, and region. On the basis of product, it is divided into smart grid, digital oilfield, and smart solar, and home energy management system. Based on end-user industry, it is categorized into residential, industrial, and commercial. Region-wise, it is analyzed across North America, Europe, Asia-Pacific, and LAMEA.
Smart grid accounted for significant revenue share. This is attributed to rise in demand for dynamic pricing or real time pricing, coupled with application of distributed energy system in residential and commercial places.
[PRODUCTGRAPH]
Get more information on this report : Request Sample Pages
The industrial sector accounted for highest revenue share and market growth, owing to increase in demand for smart energy in energy intensive industrial sectors, where the smart energy system helps to reduce energy cost and improve company's ecological profile, and feedback scheduling.
[ENDUSERINDUSTRYGRAPH]
Get more information on this report : Request Sample Pages
Asia-Pacific accounted for a significant market share. This is attributed to growing application of smart energy devices predominantly in China. For instance, in March 2019, China Southern Power Grid announced to invest around $25.3 billion for smart energy grid in the Pearl River Delta region. This will improve Guangzhou and Shenzhen cities power outages. In addition, growing emphasis on the usage of solar and wind power sources to reduce carbon emission will positively drive the market growth in Asia-Pacific.
[REGIONGRAPH]
Get more information on this report : Request Sample Pages
Major players have adopted product launch, collaboration, and acquisition to sustain the intense market competition. Some of the key players profiled in the report include General Electric, Itron, Honeywell International, Siemens, ABB Group, and Larsen & Toubro.
Key Market Segments
Key Market Players
CHAPTER 1:INTRODUCTION
1.1.Report description
1.2.Key benefits for stakeholders
1.3.Key market segments
1.4.Research methodology
1.4.1.Primary research
1.4.2.Secondary research
1.4.3.Analyst tools and models
CHAPTER 2:EXECUTIVE SUMMARY
2.1.Key findings of the study
2.2.CXO perspective
CHAPTER 3:MARKET LANDSCAPE
3.1.Market definition and scope
3.2.Key findings
3.2.1.Top investment pockets
3.2.2.Top winning strategies
3.3.Porter's five forces analysis
3.4.Market share analysis & Top player positioning, 2019
3.4.1.Top player positioning, 2019
3.5.Market dynamics
3.5.1.Drivers
3.5.1.1.Robust investment in smart grid technologies
3.5.1.2.Shift towards efficient energy technologies
3.5.1.3.Advanced metering infrastructure
3.5.2.Restraint
3.5.2.1.High capital investment and integration of complex technologies
3.5.3.Opportunity
3.5.3.1.Favorable government policies
3.6.Impact of Covid-19 Outburst on Smart Energy Market
CHAPTER 4:SMART ENERGY MARKET, BY PRODUCT
4.1.Overview
4.1.1.Market size and forecast
4.2.Smart Grid
4.2.1.Key market trends, growth factors, and opportunities
4.2.2.Market size and forecast, by region
4.3.Digital oilfield
4.3.1.Key market trends, growth factors, and opportunities
4.3.2.Market size and forecast, by region
4.4.Smart Solar
4.4.1.Key market trends, growth factors, and opportunities
4.4.2.Market size and forecast, by region
4.5.Home energy management system
4.5.1.Key market trends, growth factors, and opportunities
4.5.2.Market size and forecast, by region
CHAPTER 5:SMART ENERGY MARKET, BY END-USER INDUSTRY
5.1.Overview
5.1.1.Market size and forecast
5.2.Residential
5.2.1.Key market trends, growth factors, and opportunities
5.2.2.Market size and forecast, by region
5.3.Industrial
5.3.1.Key market trends, growth factors, and opportunities
5.3.2.Market size and forecast, by region
5.4.Commercial
5.4.1.Key market trends, growth factors, and opportunities
5.4.2.Market size and forecast, by region
CHAPTER 6:SMART ENERGY MARKET, BY REGION
6.1.Overview
6.1.1.Market size and forecast
6.2.North America
6.2.1.Key market trends, growth factors, and opportunities
6.2.2.Market size and forecast, by PRODUCT
6.2.3.Market size and forecast, by End-User Industry
6.2.4.Market share analysis, by country
6.2.4.1.U.S.
6.2.4.1.1.Market size and forecast, by PRODUCT
6.2.4.1.2.Market size and forecast, by End-User Industry
6.2.4.2.Canada
6.2.4.2.1.Market size and forecast, by PRODUCT
6.2.4.2.2.Market size and forecast, by End-User Industry
6.2.4.3.Mexico
6.2.4.3.1.Market size and forecast, by PRODUCT
6.2.4.3.2.Market size and forecast, by End-User Industry
6.3.Europe
6.3.1.Key market trends, growth factors, and opportunities
6.3.2.Market size and forecast, by PRODUCT
6.3.3.Market size and forecast, by End-User Industry
6.3.4.Market share analysis, by country
6.3.4.1.Germany
6.3.4.1.1.Market size and forecast, by PRODUCT
6.3.4.1.2.Market size and forecast, by End-User Industry
6.3.4.2.UK
6.3.4.2.1.Market size and forecast, by PRODUCT
6.3.4.2.2.Market size and forecast, by End-User Industry
6.3.4.3.France
6.3.4.3.1.Market size and forecast, by PRODUCT
6.3.4.3.2.Market size and forecast, by End-User Industry
6.3.4.4.Spain
6.3.4.4.1.Market size and forecast, by PRODUCT
6.3.4.4.2.Market size and forecast, by End-User Industry
6.3.4.5.Rest of Europe
6.3.4.5.1.Market size and forecast, by PRODUCT
6.3.4.5.2.Market size and forecast, by End-User Industry
6.4.Asia-Pacific
6.4.1.Key market trends, growth factors, and opportunities
6.4.2.Market size and forecast, by PRODUCT
6.4.3.Market size and forecast, by End-User Industry
6.4.4.Market share analysis, by country
6.4.4.1.China
6.4.4.1.1.Market size and forecast, by PRODUCT
6.4.4.1.2.Market size and forecast, by End-User Industry
6.4.4.2.Japan
6.4.4.2.1.Market size and forecast, by PRODUCT
6.4.4.2.2.Market size and forecast, by End-User Industry
6.4.4.3.India
6.4.4.3.1.Market size and forecast, by PRODUCT
6.4.4.3.2.Market size and forecast, by End-User Industry
6.4.4.4.South Korea
6.4.4.4.1.Market size and forecast, by PRODUCT
6.4.4.4.2.Market size and forecast, by End-User Industry
6.4.4.5.Australia
6.4.4.5.1.Market size and forecast, by PRODUCT
6.4.4.5.2.Market size and forecast, by End-User Industry
6.4.4.6.Rest of Asia-Pacific
6.4.4.6.1.Market size and forecast, by PRODUCT
6.4.4.6.2.Market size and forecast, by End-User Industry
6.5.LAMEA
6.5.1.Key market trends, growth factors, and opportunities
6.5.2.Market size and forecast, by PRODUCT
6.5.3.Market size and forecast, by End-User Industry
6.5.4.Market share analysis, by country
6.5.4.1.Brazil
6.5.4.1.1.Market size and forecast, by PRODUCT
6.5.4.1.2.Market size and forecast, by End-User Industry
6.5.4.2.Saudi Arabia
6.5.4.2.1.Market size and forecast, by PRODUCT
6.5.4.2.2.Market size and forecast, by End-User Industry
6.5.4.3.South Africa
6.5.4.3.1.Market size and forecast, by PRODUCT
6.5.4.3.2.Market size and forecast, by End-User Industry
6.5.4.4.Rest of LAMEA
6.5.4.4.1.Market size and forecast, by PRODUCT
6.5.4.4.2.Market size and forecast, by End-User Industry
CHAPTER 7:COMPETITIVE LANDSCAPE
7.1.Introduction
7.2.Product mapping of top 10 players
7.3.Competitive Heatmap
7.4.Key development
7.4.1.Agreement
7.4.2.Product Launch
CHAPTER 8:COMPANY PROFILES
8.1.General Electric Company
8.1.1.Company overview
8.1.2.Company snapshot
8.1.3.Operating business segments
8.1.4.Product Portfolio
8.1.5.Business performance
8.1.6.Key strategic moves and developments
8.2.SIEMENS AG
8.2.1.Company overview
8.2.2.Company snapshot
8.2.3.Operating business segments
8.2.4.Product portfolio
8.2.5.Business performance
8.2.6.Key strategic moves and developments
8.3.ABB Ltd.
8.3.1.Company overview
8.3.2.Company Snapshot
8.3.3.Operating business segments
8.3.4.Product portfolio
8.3.5.Business performance
8.3.6.Key strategic moves and developments
8.4.HONEYWELL INTERNATIONAL INC.
8.4.1.Company overview
8.4.2.Company snapshot
8.4.3.Operating business segments
8.4.4.Product portfolio
8.4.5.Business performance
8.4.6.Key strategic moves and developments
8.5.ITRON
8.5.1.Company overview
8.5.2.Company snapshot
8.5.3.Operating business segments
8.5.4.Product Portfolio
8.7.Sensus
8.7.1.Company overview
8.7.2.Company snapshot
8.7.3.Operating business segments
8.7.4.Product Portfolio
8.8.S&T Smart Energy
8.8.1.Company overview
8.8.2.Company snapshot
8.8.3.Operating business segments
8.8.4.Product Portfolio
8.9.Landis + Gyr
8.9.1.Company overview
8.9.2.Company snapshot
8.9.3.Operating business segments
8.9.4.Product Portfolio
8.9.5.Business performance
8.10.Schneider Electric
8.10.1.Company overview
8.10.2.Company snapshot
8.10.3.Operating business segments
8.10.4.Product portfolio
8.10.5.Business performance
LIST OF TABLES
TABLE 01.SMART ENERGY MARKET, BY PRODUCT, 2019–2027 ($MILLION)
TABLE 02.SMART ENERGY MARKET FOR SMART GRID, BY REGION, 2019–2027 ($MILLION)
TABLE 03.SMART ENERGY MARKET FOR DIGITAL OILFIELD, BY REGION, 2019–2027 ($MILLION)
TABLE 04.SMART ENERGY MARKET FOR SMART SOLAR, BY REGION, 2019–2027 ($MILLION)
TABLE 05.SMART ENERGY MARKET FOR HOME ENERGY MANAGEMENT SYSTEM, BY REGION, 2019–2027 ($MILLION)
TABLE 06.SMART ENERGY MARKET, BY END-USER INDUSTRY, 2019–2027 ($MILLION)
TABLE 07.SMART ENERGY MARKET FOR RESIDENTIAL END-USER INDUSTRY, BY REGION, 2019–2027 ($MILLION)
TABLE 08.SMART ENERGY MARKET FOR INDUSTRIAL END-USER INDUSTRY, BY REGION, 2019–2027 ($MILLION)
TABLE 09.SMART ENERGY MARKET FOR COMMERCIAL END-USER INDUSTRY, BY REGION, 2019–2027 ($MILLION)
TABLE 10.SMART ENERGY MARKET, BY REGION, 2020-2027 ($MILLION)
TABLE 11.NORTH AMERICA SMART ENERGY MARKET, BY PRODUCT, 2019–2027 ($MILLION)
TABLE 12.NORTH AMERICA SMART ENERGY MARKET, BY END-USER INDUSTRY, 2019–2027 ($MILLION)
TABLE 13.NORTH AMERICA SMART ENERGY MARKET, BY COUNTRY, 2019–2027 ($MILLION)
TABLE 14.U.S. SMART ENERGY MARKET, BY PRODUCT, 2019–2027 ($MILLION)
TABLE 15.U.S. SMART ENERGY MARKET, BY END-USER INDUSTRY, 2019–2027 ($MILLION)
TABLE 16.CANADA SMART ENERGY MARKET, BY PRODUCT, 2019–2027 ($MILLION)
TABLE 17.CANADA SMART ENERGY MARKET, BY END-USER INDUSTRY, 2019–2027 ($MILLION)
TABLE 18.MEXICO SMART ENERGY MARKET, BY PRODUCT, 2019–2027 ($MILLION)
TABLE 19.MEXICO SMART ENERGY MARKET, BY END-USER INDUSTRY, 2019–2027 ($MILLION)
TABLE 20.EUROPE SMART ENERGY MARKET, BY PRODUCT, 2019–2027 ($MILLION)
TABLE 21.EUROPE SMART ENERGY MARKET, BY END-USER INDUSTRY, 2019–2027 ($MILLION)
TABLE 22.EUROPE SMART ENERGY MARKET, BY COUNTRY, 2019–2027 ($MILLION)
TABLE 23.GERMANY SMART ENERGY MARKET, BY PRODUCT, 2019–2027 ($MILLION)
TABLE 24.GERMANY SMART ENERGY MARKET, BY END-USER INDUSTRY, 2019–2027 ($MILLION)
TABLE 25.UK SMART ENERGY MARKET, BY PRODUCT, 2019–2027 ($MILLION)
TABLE 26.UK SMART ENERGY MARKET, BY END-USER INDUSTRY, 2019–2027 ($MILLION)
TABLE 27.FRANCE SMART ENERGY MARKET, BY PRODUCT, 2019–2027 ($MILLION)
TABLE 28.FRANCE SMART ENERGY MARKET, BY END-USER INDUSTRY, 2019–2027 ($MILLION)
TABLE 29.SPAIN SMART ENERGY MARKET, BY PRODUCT, 2019–2027 ($MILLION)
TABLE 30.SPAIN SMART ENERGY MARKET, BY END-USER INDUSTRY, 2019–2027 ($MILLION)
TABLE 31.REST OF EUROPE SMART ENERGY MARKET, BY PRODUCT, 2019–2027 ($MILLION)
TABLE 32.REST OF EUROPE SMART ENERGY MARKET, BY END-USER INDUSTRY, 2019–2027 ($MILLION)
TABLE 33.ASIA-PACIFIC SMART ENERGY MARKET, BY PRODUCT, 2019–2027 ($MILLION)
TABLE 34.ASIA-PACIFIC SMART ENERGY MARKET, BY END-USER INDUSTRY, 2019–2027 ($MILLION)
TABLE 35.ASIA-PACIFIC SMART ENERGY MARKET, BY COUNTRY, 2019–2027 ($MILLION)
TABLE 36.CHINA SMART ENERGY MARKET, BY PRODUCT, 2019–2027 ($MILLION)
TABLE 37.CHINA SMART ENERGY MARKET, BY END-USER INDUSTRY, 2019–2027 ($MILLION)
TABLE 38.JAPAN SMART ENERGY MARKET, BY PRODUCT, 2019–2027 ($MILLION)
TABLE 39.JAPAN SMART ENERGY MARKET, BY END-USER INDUSTRY, 2019–2027 ($MILLION)
TABLE 40.INDIA SMART ENERGY MARKET, BY PRODUCT, 2019–2027 ($MILLION)
TABLE 41.INDIA SMART ENERGY MARKET, BY END-USER INDUSTRY, 2019–2027 ($MILLION)
TABLE 42.SOUTH KOREA SMART ENERGY MARKET, BY PRODUCT, 2019–2027 ($MILLION)
TABLE 43.SOUTH KOREA SMART ENERGY MARKET, BY END-USER INDUSTRY, 2019–2027 ($MILLION)
TABLE 44.AUSTRALIA SMART ENERGY MARKET, BY PRODUCT, 2019–2027 ($MILLION)
TABLE 45.AUSTRALIA SMART ENERGY MARKET, BY END-USER INDUSTRY, 2019–2027 ($MILLION)
TABLE 46.REST OF ASIA-PACIFIC SMART ENERGY MARKET, BY PRODUCT, 2019–2027 ($MILLION)
TABLE 47.REST OF ASIA-PACIFIC SMART ENERGY MARKET, BY END-USER INDUSTRY, 2019–2027 ($MILLION)
TABLE 48.LAMEA SMART ENERGY MARKET, BY PRODUCT, 2019–2027 ($MILLION)
TABLE 49.LAMEA SMART ENERGY MARKET, BY END-USER INDUSTRY, 2019–2027 ($MILLION)
TABLE 50.LAMEA SMART ENERGY MARKET, BY COUNTRY, 2019–2027 ($MILLION)
TABLE 51.BRAZIL SMART ENERGY MARKET, BY PRODUCT, 2019–2027 ($MILLION)
TABLE 52.BRAZIL SMART ENERGY MARKET, BY END-USER INDUSTRY, 2019–2027 ($MILLION)
TABLE 53.SAUDI ARABIA SMART ENERGY MARKET, BY PRODUCT, 2019–2027 ($MILLION)
TABLE 54.SAUDI ARABIA SMART ENERGY MARKET, BY END-USER INDUSTRY, 2019–2027 ($MILLION)
TABLE 55.SOUTH AFRICA SMART ENERGY MARKET, BY PRODUCT, 2019–2027 ($MILLION)
TABLE 56.SOUTH AFRICA SMART ENERGY MARKET, BY END-USER INDUSTRY, 2019–2027 ($MILLION)
TABLE 57.REST OF LAMEA SMART ENERGY MARKET, BY PRODUCT, 2019–2027 ($MILLION)
TABLE 58.REST OF LAMEA SMART ENERGY MARKET, BY END-USER INDUSTRY, 2019–2027 ($MILLION)
TABLE 59.KEY AGREEMENT
TABLE 60.KEY PRODUCT LAUNCH
TABLE 61.GENERAL ELECTRIC COMPANY: COMPANY SNAPSHOT
TABLE 62.GENERAL ELECTRIC COMPANY: OPERATING SEGMENTS
TABLE 63.GENERAL ELECTRIC COMPANY: PRODUCT PORTFOLIO
TABLE 64.GENERAL ELECTRIC COMPANY GROUP: KEY STRATEGIC MOVES AND DEVELOPMENTS
TABLE 65.ABB LTD.: COMPANY SNAPSHOT
TABLE 66.ABB LTD.: OPERATING SEGMENTS
TABLE 67.ABB LTD.: PRODUCT PORTFOLIO
TABLE 68.ABB LTD.: KEY STRATEGIC MOVES AND DEVELOPMENTS
TABLE 69.HONEYWELL: COMPANY SNAPSHOT
TABLE 70.OLIN: OPERATING SEGMENTS
TABLE 71.HONEYWELL: PRODUCT PORTFOLIO
TABLE 72.OVERALL FINANCIAL STATUS ($MILLION)
TABLE 73.HONEYWELL: KEY STRATEGIC MOVES AND DEVELOPMENTS
TABLE 74.SORO ELECTRONICS: COMPANY SNAPSHOT
TABLE 75.SORO ELECTRONICS: OPERATING SEGMENTS
TABLE 76.SORO ELECTRONICS: PRODUCT PORTFOLIO
TABLE 77.SENSUS: COMPANY SNAPSHOT
TABLE 78.SENSUS: OPERATING SEGMENTS
TABLE 79.SENSUS: PRODUCT PORTFOLIO
TABLE 80.S&T SMART ENERGY: COMPANY SNAPSHOT
TABLE 81.S&T SMART ENERGY: OPERATING SEGMENTS
TABLE 82.S&T SMART ENERGY: PRODUCT PORTFOLIO
TABLE 83.LANDIS + GYR: COMPANY SNAPSHOT
TABLE 84.LANDIS + GYR: OPERATING SEGMENTS
TABLE 85.LANDIS + GYR: PRODUCT PORTFOLIO
TABLE 86.OVERALL FINANCIAL STATUS ($MILLION)
TABLE 87.SCHNEIDER ELECTRIC: COMPANY SNAPSHOT
TABLE 88.SCHNEIDER ELECTRIC: OPERATING SEGMENT
TABLE 89.SCHNEIDER ELECTRIC: PRODUCT PORTFOLIO
TABLE 90.OVERALL FINANCIAL STATUS ($MILLION)
LIST OF FIGURES
FIGURE 01.KEY MARKET SEGMENTS
FIGURE 02.EXECUTIVE SUMMARY, BY SEGMENT
FIGURE 03.EXECUTIVE SUMMARY, BY COUNTRY
FIGURE 04.TOP INVESTMENT POCKETS
FIGURE 05.TOP WINNING STRATEGIES (2017-2020) BY COMPANY
FIGURE 06.MODERATE BARGAINING POWER OF SUPPLIERS
FIGURE 07.MODERATE THREAT OF NEW ENTRANTS
FIGURE 08.MODERATE THREAT OF SUBSTITUTES
FIGURE 09.MODERATE INTENSITY OF RIVALRY
FIGURE 10.LOW BARGAINING POWER OF BUYERS
FIGURE 11.TOP PLAYER POSITIONING, 2019
FIGURE 12.SMART ENERGY MARKET DYNAMICS
FIGURE 13.SMART ENERGY MARKET, BY PRODUCT, 2019–2027 ($MILILION)
FIGURE 14.SMART GRID MARKET, BY COUNTRY, 2019–2027 ($MILILION)
FIGURE 15.DIGITAL OILFIELD MARKET, BY COUNTRY, 2019–2027 ($MILILION)
FIGURE 16.SMART SOLAR MARKET, BY COUNTRY, 2019–2027 ($MILILION)
FIGURE 17.HOME ENERGY MANAGEMENT SYSTEM MARKET, BY COUNTRY, 2019–2027 ($MILILION)
FIGURE 18.SMART ENERGY MARKET, BY END-USER INDUSTRY, 2019–2027 ($MILILION)
FIGURE 19.SMART ENERGY MARKET FOR RESIDENTIAL END-USER INDUSTRY, BY COUNTRY, 2019–2027 ($MILILION)
FIGURE 20.SMART ENERGY MARKET FOR INDUSTRIAL END-USER INDUSTRY, BY COUNTRY, 2019–2027 ($MILILION)
FIGURE 21.SMART ENERGY MARKET FOR COMMERCIAL END-USER INDUSTRY, BY COUNTRY, 2019–2027 ($MILILION)
FIGURE 22.U.S. SMART ENERGY MARKET REVENUE, 2019–2027 ($MILLION)
FIGURE 23.CANADA SMART ENERGY MARKET REVENUE, 2019–2027 ($MILLION)
FIGURE 24.MEXICO SMART ENERGY MARKET REVENUE, 2019–2027 ($MILLION)
FIGURE 25.GERMANY SMART ENERGY MARKET REVENUE, 2019–2027 ($MILLION)
FIGURE 26.UK SMART ENERGY MARKET REVENUE, 2019–2027 ($MILLION)
FIGURE 27.FRANCE SMART ENERGY MARKET REVENUE, 2019–2027 ($MILLION)
FIGURE 28.SPAIN SMART ENERGY MARKET REVENUE, 2019–2027 ($MILLION)
FIGURE 29.REST OF EUROPE SMART ENERGY MARKET REVENUE, 2019–2027 ($MILLION)
FIGURE 30.CHINA SMART ENERGY MARKET REVENUE, 2019–2027 ($MILLION)
FIGURE 31.JAPAN SMART ENERGY MARKET REVENUE, 2019–2027 ($MILLION)
FIGURE 32.INDIA SMART ENERGY MARKET REVENUE, 2019–2027 ($MILLION)
FIGURE 33.SOUTH KOREA SMART ENERGY MARKET REVENUE, 2019–2027 ($MILLION)
FIGURE 34.AUSTRALIA SMART ENERGY MARKET REVENUE, 2019–2027 ($MILLION)
FIGURE 35.REST OF ASIA-PACIFIC SMART ENERGY MARKET REVENUE, 2019–2027 ($MILLION)
FIGURE 36.BRAZIL SMART ENERGY MARKET REVENUE, 2019–2027 ($MILLION)
FIGURE 37.SAUDI ARABIA SMART ENERGY MARKET REVENUE, 2019–2027 ($MILLION)
FIGURE 38.SOUTH AFRICA SMART ENERGY MARKET REVENUE, 2019–2027 ($MILLION)
FIGURE 39.REST OF LAMEA SMART ENERGY MARKET REVENUE, 2019–2027 ($MILLION)
FIGURE 40.PRODUCT MAPPING OF TOP 10 PLAYERS
FIGURE 41.COMPETITIVE HEATMAP
FIGURE 42.HONEYWELL: REVENUE, 2017–2019 ($MILLION)
FIGURE 43.HONEYWELL: REVENUE SHARE BY SEGMENT, 2019 (%)
FIGURE 44.HONEYWELL: REVENUE SHARE BY REGION, 2019 (%)
FIGURE 45.LANDIS + GYR: REVENUE, 2017–2019 ($MILLION)
FIGURE 46.LANDIS + GYR REVENUE SHARE BY SEGMENT, 2019 (%)
FIGURE 47.LANDIS + GYR REVENUE SHARE BY REGION, 2019 (%)
FIGURE 48.SCHNEIDER ELECTRIC: REVENUE, 2017–2019 ($MILLION)
FIGURE 49.SCHNEIDER ELECTRIC REVENUE SHARE BY SEGMENT, 2019 (%)
FIGURE 50.SCHNEIDER ELECTRIC REVENUE SHARE BY REGION, 2019 (%)