Int'l : +1-503-894-6022 | Toll Free : +1-800-792-5285 | help@alliedmarketresearch.com
A00317 | Pages: 255 | Charts: 75 | Tables: 89 |
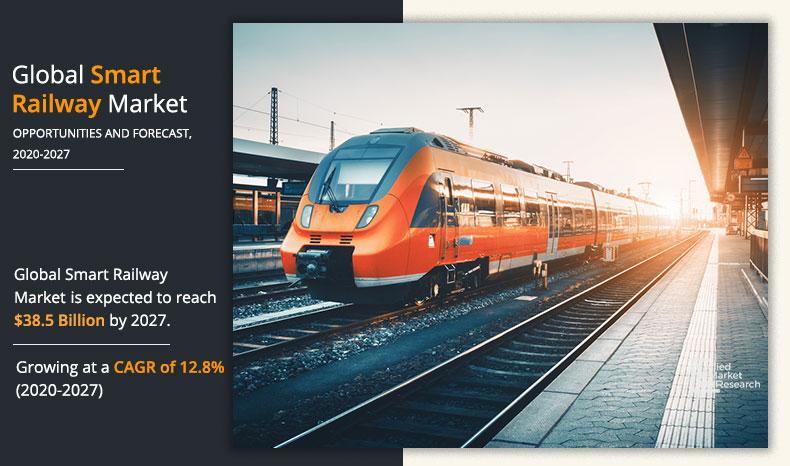
The global smart railway market size was valued at $18,304.8 million in 2019, and is projected to reach $38,469.7 million by 2027, registering a CAGR of 12.8%.
Smart railway is a technologically advanced approach to efficiently manage railway operations through sharing of rail data across rail infrastructure components, such as passengers, control centers, ticketing department, and freight. Smart Railway are integration of the latest technologies, including Internet of Things (IoT), big data, cloud, analytics, artificial intelligence (AI), global positioning system (GPS), and machine learning (ML) to make rail operations more efficient and accurate. The growth of the global smart railway market growth is driven by the penetration of digital infrastructure and requirement for automated & autonomous rail operations. Majority of railways are operated through government authorities where procurement and installation of such smart technologies are done through contracts and agreements. Wining these contracts or agreements is the key strategy adopted by the market participants in the market.
The factors such as rapid urbanization couple with local commute requirements, surge in need for passenger & freight capacity, increase in number of railway projects across the globe, and change in passenger payment habits are expected to drive the growth of the global smart railway market. However, high installation cost and infrastructure changes of the existing system are expected to restrain the growth of market during the forecast period. On the contrary, changes in ridership outlook and entering into contracts/agreements with rail operators for business expansion are anticipated to offer remunerative opportunities for the expansion of the market in the near future.
The smart railway market is segmented into system, offering type, and region. Depending on system, the market is categorized into passenger information system, rail & freight operations management system, smart safety & security monitoring system, rail communication & networking system, smart ticketing system, rail analytics system, and others. By offering type, it is fragmented into solutions, components & devices, and services. Region wise, it is studied across North America, Europe, Asia-Pacific, and LAMEA.
Key players profiled in the smart railway market report include Alstom, BOMBARDIER INC., ABB Ltd, Siemens AG, Cisco Systems, Inc., Huawei Technologies Co., Ltd., IBM, Indra Sistemas, S.A., Hitachi, Ltd., and Aitek S.P.A.
In the recent years, urbanization is attaining the peak, as majority of the population is shifting to urban areas, owing to increase in work opportunities and rapid industrialization. In this era of urbanization, convenient daily commute between workplace and residence is the need for every individual. Moreover, urban passengers are more inclined toward rail commute, as it serves as a time-effective alternative to avoid unnecessary traffic congestion. Thus, increase in reliability of urban passengers on railway for daily commute significantly contributes toward the growth of the smart railway market.
However, majority of urban passengers are facing issues with real-time mode information, overall commute duration, and safety during travel via conventional railways, which hamper the working efficiency of passengers. Smart Railway enables the real-time information of railways, streamline railway operations, and ease fare payment. Thus, upsurge in usage of railway for daily commute in urban areas and changes in digital outlook of passengers are expected to spur the demand for Smart Railway in the upcoming yeas.
[SYSTEMGRAPH]
The railway industry has witnessed significant growth in passenger ridership as compared to other public transit, owing to its fare frequency and overall commute time. According to Organisation for Economic Co-operation and Development (OECD), passenger transport by rail for million passenger-kilometers has witnessed steady growth over the past decade. Moreover, countries such as China, India, and Japan are gaining momentum for million passenger-kilometers.
According to the similar source, China registered 0.37 million rail passenger–kilometers in 1998, which attained 1.41 million rail passenger- kilometers in 2018. Moreover, India registered 0.40 million rail-kilometers in 1998, which was reached 1.16 million rail passenger-kilometers in 2017. Moreover, in 2019, the U.S. witnessed around 60% of increase in rail ridership since 1997, and is expected to continue the same trend in the near future. Rail transit in the U.S. is holding around 48% of the total public transit. Railway has witnessed a significant rise in ridership, and is expected to continue in the upcoming years. Thus, increase in ridership is expected to create demand for cost-effective and operational efficient rail solutions.
Smart Railway are likely to deliver various services such as passenger & freight operations management, safety & security monitoring, rail communication & networking, and ticketing system, which are expected to cater to the changing demands of passengers along with reducing the commute time and enhancing the travel experience.
The smart railway technology solution is used by rail operators, which are majorly government authorities operating rail functions within the nation with ease and high efficiency. Moreover, digitalization is expected to gain traction for smart railway technology. The installation of this technology is likely to be accepted by majority of rail transportation service providers across the globe. This technology installation is carried out through open contracts and agreements between service providers of rail transportation and developers or manufacturers of smart railway technology. These contracts mentioned about the set of requirement are required to be met in a certain timeframe. These long term contracts and agreements are associate with the long term business opportunities with the rail operators. Manufacturers need to focus toward winning the contracts and agreements for new installations to gain a competitive advantage.
[OFFERINGTYPEGRAPH]
The installation of smart railway technology solutions in railways incurs high cost and includes installing payment collection equipment & checking devices, setting of communication network (wired networks), installing network equipment (all kinds of networks), fixing installed system hardware, finetuning & testing system hardware, and monitoring interaction between system components along with infrastructural changes in railways. These upgradations of the existing system associate with high cost as compared to the existing and traditional railway systems. Thus, high installation cost of the technology is expected to hamper the growth of smart railway market.
From March 2020, public transport in majority of the cities has been completely or partially shut down. Although the restrictions on public mobility have been lifted partially since the past two or three months, major cities are experiencing 70–90% reduction in the public transit ridership. After easing lockdown restrictions, world is gradually reshaping and coming back to the normal pace with the new permanent changes in the society. Transportation has begun partially across the globe with stringent restrictions such as passenger limit and maintenance of social distancing. This results to 90% decrease in passenger ridership, and results in huge financial losses of rail operators. This financial losses result in focus on operational activities rather than new investment. Thus, COVID-19 outbreak has significant impact on the overall smart railway market, owing to decrease in ridership and health concerns of passengers.
[REGIONGRAPH]
Key Market Segments
Key Market Players
CHAPTER 1:INTRODUCTION
1.1.Report description
1.2.Key benefits for stakeholders
1.3.Key market segments
1.4.Research methodology
1.4.1.Primary research
1.4.2.Secondary research
1.4.3.Analyst tools and models
CHAPTER 2:EXECUTIVE SUMMARY
2.1.CXO perspective
CHAPTER 3:MARKET OVERVIEW
3.1.Market definition and scope
3.2.Key findings
3.2.1.Top impacting factors
3.2.2.Top investment pockets
3.2.3.Top winning strategies
3.3.Porter’s five forces analysis
3.4.Market share analysis, 2019 (%)
3.5.Market dynamics
3.5.1.Drivers
3.5.1.1.Rising urbanization and local commute requirements
3.5.1.2.The rising demand for passenger and freight capacity
3.5.1.3.Increasing Number of Railway Projects Across the Globe
3.5.1.4.Changing Passenger Payment Habits
3.5.2.Restraints
3.5.2.1.High Installation cost
3.5.2.2.Infrastructure changes of the existing system
3.5.3.Opportunities
3.5.3.1.Changing Ridership Outlook
3.5.3.2.Winning Contract/Agreement is the key strategy to gain competitive advantage
3.6.COVID-19 impact analysis
CHAPTER 4:SMART RAILWAYS MARKET, BY SYSTEM
4.1.Overview
4.2.Passenger Information system
4.2.1.Key market trends, growth factors, and opportunities
4.2.2.Market size and forecast, by region
4.2.3.Market analysis, by country
4.3.Rail & Freight Operations Management System
4.3.1.Key market trends, growth factors, and opportunities
4.3.2.Market size and forecast, by region
4.3.3.Market analysis, by country
4.4.Smart Safety & Security Monitoring System
4.4.1.Key market trends, growth factors, and opportunities
4.4.2.Market size and forecast, by region
4.4.3.Market analysis, by country
4.5.Rail Communication and Networking System
4.5.1.Key market trends, growth factors, and opportunities
4.5.2.Market size and forecast, by region
4.5.3.Market analysis, by country
4.6.Smart Ticketing System
4.6.1.Key market trends, growth factors, and opportunities
4.6.2.Market size and forecast, by region
4.6.3.Market analysis, by country
4.7.Rail Analytics System
4.7.1.Key market trends, growth factors, and opportunities
4.7.2.Market size and forecast, by region
4.7.3.Market analysis, by country
4.8.Others
4.8.1.Key market trends, growth factors, and opportunities
4.8.2.Market size and forecast, by region
4.8.3.Market analysis, by country
CHAPTER 5:SMART RAILWAYS MARKET, BY OFFERING TYPE
5.1.Overview
5.2.Solutions
5.2.1.Key market trends, growth factors, and opportunities
5.2.2.Market size and forecast, by region
5.2.3.Market analysis, by country
5.3.Components & Devices
5.3.1.Key market trends, growth factors, and opportunities
5.3.2.Market size and forecast, by region
5.3.3.Market analysis, by country
5.4.Services
5.4.1.Key market trends, growth factors, and opportunities
5.4.2.Market size and forecast, by region
5.4.3.Market analysis, by country
CHAPTER 6:SMART RAILWAYS MARKET, BY REGION
6.1.Overview
6.2.North America
6.2.1.Market size and forecast, By system
6.2.2.Market size and forecast, By offering type
6.2.3.Market analysis, by country
6.2.3.1.U.S.
6.2.3.1.1.Market size and forecast, By system
6.2.3.1.2.Market size and forecast, By offering type
6.2.3.2.Canada
6.2.3.2.1.Market size and forecast, By system
6.2.3.2.2.Market size and forecast, By offering type
6.2.3.3.Mexico
6.2.3.3.1.Market size and forecast, By system
6.2.3.3.2.Market size and forecast, By offering type
6.3.Europe
6.3.1.Market size and forecast, By system
6.3.2.Market size and forecast, By offering type
6.3.3.Market analysis, by country
6.3.3.1.UK
6.3.3.1.1.Market size and forecast, By system
6.3.3.1.2.Market size and forecast, By offering type
6.3.3.3.Germany
6.3.3.3.1.Market size and forecast, By system
6.3.3.3.2.Market size and forecast, By offering type
6.3.3.4.France
6.3.3.4.1.Market size and forecast, By system
6.3.3.4.2.Market size and forecast, By offering type
6.3.3.5.Spain
6.3.3.5.1.Market size and forecast, By system
6.3.3.5.2.Market size and forecast, By offering type
6.3.3.6.Russia
6.3.3.6.1.Market size and forecast, By system
6.3.3.6.2.Market size and forecast, By offering type
6.3.3.7.Rest of Europe
6.3.3.7.1.Market size and forecast, By system
6.3.3.7.2.Market size and forecast, By offering type
6.4.Asia-Pacific
6.4.1.Market size and forecast, By system
6.4.2.Market size and forecast, By offering type
6.4.3.Market analysis, by country
6.4.3.1.China
6.4.3.1.1.Market size and forecast, By system
6.4.3.1.2.Market size and forecast, By offering type
6.4.3.2.India
6.4.3.2.1.Market size and forecast, By system
6.4.3.2.2.Market size and forecast, By offering type
6.4.3.3.Japan
6.4.3.3.1.Market size and forecast, By system
6.4.3.3.2.Market size and forecast, By offering type
6.4.3.4.South Korea
6.4.3.4.1.Market size and forecast, By system
6.4.3.4.2.Market size and forecast, By offering type
6.4.3.5.Rest of Asia-Pacific
6.4.3.5.1.Market size and forecast, By system
6.4.3.5.2.Market size and forecast, By offering type
6.5.LAMEA
6.5.1.Market size and forecast, By system
6.5.2.Market size and forecast, By offering type
6.5.3.Market analysis, by country
6.5.3.1.Latin America
6.5.3.1.1.Market size and forecast, By system
6.5.3.1.2.Market size and forecast, By offering type
6.5.3.2.Middle East
6.5.3.2.1.Market size and forecast, By system
6.5.3.2.2.Market size and forecast, By offering type
6.5.3.3.Africa
6.5.3.3.1.Market size and forecast, By system
6.5.3.3.2.Market size and forecast, By offering type
CHAPTER 7:COMPANY PROFILES
7.1.Alstom
7.1.1.Company overview
7.1.2.Company snapshot
7.1.3.Operating business segments
7.1.4.Product portfolio
7.1.5.Business performance
7.1.6.Key strategic moves and developments
7.2.BOMBARDIER INC.
7.2.1.Company overview
7.2.2.Company snapshot
7.2.3.Operating business segments
7.2.4.Product portfolio
7.2.5.Business performance
7.2.6.Key strategic moves and developments
7.3.ABB Ltd
7.3.1.Company overview
7.3.2.Company snapshot
7.3.3.Operating business segments
7.3.4.Product portfolio
7.3.5.Business performance
7.4.Siemens AG
7.4.1.Company overview
7.4.2.Company snapshot
7.4.3.Operating business segments
7.4.4.Product portfolio
7.4.5.Business performance
7.4.6.Key strategic moves and developments
7.5.Cisco Systems, Inc.
7.5.1.Company overview
7.5.2.Company snapshot
7.5.3.Operating business segments
7.5.4.Product portfolio
7.5.5.Business performance
7.6.Huawei Technologies Co., Ltd.
7.6.1.Company overview
7.6.2.Company snapshot
7.6.3.Operating business segments
7.6.4.Product portfolio
7.6.5.Business performance
7.7.IBM
7.7.1.Company overview
7.7.2.Company snapshot
7.7.3.Operating business segments
7.7.4.Product portfolio
7.7.5.Business performance
7.8.Indra Sistemas, S.A.
7.8.1.Company overview
7.8.2.Company snapshot
7.8.3.Operating business segments
7.8.4.Product portfolio
7.8.5.Business performance
7.8.6.Key strategic moves and developments
7.9.Hitachi, Ltd.
7.9.1.Company overview
7.9.2.Company snapshot
7.9.3.Operating business segments
7.9.4.Product portfolio
7.9.5.Business performance
7.9.6.Key strategic moves and developments
7.10.Aitek S.P.A.
7.10.1.Company overview
7.10.2.Company snapshot
7.10.3.Operating business segments
7.10.4.Product portfolio
LIST OF TABLES
TABLE 01.GLOBAL SMART RAILWAYS MARKET, BY SYSTEM, 2019-2027 ($MILLION)
TABLE 02.SMART RAILWAYS MARKET REVENUE FOR PASSENGER INFORMATION SYSTEM, BY REGION 2019–2027 ($MILLION)
TABLE 03.SMART RAILWAYS MARKET REVENUE FOR RAIL & FREIGHT OPERATIONS MANAGEMENT SYSTEM, BY REGION 2019–2027 ($MILLION)
TABLE 04.SMART RAILWAYS MARKET REVENUE FOR SMART SAFETY & SECURITY MONITORING SYSTEM, BY REGION 2019–2027 ($MILLION)
TABLE 05.SMART RAILWAYS MARKET REVENUE FOR RAIL COMMUNICATION AND NETWORKING SYSTEM, BY REGION 2019–2027 ($MILLION)
TABLE 06.SMART RAILWAYS MARKET REVENUE FOR SMART TICKETING SYSTEM, BY REGION 2019–2027 ($MILLION)
TABLE 07.SMART RAILWAYS MARKET REVENUE FOR RAIL ANALYTICS SYSTEM, BY REGION 2019–2027 ($MILLION)
TABLE 08.SMART RAILWAYS MARKET REVENUE FOR OTHERS, BY REGION 2019–2027 ($MILLION)
TABLE 09.SMART RAILWAYS MARKET, BY OFFERING TYPE, 2019-2027 ($MILLION)
TABLE 10.SMART RAILWAYS MARKET REVENUE FOR SOLUTIONS, BY REGION 2019–2027 ($MILLION)
TABLE 11.SMART RAILWAYS MARKET REVENUE FOR COMPONENTS & DEVICES, BY REGION 2019–2027 ($MILLION)
TABLE 12.SMART RAILWAYS MARKET REVENUE FOR SERVICES, BY REGION 2019–2027 ($MILLION)
TABLE 13.NORTH AMERICA SMART RAILWAYS MARKET, BY SYSTEM, 2019–2027 ($MILLION)
TABLE 14.NORTH AMERICA SMART RAILWAYS MARKET, BY OFFERING TYPE, 2019–2027 ($MILLION)
TABLE 15.U.S. SMART RAILWAYS MARKET, BY SYSTEM, 2019–2027 ($MILLION)
TABLE 16.U.S. SMART RAILWAYS MARKET, BY OFFERING TYPE, 2019–2027 ($MILLION)
TABLE 17.CANADA SMART RAILWAYS MARKET, BY SYSTEM, 2019–2027 ($MILLION)
TABLE 18.CANADA SMART RAILWAYS MARKET, BY OFFERING TYPE, 2019–2027 ($MILLION)
TABLE 19.MEXICO SMART RAILWAYS MARKET, BY SYSTEM, 2019–2027 ($MILLION)
TABLE 20.MEXICO SMART RAILWAYS MARKET, BY OFFERING TYPE, 2019–2027 ($MILLION)
TABLE 21.EUROPE SMART RAILWAYS MARKET, BY SYSTEM, 2019–2027 ($MILLION)
TABLE 22.EUROPE SMART RAILWAYS MARKET, BY OFFERING TYPE, 2019–2027 ($MILLION)
TABLE 23.UK SMART RAILWAYS MARKET, BY SYSTEM, 2019–2027 ($MILLION)
TABLE 24.UK SMART RAILWAYS MARKET, BY OFFERING TYPE, 2019–2027 ($MILLION)
TABLE 25.GERMANY SMART RAILWAYS MARKET, BY SYSTEM, 2019–2027 ($MILLION)
TABLE 26.GERMANY SMART RAILWAYS MARKET, BY OFFERING TYPE, 2019–2027 ($MILLION)
TABLE 27.FRANCE SMART RAILWAYS MARKET, BY SYSTEM, 2019–2027 ($MILLION)
TABLE 28.FRANCE SMART RAILWAYS MARKET, BY OFFERING TYPE, 2019–2027 ($MILLION)
TABLE 29.SPAIN SMART RAILWAYS MARKET, BY SYSTEM, 2019–2027 ($MILLION)
TABLE 30.SPAIN SMART RAILWAYS MARKET, BY OFFERING TYPE, 2019–2027 ($MILLION)
TABLE 31.RUSSIA SMART RAILWAYS MARKET, BY SYSTEM, 2019–2027 ($MILLION)
TABLE 32.RUSSIA SMART RAILWAYS MARKET, BY OFFERING TYPE, 2019–2027 ($MILLION)
TABLE 33.REST OF EUROPE SMART RAILWAYS MARKET, BY SYSTEM, 2019–2027 ($MILLION)
TABLE 34.REST OF EUROPE SMART RAILWAYS MARKET, BY OFFERING TYPE, 2019–2027 ($MILLION)
TABLE 35.ASIA-PACIFIC SMART RAILWAYS MARKET, BY SYSTEM, 2019–2027 ($MILLION)
TABLE 36.ASIA-PACIFIC SMART RAILWAYS MARKET, BY OFFERING TYPE, 2019–2027 ($MILLION)
TABLE 37.CHINA SMART RAILWAYS MARKET, BY SYSTEM, 2019–2027 ($MILLION)
TABLE 38.CHINA SMART RAILWAYS MARKET, BY OFFERING TYPE, 2019–2027 ($MILLION)
TABLE 39.INDIA SMART RAILWAYS MARKET, BY SYSTEM, 2019–2027 ($MILLION)
TABLE 40.INDIA SMART RAILWAYS MARKET, BY OFFERING TYPE, 2019–2027 ($MILLION)
TABLE 41.JAPAN SMART RAILWAYS MARKET, BY SYSTEM, 2019–2027 ($MILLION)
TABLE 42.JAPAN SMART RAILWAYS MARKET, BY OFFERING TYPE, 2019–2027 ($MILLION)
TABLE 43.SOUTH KOREA SMART RAILWAYS MARKET, BY SYSTEM, 2019–2027 ($MILLION)
TABLE 44.SOUTH KOREA SMART RAILWAYS MARKET, BY OFFERING TYPE, 2019–2027 ($MILLION)
TABLE 45.REST OF ASIA-PACIFIC SMART RAILWAYS MARKET, BY SYSTEM, 2019–2027 ($MILLION)
TABLE 46.REST OF ASIA PACIFIC SMART RAILWAYS MARKET, BY OFFERING TYPE, 2019–2027 ($MILLION)
TABLE 47.LAMEA SMART RAILWAYS MARKET, BY SYSTEM, 2019–2027 ($MILLION)
TABLE 48.LAMEA SMART RAILWAYS MARKET, BY OFFERING TYPE, 2019–2027 ($MILLION)
TABLE 49.LATIN AMERICA SMART RAILWAYS MARKET, BY SYSTEM, 2019–2027 ($MILLION)
TABLE 50.LATIN AMERICA SMART RAILWAYS MARKET, BY OFFERING TYPE, 2019–2027 ($MILLION)
TABLE 51.MIDDLE EAST SMART RAILWAYS MARKET, BY SYSTEM, 2019–2027 ($MILLION)
TABLE 52.MIDDLE EAST SMART RAILWAYS MARKET, BY OFFERING TYPE, 2019–2027 ($MILLION)
TABLE 53.AFRICA SMART RAILWAYS MARKET, BY SYSTEM, 2019–2027 ($MILLION)
TABLE 54.AFRICA SMART RAILWAYS MARKET, BY OFFERING TYPE, 2019–2027 ($MILLION)
TABLE 55.ALSTOM SA.: COMPANY SNAPSHOT
TABLE 56.ALSTOM SA: OPERATING SEGMENTS
TABLE 57.ALSTOM SA.: PRODUCT PORTFOLIO
TABLE 58.ALSTOM SA. : KEY STRATEGIC MOVES AND DEVELOPMENTS
TABLE 59.BOMBARDIER INC.: COMPANY SNAPSHOT
TABLE 60.BOMBARDIER INC.: OPERATING SEGMENTS
TABLE 61.BOMBARDIER INC.: PRODUCT PORTFOLIO
TABLE 62.BOMBARDIER INC.: KEY STRATEGIC MOVES AND DEVELOPMENTS
TABLE 63.ABB LTD: COMPANY SNAPSHOT
TABLE 64.ABB LTD: OPERATING SEGMENTS
TABLE 65.ABB LTD: PRODUCT PORTFOLIO
TABLE 66.SIEMENS AG: COMPANY SNAPSHOT
TABLE 67.SIEMENS AG: OPERATING SEGMENTS
TABLE 68.SIEMENS AG: PRODUCT PORTFOLIO
TABLE 69.SIEMENS AG: KEY STRATEGIC MOVES AND DEVELOPMENTS
TABLE 70.CISCO SYSTEMS, INC.: COMPANY SNAPSHOT
TABLE 71.CISCO SYSTEMS, INC.: OPERATING SEGMENTS
TABLE 72.CISCO SYSTEMS, INC.: PRODUCT PORTFOLIO
TABLE 73.HUAWEI TECHNOLOGIES CO., LTD.: COMPANY SNAPSHOT
TABLE 74.HUAWEI TECHNOLOGIES CO., LTD.: OPERATING SEGMENTS
TABLE 75.HUAWEI TECHNOLOGIES CO., LTD.: PRODUCT PORTFOLIO
TABLE 76.IBM: COMPANY SNAPSHOT
TABLE 77.IBM OPERATING SEGMENTS
TABLE 78.IBM: PRODUCT PORTFOLIO
TABLE 79.INDRA SISTEMAS, S.A.: COMPANY SNAPSHOT
TABLE 80.INDRA SISTEMAS, S.A. OPERATING SEGMENTS
TABLE 81.INDRA SISTEMAS, S.A.: PRODUCT PORTFOLIO
TABLE 82.INDRA SISTEMAS, S.A.: KEY STRATEGIC MOVES AND DEVELOPMENTS
TABLE 83.HITACHI, LTD..: COMPANY SNAPSHOT
TABLE 84.HITACHI, LTD.. OPERATING SEGMENTS
TABLE 85.HITACHI, LTD..: PRODUCT PORTFOLIO
TABLE 86.HITACHI, LTD : KEY STRATEGIC MOVES AND DEVELOPMENTS
TABLE 87.AITEK S.P.A..: COMPANY SNAPSHOT
TABLE 88.AITEK S.P.A.: OPERATING SEGMENTS
TABLE 89.AITEK S.P.A.: PRODUCT PORTFOLIO
LIST OF FIGURES
FIGURE 01.KEY MARKET SEGMENTS
FIGURE 02.EXECUTIVE SUMMARY
FIGURE 03.EXECUTIVE SUMMARY
FIGURE 04.TOP IMPACTING FACTORS
FIGURE 05.TOP INVESTMENT POCKETS
FIGURE 06.TOP WINNING STRATEGIES, BY YEAR, 2017-2020*
FIGURE 07.TOP WINNING STRATEGIES, BY DEVELOPMENT, 2017-2020*
FIGURE 08.TOP WINNING STRATEGIES, BY COMPANY, 2017-2020*
FIGURE 09.MODERATE-TO-HIGH BARGAINING POWER OF SUPPLIERS
FIGURE 10.MODERATE-TO-HIGH THREAT OF NEW ENTRANTS
FIGURE 11.MODERATE-TO-HIGH THREAT OF SUBSTITUTES
FIGURE 12.MODERATE-TO-HIGH INTENSITY OF RIVALRY
FIGURE 13.MODERATE-TO-HIGH BARGAINING POWER OF BUYERS
FIGURE 14.MARKET SHARE ANALYSIS, 2019 (%)
FIGURE 15.GLOBAL SMART RAILWAYS MARKET, BY SYSTEM, 2019-2027
FIGURE 16.COMPARATIVE SHARE ANALYSIS OF SMART RAILWAYS MARKET FOR PASSENGER INFORMATION SYSTEM, BY COUNTRY, 2019 & 2027 ($MILLON)
FIGURE 17.COMPARATIVE SHARE ANALYSIS OF SMART RAILWAYS MARKET FOR RAIL & FREIGHT OPERATIONS MANAGEMENT SYSTEM, BY COUNTRY, 2019 & 2027 ($MILLON)
FIGURE 18.COMPARATIVE SHARE ANALYSIS OF SMART RAILWAYS MARKET FOR SMART SAFETY & SECURITY MONITORING SYSTEM, BY COUNTRY, 2019 & 2027 ($MILLON)
FIGURE 19.COMPARATIVE SHARE ANALYSIS OF SMART RAILWAYS MARKET FOR RAIL COMMUNICATION AND NETWORKING SYSTEM, BY COUNTRY, 2019 & 2027 ($MILLON)
FIGURE 20.COMPARATIVE SHARE ANALYSIS OF SMART RAILWAYS MARKET FOR SMART TICKETING SYSTEM, BY COUNTRY, 2019 & 2027 ($MILLON)
FIGURE 21.COMPARATIVE SHARE ANALYSIS OF SMART RAILWAYS MARKET FOR RAIL ANALYTICS SYSTEM, BY COUNTRY, 2019 & 2027 ($MILLON)
FIGURE 22.COMPARATIVE SHARE ANALYSIS OF SMART RAILWAYS MARKET FOR OTHERS, BY COUNTRY, 2019 & 2027 ($MILLON)
FIGURE 23.GLOBAL SMART RAILWAYS MARKET, BY OFFERING TYPE, 2019-2027
FIGURE 24.COMPARATIVE SHARE ANALYSIS OF SMART RAILWAYS MARKET FOR SOLUTIONS, BY COUNTRY, 2019 & 2027 ($MILLON)
FIGURE 25.COMPARATIVE SHARE ANALYSIS OF SMART RAILWAYS MARKET FOR COMPONENTS & DEVICES, BY COUNTRY, 2019 & 2027 ($MILLON)
FIGURE 26.COMPARATIVE SHARE ANALYSIS OF SMART RAILWAYS MARKET FOR SERVICES, BY COUNTRY, 2019 & 2027 ($MILLON)
FIGURE 27.SMART RAILWAYS MARKET, BY REGION, 2019-2027 (%)
FIGURE 28.COMPARATIVE SHARE ANALYSIS OF SMART RAILWAYS MARKET, BY COUNTRY, 2019–2027 (%)
FIGURE 29.U.S. SMART RAILWAYS MARKET, 2019–2027 ($MILLION)
FIGURE 30.CANADA SMART RAILWAYS MARKET, 2019–2027 ($MILLION)
FIGURE 31.MEXICO SMART RAILWAYS MARKET, 2019–2027 ($MILLION)
FIGURE 32.COMPARATIVE SHARE ANALYSIS OF SMART RAILWAYS MARKET, BY COUNTRY, 2019–2027 (%)
FIGURE 33.UK SMART RAILWAYS MARKET, 2019–2027 ($MILLION)
FIGURE 34.GERMANY SMART RAILWAYS MARKET, 2019–2027 ($MILLION)
FIGURE 35.FRANCE SMART RAILWAYS MARKET, 2019–2027 ($MILLION)
FIGURE 36.SPAIN SMART RAILWAYS MARKET, 2019–2027 ($MILLION)
FIGURE 37.RUSSIA SMART RAILWAYS MARKET, 2019–2027 ($MILLION)
FIGURE 38.REST OF EUROPE SMART RAILWAYS MARKET, 2019–2027 ($MILLION)
FIGURE 39.COMPARATIVE SHARE ANALYSIS OF SMART RAILWAYS MARKET, BY COUNTRY, 2019–2027 (%)
FIGURE 40.CHINA SMART RAILWAYS MARKET, 2019–2027 ($MILLION)
FIGURE 41.INDIA SMART RAILWAYS MARKET, 2019–2027 ($MILLION)
FIGURE 42.JAPAN SMART RAILWAYS MARKET, 2019–2027 ($MILLION)
FIGURE 43.SOUTH KOREA SMART RAILWAYS MARKET, 2019–2027 ($MILLION)
FIGURE 44.REST OF ASIA-PACIFIC SMART RAILWAYS MARKET, 2019–2027 ($MILLION)
FIGURE 45.COMPARATIVE SHARE ANALYSIS OF SMART RAILWAYS MARKET, BY COUNTRY, 2019–2027 (%)
FIGURE 46.LATIN AMERICA SMART RAILWAYS MARKET, 2019–2027 ($MILLION)
FIGURE 47.MIDDLE EAST SMART RAILWAYS MARKET, 2019–2027 ($MILLION)
FIGURE 48.AFRICA SMART RAILWAYS MARKET, 2019–2027 ($MILLION)
FIGURE 49.ALSTOM SA: REVENUE, 2018–2020 ($MILLION)
FIGURE 50.ALSTOM SA: REVENUE SHARE BY SEGMENT, 2020 (%)
FIGURE 51.ALSTOM SA: REVENUE SHARE BY REGION, 2020 (%)
FIGURE 52.BOMBARDIER INC.: REVENUE, 2017–2019 ($MILLION)
FIGURE 53.BOMBARDIER INC.: REVENUE SHARE BY SEGMENT, 2019 (%)
FIGURE 54.BOMBARDIER INC.: REVENUE SHARE BY REGION, 2019 (%)
FIGURE 55.ABB LTD: REVENUE, 2017–2019 ($MILLION)
FIGURE 56.ABB LTD: REVENUE SHARE BY SEGMENT, 2019 (%)
FIGURE 57.ABB LTD: REVENUE SHARE BY REGION, 2019 (%)
FIGURE 58.SIEMENS AG: REVENUE, 2018–2020 ($MILLION)
FIGURE 59.SIEMENS AG: REVENUE SHARE BY SEGMENT, 2020 (%)
FIGURE 60.SIEMENS AG: REVENUE SHARE BY REGION, 2020 (%)
FIGURE 61.CISCO SYSTEMS, INC.: REVENUE, 2017–2019 ($MILLION)
FIGURE 62.CISCO SYSTEMS, INC.: REVENUE SHARE BY SEGMENT, 2019 (%)
FIGURE 63.CISCO SYSTEMS, INC.: REVENUE SHARE BY REGION, 2019 (%)
FIGURE 64.HUAWEI TECHNOLOGIES CO., LTD.: REVENUE, 2017–2019 ($MILLION)
FIGURE 65.HUAWEI TECHNOLOGIES CO., LTD.: REVENUE SHARE BY SEGMENT, 2019 (%)
FIGURE 66.HUAWEI TECHNOLOGIES CO., LTD.: REVENUE SHARE BY REGION, 2019 (%)
FIGURE 67.IBM: REVENUE, 2017–2019 ($MILLION)
FIGURE 68.IBM: REVENUE SHARE BY SEGMENT, 2019 (%)
FIGURE 69.IBM: REVENUE SHARE BY REGION, 2019 (%)
FIGURE 70.INDRA SISTEMAS, S.A.: REVENUE, 2017–2019 ($MILLION)
FIGURE 71.INDRA SISTEMAS, S.A.: REVENUE SHARE BY SEGMENT, 2019 (%)
FIGURE 72.INDRA SISTEMAS, S.A.: REVENUE SHARE BY REGION, 2019 (%)
FIGURE 73.HITACHI, LTD.: REVENUE, 2017–2019 ($MILLION)
FIGURE 74.HITACHI, LTD..: REVENUE SHARE BY SEGMENT, 2019 (%)
FIGURE 75.HITACHI, LTD..: REVENUE SHARE BY REGION, 2019 (%)