Int'l : +1-503-894-6022 | Toll Free : +1-800-792-5285 | help@alliedmarketresearch.com
A05097 | Pages: 234 | Charts: 46 | Tables: 171 |
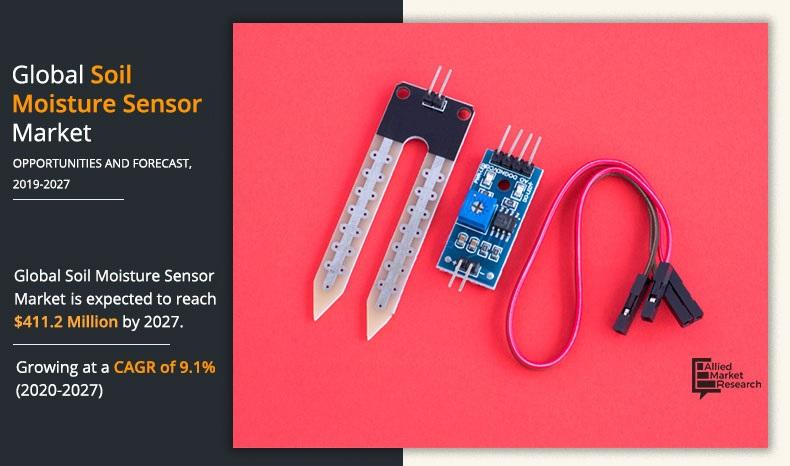
The global soil moisture sensor market was valued at $215.8 million in 2019 and is projected to reach $411.2 million by 2027, registering a CAGR of 9.1% from 2020 to 2027. Currently, the exponential growth of population is the major concern globally, which has led to more acquisition of land for building homes and increase in water consumption in these newly developed residential areas. Hence, the key resources required to produce food are anticipated to diminish in the future. As a result, producing the required quantity of food remains a critical issue. Thus, advancements in technology plays a vital role to improve the production yield and quality.
Soil moisture sensors are one of the prominent agricultural equipment used to gauge the volumetric water content within the soil. Soil moisture sensors enable farmers to take precise decisions in planning for agricultural activities. In addition, these sensors serve as useful equipment for environmentalists in determining the drought conditions and understand the biodiversity in a region. Moreover, they play an integral role in soil water profiling, pollution monitoring, civil engineering, and forestry. Considering these factors, soil moisture sensor market is estimated to witness a steady growth during the forecast period.
Factors such as surge in adoption of smart agricultural equipment and increase in research activities in the field of agriculture and environment act as the key driving forces of the global soil moisture sensor market growth. However, emergence of soilless farming techniques hinders the growth of the growth. On the contrary, the introduction of wireless soil moisture sensors is expected to offer remunerative opportunities for the growth of the global market during the forecast period.
The outbreak of COVID-19 has negligible impact on the soil moisture sensor market growth rate in 2020, and the market is anticipated to witness steady growth by the end of 2021. Although partial or complete lockdown was imposed across various countries, agricultural activities were exclusively excluded from lockdown. However, companies faced some delay in procuring raw materials. In addition, the disrupted global supply chain posed some challenges for manufacturers to reach their customers in niche areas. Despite these factors, agricultural activities continued, and the demand for soil moisture sensors from farmers prevailed.
[PRODUCTGRAPH]
The global soil moisture sensor market study covers 20 countries. The research includes a segment analysis of each country in terms of value for the projected period.
More than 1,500 product literatures, industry releases, annual reports, and other such documents of major soil moisture sensor market industry participants along with authentic industry journals, trade associations' releases, and government websites have been reviewed for generating high-value industry insights.
The study integrated high-quality data, professional opinions and analysis, and critical independent perspectives. The research approach is intended to provide a balanced view of global markets and to assist stakeholders in making educated decisions to achieve their most ambitious growth objectives.
The global shift towards precision agriculture, driven by the need for more efficient and sustainable farming practices, is a primary driver. Soil moisture sensors play a crucial role in monitoring water usage, helping farmers optimize irrigation and reduce water wastage. As climate change impacts water resources, the demand for precision tools like soil moisture sensors grows, particularly in water-scarce regions. As global populations increase, so does the demand for food. Farmers are under pressure to maximize crop yields, and efficient water management is essential for this. Soil moisture sensors allow for better control over irrigation, directly influencing crop health and productivity, which in turn drives the demand for these sensors in the agricultural sector.
The global soil moisture sensor market is segmented on the basis of product, type, application, and region. Depending on product, the market is fragmented into tensiometric, volumetric, and solid-state sensors. The volumetric segment dominated the soil moisture sensor market in terms of revenue in 2019, and is expected to follow the same trend during the forecast period.
[TYPEGRAPH]
On the basis of type, the market is segregated into analog and digital. The analog segment accounted for the highest market share in 2019, and is expected to grow at a high CAGR from 2020 to 2027. The applications covered in the study include agriculture, research, and others. The global soil moisture sensor industry is dominated by the agriculture segment in terms of value.
[APPLICATIONGRAPH]
Region wise, the global soil moisture sensor market is analyzed across North America (U.S., Canada, and Mexico), Europe (UK, Germany, France, and rest of Europe), Asia-Pacific (China, India, Japan, and rest of Asia-Pacific), and LAMEA (Latin America, Middle East, and Africa). North America accounted for the highest share, owing to the high dependency of agricultural activities on technology in this region.
[GEOGRAPHYGRAPH]
According to a study conducted by Paul Bullock, a soil scientist at the University of Manitoba, the growers in Canada have started to adopt farm-level soil moisture data, as it is benefitting to increase their output cost-effectively. Asia-Pacific was the second largest contributor in terms of revenue, and is expected to witness significant growth during the forecast period, owing to increase in awareness among farmers toward benefits of using soil moisture sensors for increasing productivity.
North America: North America is one of the leading regions in the soil moisture sensor market, driven by the early adoption of precision agriculture technologies and advanced irrigation techniques. The U.S., in particular, has a strong presence in the soil moisture sensor market due to the integration of IoT and smart farming practices.
Asia-Pacific: Asia-Pacific region is projected to witness the fastest growth in the coming years due to increasing agricultural activities in countries like China, India, and Australia. The region is experiencing a growing demand for efficient irrigation systems to combat water scarcity, which is a pressing issue in parts of Asia.
Europe: Europe is experiencing significant growth, particularly in countries like Germany, the UK, and the Netherlands. The region’s stringent environmental regulations, focus on sustainable farming, and government-led water conservation efforts are key growth drivers.
Latin America & Middle East: Latin America, particularly Brazil and Argentina, is emerging as a key soil moisture sensor market due to the region's vast agricultural base and increasing awareness about water management solutions. Governments in the region are promoting the adoption of precision farming technologies to enhance crop yield and sustainability. Water scarcity is a major concern in the Middle East and parts of Africa, which has spurred the demand for water-saving technologies like soil moisture sensors. Countries in the Gulf Cooperation Council (GCC) are focusing on the adoption of advanced farming techniques to ensure food security.
The significant impacting factors of the soil moisture sensor market include increase in demand for food, surge in population, limited availability of arable land, and technological development of agricultural equipment. However, emergence of soilless agriculture is expected to hinder the market growth. Conversely, emergence of wireless sensors is projected to offer remunerative opportunities to the soil moisture sensor industry. Each of these factors is anticipated to have a definite impact on the market during the forecast period.
Competitive analysis and profiles of the major soil moisture sensor market players, such as Acclima Inc., Delta-T Devices Ltd, METER Group Inc., OTT Hydromet GmbH, SDEC France, Smartcultiva Corporation, Spectrum Technologies Inc., Stevens Water Monitoring Systems Inc., Trellis, and Vegetronix Inc. are provided in this report. These key players have adopted various strategies, such as product portfolio expansion, mergers & acquisitions, agreements, geographical expansion, and collaborations, to enhance their market penetration and strengthen their position in the industry.
This report delivers in-depth insights into the soil moisture sensor market by product, type, application, and region, and key strategies employed by major players. It offers detailed soil moisture sensor market forecasts and emerging trends.
Tensiometric sensors measure the water tension in soil, indicating how easily plants can extract water. These sensors are widely used in agriculture for irrigation scheduling. These sensors are particularly popular in dry and arid regions where water conservation is critical. They help in understanding the water potential in the soil, allowing farmers to optimize irrigation schedules. Volumetric soil moisture sensors measure the volume of water present in the soil. These sensors are more precise than tensiometric sensors and are often used in research and high-precision farming applications. Volumetric sensors are benefiting from advancements in wireless and IoT technologies, which allow remote monitoring and data collection.
Digital sensors convert the moisture level readings into binary signals that can be easily interpreted by digital systems. These sensors are more accurate and easier to integrate with modern, smart farming systems. The integration of digital sensors with IoT networks and data analytics platforms is driving soil moisture sensor market growth, allowing for better water management and resource optimization.
Agriculture is the dominant application for soil moisture sensors, driven by the need for efficient water management and the increasing adoption of precision farming practices. High initial costs for advanced sensor systems and the need for technical knowledge can be barriers to adoption, particularly for small-scale farmers.
North America leads the soil moisture sensormarket due to early adoption of precision farming technologies and robust agricultural infrastructure. The U.S. and Canada are at the forefront of integrating soil moisture sensors with IoT systems, optimizing water usage in farming. Asia-Pacific is expected to see the fastest growth due to the large agricultural base and increasing demand for food security. Countries like China, India, and Australia are investing in smart irrigation systems and technologies to combat water scarcity. China and India are major markets due to their vast agricultural sectors, and government initiatives aimed at modernizing farming practices. Australia is adopting soil moisture sensors to optimize water usage in its agricultural activities, especially given its frequent droughts.
In 2024, a notable advancement in agricultural technology occurred with the launch of GroGuru's wireless soil sensor probe. This innovative device, developed in partnership with AquaCheck, integrates GroGuru's patented Wireless Underground System (WUGS) technology, which allows for continuous root zone monitoring of soil moisture and temperature in annual field crops..
In 2024 - Apollo Agriculture secured a $10 million investment in 2024 to expand its operations in Kenya, furthering the integration of digital platforms in African agriculture. Additionally, the U.S. and UAE-backed $9 billion investment into sustainable farming practices marks a significant commitment to agricultural innovation and modernization on a global scale.
Key Market Segments
Key Market Players
Chapter 1:Introduction
1.1.Report description
1.2.Key benefits for stakeholders
1.3.Key market segments
1.4.Research methodology
1.4.1.Primary research
1.4.2.Secondary research
1.4.3.Analyst tools and models
Chapter 2:Executive summary
2.1.Key findings
2.1.1.Top impacting factors
2.1.2.Top investment pockets
2.2.CXO perspective
Chapter 3:MARKET OVERVIEW
3.1.Market definition and scope
3.2.Parent/peer market overview
3.3.Porter’s five forces analysis
3.4.Value chain analysis
3.5.Patent analysis
3.5.1.By region (2017-2019)
3.5.2.By applicant
3.6.Market dynamics
3.6.1.Drivers
3.6.1.1.Soil moisture acts as a vital parameter for agriculture
3.6.1.2.Soil moisture assists understanding of functioning of natural environment
3.6.2.Restraint
3.6.2.1.Emergence of soilless farming techniques
3.6.3.Opportunities
3.6.3.1.Potential opportunities in developing countries
3.6.3.2.Emergence of wireless Soil Moisture Sensors
3.7.COVID Impact
3.7.1.Impact on market size
3.7.2.Application trends, preferences, and budget impact
3.7.3.Key player strategies to tackle negative impact
Chapter 4:Soil Moisture Sensor Market, By product
4.1.Overview
4.2.Tensiometric
4.2.1.Key market trends, growth factors, and opportunities
4.2.2.Market size and forecast, by region
4.2.3.Market analysis, by country
4.3.Volumetric
4.3.1.Key market trends, growth factors, and opportunities
4.3.2.Market size and forecast, by region
4.3.3.Market analysis, by country
4.4.Solid-state sensors
4.4.1.Key market trends, growth factors, and opportunities
4.4.2.Market size and forecast, by region
4.4.3.Market analysis, by country
Chapter 5:Soil Moisture Sensor Market, BY type
5.1.Overview
5.2.Analog
5.2.1.Key market trends, growth factors, and opportunities
5.2.2.Market size and forecast, by region
5.2.3.Market analysis, by country
5.3.Digital
5.3.1.Key market trends, growth factors, and opportunities
5.3.2.Market size and forecast, by region
5.3.3.Market analysis, by country
Chapter 6:Soil Moisture Sensor Market, BY application
6.1.Overview
6.2.Agriculture
6.2.1.Key market trends, growth factors, and opportunities
6.2.2.Market size and forecast, by region
6.2.3.Market analysis, by country
6.3.Research
6.3.1.Key market trends, growth factors, and opportunities
6.3.2.Market size and forecast, by region
6.3.3.Market analysis, by country
6.4.Others
6.4.1.Key market trends, growth factors, and opportunities
6.4.2.Market size and forecast, by region
6.4.3.Market analysis, by country
Chapter 7:Soil Moisture Sensor Market, BY Region
7.1.Overview
7.2.North America
7.2.1.Key market trends, growth factors, and opportunities
7.2.2.Market size and forecast, by product
7.2.3.Market size and forecast, by type
7.2.4.Market size and forecast, by application
7.2.5.Market analysis, by country
7.2.5.1.U.S.
7.2.5.1.1.Market size and forecast, by product type
7.2.5.1.2.Market size and forecast, by type
7.2.5.1.3.Market size and forecast, by application
7.2.5.2.Canada
7.2.5.2.1.Market size and forecast, by product
7.2.5.2.2.Market size and forecast, by type
7.2.5.2.3.Market size and forecast, by application
7.2.5.3.Mexico
7.2.5.3.1.Market size and forecast, by product
7.2.5.3.2.Market size and forecast, by type
7.2.5.3.3.Market size and forecast, by application
7.3.Europe
7.3.1.Key market trends, growth factors, and opportunities
7.3.2.Market size and forecast, by product
7.3.3.Market size and forecast, by type
7.3.4.Market size and forecast, by application
7.3.5.Market analysis, by country
7.3.5.1.UK
7.3.5.1.1.Market size and forecast, by product
7.3.5.1.2.Market size and forecast, by type
7.3.5.1.3.Market size and forecast, by application
7.3.5.2.Germany
7.3.5.2.1.Market size and forecast, by product
7.3.5.2.2.Market size and forecast, by type
7.3.5.2.3.Market size and forecast, by application
7.3.5.3.France
7.3.5.3.1.Market size and forecast, by product
7.3.5.3.2.Market size and forecast, by type
7.3.5.3.3.Market size and forecast, by application
7.3.5.4.Rest of Europe
7.3.5.4.1.Market size and forecast, by product
7.3.5.4.2.Market size and forecast, by type
7.3.5.4.3.Market size and forecast, by application
7.4.Asia-Pacific
7.4.1.Key market trends, growth factors, and opportunities
7.4.2.Market size and forecast, by product
7.4.3.Market size and forecast, by type
7.4.4.Market size and forecast, by application
7.4.5.Market analysis, by country
7.4.5.1.China
7.4.5.1.1.Market size and forecast, by product
7.4.5.1.2.Market size and forecast, by type
7.4.5.1.3.Market size and forecast, by application
7.4.5.2.Japan
7.4.5.2.1.Market size and forecast, by product
7.4.5.2.2.Market size and forecast, by type
7.4.5.2.3.Market size and forecast, by application
7.4.5.3.India
7.4.5.3.1.Market size and forecast, by product type
7.4.5.3.2.Market size and forecast, by type
7.4.5.3.3.Market size and forecast, by application
7.4.5.4.Rest of Asia-Pacific
7.4.5.4.1.Market size and forecast, by product
7.4.5.4.2.Market size and forecast, by type
7.4.5.4.3.Market size and forecast, by application
7.5.LAMEA
7.5.1.Key market trends, growth factors, and opportunities
7.5.2.Market size and forecast, by product type
7.5.3.Market size and forecast, by type
7.5.4.Market size and forecast, by application
7.5.5.Market analysis, by country
7.5.5.1.Latin America
7.5.5.1.1.Market size and forecast, by product
7.5.5.1.2.Market size and forecast, by type
7.5.5.1.3.Market size and forecast, by application
7.5.5.2.Middle East
7.5.5.2.1.Market size and forecast, by product
7.5.5.2.2.Market size and forecast, by type
7.5.5.2.3.Market size and forecast, by application
7.5.5.3.Africa
7.5.5.3.1.Market size and forecast, by product
7.5.5.3.2.Market size and forecast, by type
7.5.5.3.3.Market size and forecast, by application
Chapter 8:COMPETITIVE LANDSCAPE
8.1.INTRODUCTION
8.1.1.MARKET PLAYER POSITIONING, 2019
8.2.PRODUCT MAPPING OF TOP 10 PLAYER
8.3.COMPETITIVE DASHBOARD
8.4.COMPETITIVE HEATMAP
Chapter 9:COMPANY PROFILES
9.1.Acclima, Inc.
9.1.1.Company overview
9.1.2.Key executive
9.1.3.Company snapshot
9.1.4.Operating business segments
9.1.5.Product portfolio
9.2.Delta-T Devices Ltd.
9.2.1.Company overview
9.2.2.Key executive
9.2.3.Company snapshot
9.2.4.Operating business segments
9.2.5.Product portfolio
9.3.METER Group, Inc.
9.3.1.Company overview
9.3.2.Key executive
9.3.3.Company snapshot
9.3.4.Operating business segments
9.3.5.Product portfolio
9.4.OTT Hydromet GmbH
9.4.1.Company overview
9.4.2.Key executive
9.4.3.Company snapshot
9.4.4.Operating business segments
9.4.5.Product portfolio
9.5.SDEC France
9.5.1.Company overview
9.5.2.Key executive
9.5.3.Company snapshot
9.5.4.Operating business segments
9.5.5.Product portfolio
9.6.Smartcultiva Corporation
9.6.1.Company overview
9.6.2.Key executive
9.6.3.Company snapshot
9.6.4.Operating business segments
9.6.5.Product portfolio
9.7.Spectrum Technologies, Inc.
9.7.1.Company overview
9.7.2.Key executive
9.7.3.Company snapshot
9.7.4.Operating business segments
9.7.5.Product portfolio
9.8.Stevens Water Monitoring Systems Inc.
9.8.1.Company overview
9.8.2.Key executive
9.8.3.Company snapshot
9.8.4.Operating business segments
9.8.5.Product portfolio
9.9.Trellis, Inc.
9.9.1.Company overview
9.9.2.Key executive
9.9.3.Company snapshot
9.9.4.Operating business segments
9.9.5.Product portfolio
9.10.Vegetronix, Inc.
9.10.1.Company overview
9.10.2.Company snapshot
9.10.3.Operating business segments
9.10.4.Product portfolio
LIST OF TABLES
TABLE 01.GLOBAL SOIL MOISTURE SENSOR MARKET, BY PRODUCT, 2019-2027 ($MILLION)
TABLE 02.GLOBAL SOIL MOISTURE SENSOR MARKET VOLUME, BY PRODUCT, 2019-2027 (THOUSAND UNIT)
TABLE 03.TENSIOMETRIC SOIL MOISTURE SENSOR MARKET, BY REGION, 2019-2027 ($MILLION)
TABLE 04.TENSIOMETRIC SOIL MOISTURE SENSOR MARKET VOLUME, BY REGION, 2019-2027 (THOUSAND UNIT)
TABLE 05.VOLUMETRIC SOIL MOISTURE SENSOR MARKET, BY REGION, 2019-2027 ($MILLION)
TABLE 06.VOLUMETRIC SOIL MOISTURE SENSOR MARKET VOLUME, BY REGION, 2019-2027 (THOUSAND UNIT)
TABLE 07.SOLID-STATE SOIL MOISTURE SENSOR MARKET, BY REGION, 2019-2027 ($MILLION)
TABLE 08.SOLID-STATE SOIL MOISTURE SENSOR MARKET VOLUME, BY REGION, 2019-2027 (THOUSAND UNIT)
TABLE 09.GLOBAL SOIL MOISTURE SENSOR MARKET, BY TYPE, 2019-2027($MILLION)
TABLE 10.GLOBAL SOIL MOISTURE SENSOR MARKET VOLUME, BY TYPE, 2019-2027(THOUSAND UNIT)
TABLE 11.ANALOG SOIL MOISTURE SENSOR MARKET, BY REGION, 2019-2027 ($MILLION)
TABLE 12.ANALOG SOIL MOISTURE SENSOR MARKET VOLUME, BY REGION, 2019-2027 (THOUSAND UNIT)
TABLE 13.SOIL MOISTURE SENSOR MARKET FOR DIGITAL, BY REGION, 2019-2027 ($MILLION)
TABLE 14.SOIL MOISTURE SENSOR MARKET VOLUME FOR DIGITAL, BY REGION, 2019-2027 (THOUSAND UNIT)
TABLE 15.GLOBAL SOIL MOISTURE SENSOR MARKET, BY APPLICATION, 2019-2027($MILLION)
TABLE 16.GLOBAL SOIL MOISTURE SENSOR MARKET VOLUME, BY APPLICATION, 2019-2027($MILLION)
TABLE 17.SOIL MOISTURE SENSOR MARKET FOR AGRICULTURE, BY REGION, 2019-2027 ($MILLION)
TABLE 18.SOIL MOISTURE SENSOR MARKET VOLUME FOR AGRICULTURE, BY REGION, 2019-2027 (THOUSAND UNIT)
TABLE 19.SOIL MOISTURE SENSOR MARKET FOR RESEARCH, BY REGION, 2019-2027 ($MILLION)
TABLE 20.SOIL MOISTURE SENSOR MARKET VOLUME FOR RESEARCH, BY REGION, 2019-2027 (THOUSAND UNIT)
TABLE 21.SOIL MOISTURE SENSOR MARKET FOR OTHERS, BY REGION, 2019-2027 ($MILLION)
TABLE 22.SOIL MOISTURE SENSOR MARKET VOLUME FOR OTHERS, BY REGION, 2019-2027 (THOUSAND UNIT)
TABLE 23.SOIL MOISTURE SENSOR MARKET REVENUE, BY REGION, 2019–2027 ($MILLION)
TABLE 24.SOIL MOISTURE SENSOR MARKET VOLUME, BY REGION, 2019–2027 (THOUSAND UNIT)
TABLE 25.NORTH AMERICA SOIL MOISTURE SENSOR MARKET, BY PRODUCT, 2019–2027 ($MILLION)
TABLE 26.NORTH AMERICA SOIL MOISTURE SENSOR MARKET VOLUME, BY PRODUCT, 2019–2027 (THOUSAND UNIT)
TABLE 27.NORTH AMERICA SOIL MOISTURE SENSOR MARKET, BY TYPE, 2019–2027 ($MILLION)
TABLE 28.NORTH AMERICA SOIL MOISTURE SENSOR MARKET VOLUME, BY TYPE, 2019–2027 (THOUSAND UNIT)
TABLE 29.NORTH AMERICA SOIL MOISTURE SENSOR MARKET, BY APPLICATION, 2019–2027 ($MILLION)
TABLE 30.NORTH AMERICA SOIL MOISTURE SENSOR MARKET VOLUME, BY APPLICATION, 2019–2027 (THOUSAND UNIT)
TABLE 31.U.S. SOIL MOISTURE SENSOR MARKET, BY PRODUCT, 2019–2027 ($MILLION)
TABLE 32.U.S. SOIL MOISTURE SENSOR MARKET VOLUME, BY PRODUCT, 2019–2027 (THOUSAND UNIT)
TABLE 33.U.S. SOIL MOISTURE SENSOR MARKET, BY TYPE, 2019–2027 ($MILLION)
TABLE 34.U.S. SOIL MOISTURE SENSOR MARKET VOLUME, BY TYPE, 2019–2027 (THOUSAND UNIT)
TABLE 35.U.S. SOIL MOISTURE SENSOR MARKET, BY APPLICATION, 2019–2027 ($MILLION)
TABLE 36.U.S. SOIL MOISTURE SENSOR MARKET VOLUME, BY APPLICATION, 2019–2027 (THOUSAND UNIT)
TABLE 37.CANADA SOIL MOISTURE SENSOR MARKET, BY PRODUCT, 2019–2027 ($MILLION)
TABLE 38.CANADA SOIL MOISTURE SENSOR MARKET VOLUME, BY PRODUCT, 2019–2027 (THOUSAND UNIT)
TABLE 39.CANADA SOIL MOISTURE SENSOR MARKET, BY TYPE, 2019–2027 ($MILLION)
TABLE 40.CANADA SOIL MOISTURE SENSOR MARKET VOLUME, BY TYPE, 2019–2027 (THOUSAND UNIT)
TABLE 41.CANADA SOIL MOISTURE SENSOR MARKET, BY APPLICATION, 2019–2027 ($MILLION)
TABLE 42.CANADA SOIL MOISTURE SENSOR MARKET VOLUME, BY APPLICATION, 2019–2027 (THOUSAND UNIT)
TABLE 43.MEXICO SOIL MOISTURE SENSOR MARKET, BY PRODUCT, 2019–2027 ($MILLION)
TABLE 44.MEXICO SOIL MOISTURE SENSOR MARKET VOLUME, BY PRODUCT, 2019–2027 (THOUSAND UNIT)
TABLE 45.MEXICO SOIL MOISTURE SENSOR MARKET, BY TYPE, 2019–2027 ($MILLION)
TABLE 46.MEXICO SOIL MOISTURE SENSOR MARKET VOLUME, BY TYPE, 2019–2027 (THOUSAND UNIT)
TABLE 47.MEXICO SOIL MOISTURE SENSOR MARKET, BY APPLICATION, 2019–2027 ($MILLION)
TABLE 48.MEXICO SOIL MOISTURE SENSOR MARKET VOLUME, BY APPLICATION, 2019–2027 (THOUSAND UNIT)
TABLE 49.EUROPE SOIL MOISTURE SENSOR MARKET, BY PRODUCT, 2019–2027 ($MILLION)
TABLE 50.EUROPE SOIL MOISTURE SENSOR MARKET VOLUME, BY PRODUCT, 2019–2027 (THOUSAND UNIT)
TABLE 51.EUROPE SOIL MOISTURE SENSOR MARKET, BY TYPE, 2019–2027 ($MILLION)
TABLE 52.EUROPE SOIL MOISTURE SENSOR MARKET VOLUME, BY TYPE, 2019–2027 (THOUSAND UNIT)
TABLE 53.EUROPE SOIL MOISTURE SENSOR MARKET, BY APPLICATION, 2019–2027 ($MILLION)
TABLE 54.EUROPE SOIL MOISTURE SENSOR MARKET VOLUME, BY APPLICATION, 2019–2027 (THOUSAND UNIT)
TABLE 55.UK SOIL MOISTURE SENSOR MARKET, BY PRODUCT, 2019–2027 ($MILLION)
TABLE 56.UK SOIL MOISTURE SENSOR MARKET VOLUME, BY PRODUCT, 2019–2027 (THOUSAND UNIT)
TABLE 57.UK SOIL MOISTURE SENSOR MARKET, BY TYPE, 2019–2027 ($MILLION)
TABLE 58.UK SOIL MOISTURE SENSOR MARKET VOLUME, BY TYPE, 2019–2027 (THOUSAND UNIT)
TABLE 59.UK SOIL MOISTURE SENSOR MARKET, BY APPLICATION, 2019–2027 ($MILLION)
TABLE 60.UK SOIL MOISTURE SENSOR MARKET VOLUME, BY APPLICATION, 2019–2027 (THOUSAND UNIT)
TABLE 61.GERMANY SOIL MOISTURE SENSOR MARKET, BY PRODUCT, 2019–2027 ($MILLION)
TABLE 62.GERMANY SOIL MOISTURE SENSOR MARKET VOLUME, BY PRODUCT, 2019–2027 (THOUSAND UNIT)
TABLE 63.GERMANY SOIL MOISTURE SENSOR MARKET, BY TYPE, 2019–2027 ($MILLION)
TABLE 64.GERMANY SOIL MOISTURE SENSOR MARKET VOLUME, BY TYPE, 2019–2027 (THOUSAND UNIT)
TABLE 65.GERMANY SOIL MOISTURE SENSOR MARKET, BY APPLICATION, 2019–2027 ($MILLION)
TABLE 66.GERMANY SOIL MOISTURE SENSOR MARKET VOLUME, BY APPLICATION, 2019–2027 (THOUSAND UNIT)
TABLE 67.FRANCE SOIL MOISTURE SENSOR MARKET, BY PRODUCT, 2019–2027 ($MILLION)
TABLE 68.FRANCE SOIL MOISTURE SENSOR MARKET VOLUME, BY PRODUCT, 2019–2027 (THOUSAND UNIT)
TABLE 69.FRANCE SOIL MOISTURE SENSOR MARKET, BY TYPE, 2019–2027 ($MILLION)
TABLE 70.FRANCE SOIL MOISTURE SENSOR MARKET VOLUME, BY TYPE, 2019–2027 (THOUSAND UNIT)
TABLE 71.FRANCE SOIL MOISTURE SENSOR MARKET, BY APPLICATION, 2019–2027 ($MILLION)
TABLE 72.FRANCE SOIL MOISTURE SENSOR MARKET VOLUME, BY APPLICATION, 2019–2027 (THOUSAND UNIT)
TABLE 73.REST OF EUROPE SOIL MOISTURE SENSOR MARKET, BY PRODUCT, 2019–2027 ($MILLION)
TABLE 74.REST OF EUROPE SOIL MOISTURE SENSOR MARKET VOLUME, BY PRODUCT, 2019–2027 (THOUSAND UNIT)
TABLE 75.REST OF EUROPE SOIL MOISTURE SENSOR MARKET, BY TYPE, 2019–2027 ($MILLION)
TABLE 76.REST OF EUROPE SOIL MOISTURE SENSOR MARKET VOLUME, BY TYPE, 2019–2027 (THOUSAND UNIT)
TABLE 77.REST OF EUROPE SOIL MOISTURE SENSOR MARKET, BY APPLICATION, 2019–2027 ($MILLION)
TABLE 78.REST OF EUROPE SOIL MOISTURE SENSOR MARKET VOLUME, BY APPLICATION, 2019–2027 (THOUSAND UNIT)
TABLE 79.ASIA-PACIFIC SOIL MOISTURE SENSOR MARKET, BY PRODUCT, 2019–2027 ($MILLION)
TABLE 80.ASIA-PACIFIC SOIL MOISTURE SENSOR MARKET VOLUME, BY PRODUCT, 2019–2027 (THOUSAND UNIT)
TABLE 81.ASIA-PACIFIC SOIL MOISTURE SENSOR MARKET, BY TYPE, 2019–2027 ($MILLION)
TABLE 82.ASIA-PACIFIC SOIL MOISTURE SENSOR MARKET VOLUME, BY TYPE, 2019–2027 (THOUSAND UNIT)
TABLE 83.ASIA-PACIFIC SOIL MOISTURE SENSOR MARKET, BY APPLICATION, 2019–2027 ($MILLION)
TABLE 84.ASIA-PACIFIC SOIL MOISTURE SENSOR MARKET VOLUME, BY APPLICATION, 2019–2027 (THOUSAND UNIT)
TABLE 85.CHINA SOIL MOISTURE SENSOR MARKET, BY PRODUCT, 2019–2027 ($MILLION)
TABLE 86.CHINA SOIL MOISTURE SENSOR MARKET VOLUME, BY PRODUCT, 2019–2027 (THOUSAND UNIT)
TABLE 87.CHINA SOIL MOISTURE SENSOR MARKET, BY TYPE, 2019–2027 ($MILLION)
TABLE 88.CHINA SOIL MOISTURE SENSOR MARKET VOLUME, BY TYPE, 2019–2027 (THOUSAND UNIT)
TABLE 89.CHINA SOIL MOISTURE SENSOR MARKET, BY APPLICATION, 2019–2027 ($MILLION)
TABLE 90.CHINA SOIL MOISTURE SENSOR MARKET VOLUME, BY APPLICATION, 2019–2027 (THOUSAND UNIT)
TABLE 91.JAPAN SOIL MOISTURE SENSOR MARKET, BY PRODUCT, 2019–2027 ($MILLION)
TABLE 92.JAPAN SOIL MOISTURE SENSOR MARKET VOLUME, BY PRODUCT, 2019–2027 (THOUSAND UNIT)
TABLE 93.JAPAN SOIL MOISTURE SENSOR MARKET, BY TYPE, 2019–2027 ($MILLION)
TABLE 94.JAPAN SOIL MOISTURE SENSOR MARKET VOLUME, BY TYPE, 2019–2027 (THOUSAND UNIT)
TABLE 95.JAPAN SOIL MOISTURE SENSOR MARKET, BY APPLICATION, 2019–2027 ($MILLION)
TABLE 96.JAPAN SOIL MOISTURE SENSOR MARKET VOLUME, BY APPLICATION, 2019–2027 (THOUSAND UNIT)
TABLE 97.INDIA SOIL MOISTURE SENSOR MARKET, BY PRODUCT, 2019–2027 ($MILLION)
TABLE 98.INDIA SOIL MOISTURE SENSOR MARKET VOLUME, BY PRODUCT, 2019–2027 (THOUSAND UNIT)
TABLE 99.INDIA SOIL MOISTURE SENSOR MARKET, BY TYPE, 2019–2027 ($MILLION)
TABLE 100.INDIA SOIL MOISTURE SENSOR MARKET VOLUME, BY TYPE, 2019–2027 (THOUSAND UNIT)
TABLE 101.INDIA SOIL MOISTURE SENSOR MARKET, BY APPLICATION, 2019–2027 ($MILLION)
TABLE 102.INDIA SOIL MOISTURE SENSOR MARKET VOLUME, BY APPLICATION, 2019–2027 (THOUSAND UNIT)
TABLE 103.REST OF ASIA-PACIFIC SOIL MOISTURE SENSOR MARKET, BY PRODUCT, 2019–2027 ($MILLION)
TABLE 104.REST OF ASIA-PACIFIC SOIL MOISTURE SENSOR MARKET VOLUME, BY PRODUCT, 2019–2027 (THOUSAND UNIT)
TABLE 105.REST OF ASIA-PACIFIC SOIL MOISTURE SENSOR MARKET, BY TYPE, 2019–2027 ($MILLION)
TABLE 106.REST OF ASIA-PACIFIC SOIL MOISTURE SENSOR MARKET VOLUME, BY TYPE, 2019–2027 (THOUSAND UNIT)
TABLE 107.REST OF ASIA-PACIFIC SOIL MOISTURE SENSOR MARKET, BY APPLICATION, 2019–2027 ($MILLION)
TABLE 108.REST OF ASIA-PACIFIC SOIL MOISTURE SENSOR MARKET VOLUME, BY APPLICATION, 2019–2027 (THOUSAND UNIT)
TABLE 109.LAMEA SOIL MOISTURE SENSOR MARKET, BY PRODUCT, 2019–2027 ($MILLION)
TABLE 110.LAMEA SOIL MOISTURE SENSOR MARKET VOLUME, BY PRODUCT, 2019–2027 (THOUSAND UNIT)
TABLE 111.LAMEA SOIL MOISTURE SENSOR MARKET, BY TYPE, 2019–2027 ($MILLION)
TABLE 112.LAMEA SOIL MOISTURE SENSOR MARKET VOLUME, BY TYPE, 2019–2027 (THOUSAND UNIT)
TABLE 113.LAMEA SOIL MOISTURE SENSOR MARKET, BY APPLICATION, 2019–2027 ($MILLION)
TABLE 114.LAMEA SOIL MOISTURE SENSOR MARKET VOLUME, BY APPLICATION, 2019–2027 (THOUSAND UNIT)
TABLE 115.LATIN AMERICA SOIL MOISTURE SENSOR MARKET, BY PRODUCT, 2019–2027 ($MILLION)
TABLE 116.LATIN AMERICA SOIL MOISTURE SENSOR MARKET VOLUME, BY PRODUCT, 2019–2027 (THOUSAND UNIT)
TABLE 117.LATIN AMERICA SOIL MOISTURE SENSOR MARKET, BY TYPE, 2019–2027 ($MILLION)
TABLE 118.LATIN AMERICA SOIL MOISTURE SENSOR MARKET VOLUME, BY TYPE, 2019–2027 (THOUSAND UNIT)
TABLE 119.LATIN AMERICA SOIL MOISTURE SENSOR MARKET, BY APPLICATION, 2019–2027 ($MILLION)
TABLE 120.LATIN AMERICA SOIL MOISTURE SENSOR MARKET VOLUME, BY APPLICATION, 2019–2027 (THOUSAND UNIT)
TABLE 121.MIDDLE EAST SOIL MOISTURE SENSOR MARKET, BY PRODUCT, 2019–2027 ($MILLION)
TABLE 122.MIDDLE EAST SOIL MOISTURE SENSOR MARKET VOLUME, BY PRODUCT, 2019–2027 (THOUSAND UNIT)
TABLE 123.MIDDLE EAST SOIL MOISTURE SENSOR MARKET, BY TYPE, 2019–2027 ($MILLION)
TABLE 124.MIDDLE EAST SOIL MOISTURE SENSOR MARKET VOLUME, BY TYPE, 2019–2027 (THOUSAND UNIT)
TABLE 125.MIDDLE EAST SOIL MOISTURE SENSOR MARKET, BY APPLICATION, 2019–2027 ($MILLION)
TABLE 126.MIDDLE EAST SOIL MOISTURE SENSOR MARKET VOLUME, BY APPLICATION, 2019–2027 (THOUSAND UNIT)
TABLE 127.AFRICA SOIL MOISTURE SENSOR MARKET, BY PRODUCT, 2019–2027 ($MILLION)
TABLE 128.AFRICA SOIL MOISTURE SENSOR MARKET VOLUME, BY PRODUCT, 2019–2027 (THOUSAND UNIT)
TABLE 129.AFRICA SOIL MOISTURE SENSOR MARKET, BY TYPE, 2019–2027 ($MILLION)
TABLE 130.AFRICA SOIL MOISTURE SENSOR MARKET VOLUME, BY TYPE, 2019–2027 (THOUSAND UNIT)
TABLE 131.AFRICA SOIL MOISTURE SENSOR MARKET, BY APPLICATION, 2019–2027 ($MILLION)
TABLE 132.AFRICA SOIL MOISTURE SENSOR MARKET VOLUME, BY APPLICATION, 2019–2027 (THOUSAND UNIT)
TABLE 133.KEY EXECUTIVE
TABLE 134.ACCLIMA, INC.: COMPANY SNAPSHOT
TABLE 135.ACCLIMA, INC.: OPERATING SEGMENTS
TABLE 136.ACCLIMA, INC.: PRODUCT PORTFOLIO
TABLE 137.KEY EXECUTIVE
TABLE 138.DELTA-T DEVICES LTD.: COMPANY SNAPSHOT
TABLE 139.DELTA-T DEVICES LTD.: OPERATING SEGMENTS
TABLE 140.DELTA-T DEVICES LTD.: PRODUCT PORTFOLIO
TABLE 141.KEY EXECUTIVE
TABLE 142.METER GROUP, INC.: COMPANY SNAPSHOT
TABLE 143.METER GROUP, INC.: OPERATING SEGMENTS
TABLE 144.METER GROUP, INC.: PRODUCT PORTFOLIO
TABLE 145.KEY EXECUTIVE
TABLE 146.OTT HYDROMET GMBH: COMPANY SNAPSHOT
TABLE 147.OTT HYDROMET GMBH: OPERATING SEGMENTS
TABLE 148.OTT HYDROMET GMBH: PRODUCT PORTFOLIO
TABLE 149.KEY EXECUTIVE
TABLE 150.SDEC FRANCE: COMPANY SNAPSHOT
TABLE 151.SDEC FRANCE: OPERATING SEGMENTS
TABLE 152.SDEC FRANCE: PRODUCT PORTFOLIO
TABLE 153.KEY EXECUTIVE
TABLE 154.SMARTCULTIVA CORPORATION: COMPANY SNAPSHOT
TABLE 155.SMARTCULTIVA CORPORATION: OPERATING SEGMENTS
TABLE 156.SMARTCULTIVA CORPORATION: PRODUCT PORTFOLIO
TABLE 157.KEY EXECUTIVE
TABLE 158.SPECTRUM TECHNOLOGIES, INC.: COMPANY SNAPSHOT
TABLE 159.SPECTRUM TECHNOLOGIES, INC.: OPERATING SEGMENTS
TABLE 160.SPECTRUM TECHNOLOGIES, INC.: PRODUCT PORTFOLIO
TABLE 161.KEY EXECUTIVE
TABLE 162.STEVENS WATER MONITORING SYSTEMS INC.: COMPANY SNAPSHOT
TABLE 163.STEVENS WATER MONITORING SYSTEMS INC.: OPERATING SEGMENTS
TABLE 164.STEVENS WATER MONITORING SYSTEMS INC.: PRODUCT PORTFOLIO
TABLE 165.KEY EXECUTIVE
TABLE 166.TRELLIS, INC.: COMPANY SNAPSHOT
TABLE 167.TRELLIS, INC.: OPERATING SEGMENTS
TABLE 168.TRELLIS: PRODUCT PORTFOLIO
TABLE 169.VEGETRONIX, INC.: COMPANY SNAPSHOT
TABLE 170.VEGETRONIX, INC.: OPERATING SEGMENTS
TABLE 171.VEGETRONIX, INC.: PRODUCT PORTFOLIO
LIST OF FIGURES
FIGURE 01.KEY MARKET SEGMENTS
FIGURE 02.EXECUTIVE SUMMARY, BY SEGMENTATION
FIGURE 03.EXECUTIVE SUMMARY, BY REGION
FIGURE 04.TOP IMPACTING FACTORS
FIGURE 05.TOP INVESTMENT POCKETS
FIGURE 06.MODERATE BARGAINING POWER OF SUPPLIERS
FIGURE 07.MODERATE THREAT OF NEW ENTRANTS
FIGURE 08.MODERATE TO HIGH THREAT OF SUBSTITUTES
FIGURE 09.MODERATE INTENSITY OF RIVALRY
FIGURE 10.MODERATE BARGAINING POWER OF BUYERS
FIGURE 11.PATENT ANALYSIS, BY COUNTRY
FIGURE 12.PATENT ANALYSIS, BY APPLICANT
FIGURE 13.GLOBAL SOIL MOISTURE SENSOR MARKET SHARE, BY PRODUCT, 2019–2027 (%)
FIGURE 14.COMPARATIVE SHARE ANALYSIS OF TENSIOMETRIC SOIL MOISTURE SENSOR MARKET, BY COUNTRY, 2019 & 2027 (%)
FIGURE 15.COMPARATIVE SHARE ANALYSIS OF VOLUMETRIC SOIL MOISTURE SENSOR MARKET, BY COUNTRY, 2019 & 2027 (%)
FIGURE 16.COMPARATIVE SHARE ANALYSIS SOLID-STATE SOIL MOISTURE SENSOR MARKET, BY COUNTRY, 2019 & 2027 (%)
FIGURE 17.GLOBAL SOIL MOISTURE SENSOR MARKET SHARE, BY TYPE, 2019–2027 (%)
FIGURE 18.COMPARATIVE SHARE ANALYSIS OF ANALOG SOIL MOISTURE SENSOR MARKET, BY COUNTRY, 2019 & 2027 (%)
FIGURE 19.COMPARATIVE SHARE ANALYSIS OF SOIL MOISTURE SENSOR MARKET FOR DIGITAL, BY COUNTRY, 2019 & 2027 (%)
FIGURE 20.GLOBAL SOIL MOISTURE SENSOR MARKET SHARE, BY APPLICATION, 2019–2027 (%)
FIGURE 21.COMPARATIVE SHARE ANALYSIS OF SOIL MOISTURE SENSOR MARKET FOR AGRICULTURE, BY COUNTRY, 2019 & 2027 (%)
FIGURE 22.COMPARATIVE SHARE ANALYSIS OF SOIL MOISTURE SENSOR MARKET FOR RESEARCH, BY COUNTRY, 2019 & 2027 (%)
FIGURE 23.COMPARATIVE SHARE ANALYSIS OF SOIL MOISTURE SENSOR MARKET FOR OTHERS, BY COUNTRY, 2019 & 2027 (%)
FIGURE 24.SOIL MOISTURE SENSOR MARKET, BY REGION, 2019-2027 (%)
FIGURE 25.COMPARATIVE SHARE ANALYSIS OF NORTH AMERICA SOIL MOISTURE SENSOR MARKET, BY COUNTRY, 2019–2027 (%)
FIGURE 26.U.S. SOIL MOISTURE SENSOR MARKET, 2019–2027 ($MILLION)
FIGURE 27.CANADA SOIL MOISTURE SENSOR MARKET, 2019–2027 ($MILLION)
FIGURE 28.MEXICO SOIL MOISTURE SENSOR MARKET, 2019–2027 ($MILLION)
FIGURE 29.COMPARATIVE SHARE ANALYSIS OF EUROPE SOIL MOISTURE SENSOR MARKET, BY COUNTRY, 2019–2027 (%)
FIGURE 30.UK SOIL MOISTURE SENSOR MARKET, 2019–2027 ($MILLION)
FIGURE 31.GERMANY SOIL MOISTURE SENSOR MARKET, 2019–2027 ($MILLION)
FIGURE 32.FRANCE SOIL MOISTURE SENSOR MARKET, 2019–2027 ($MILLION)
FIGURE 33.REST OF EUROPE SOIL MOISTURE SENSOR MARKET, 2019–2027 ($MILLION)
FIGURE 34.COMPARATIVE SHARE ANALYSIS OF ASIA-PACIFIC SOIL MOISTURE SENSOR MARKET, BY COUNTRY, 2019–2027 (%)
FIGURE 35.CHINA SOIL MOISTURE SENSOR MARKET, 2019–2027 ($MILLION)
FIGURE 36.JAPAN SOIL MOISTURE SENSOR MARKET, 2019–2027 ($MILLION)
FIGURE 37.INDIA SOIL MOISTURE SENSOR MARKET, 2019–2027 ($MILLION)
FIGURE 38.REST OF ASIA-PACIFIC SOIL MOISTURE SENSOR MARKET, 2019–2027 ($MILLION)
FIGURE 39.COMPARATIVE SHARE ANALYSIS OF LAMEA SOIL MOISTURE SENSOR MARKET, BY COUNTRY, 2019–2027 (%)
FIGURE 40.LATIN AMERICA SOIL MOISTURE SENSOR MARKET, 2019–2027 ($MILLION)
FIGURE 41.MIDDLE EAST SOIL MOISTURE SENSOR MARKET, 2019–2027 ($MILLION)
FIGURE 42.AFRICA SOIL MOISTURE SENSOR MARKET, 2019–2027 ($MILLION)
FIGURE 43.MARKET PLAYER POSITIONING, 2019
FIGURE 44.PRODUCT MAPPING OF TOP 10 PLAYERS
FIGURE 45.COMPETITIVE DASHBOARD
FIGURE 46.COMPETITIVE HEATMAP OF KEY PLAYERS