Int'l : +1-503-894-6022 | Toll Free : +1-800-792-5285 | help@alliedmarketresearch.com
A10289 | Pages: 288 | Charts: 57 | Tables: 161 |
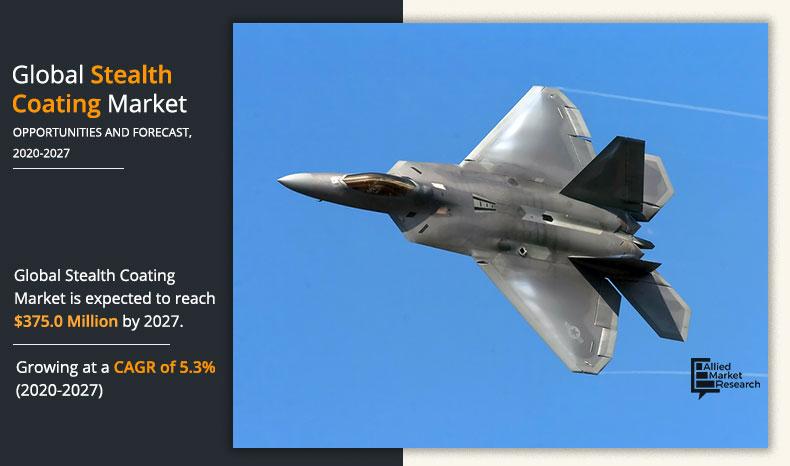
The global stealth coating market was valued at $249.0 million in 2019, and is projected to reach $375.0 million by 2027, growing at a CAGR of 5.3% from 2020 to 2027.
[COVIDIMPACTSTATEMENT]
Stealth coating is a radar absorbing material applied on the aircrafts to reduce radar cross-section; thereby, making them difficult to detect by radars. In addition, it is also applied on the cars for UV protection and protection from chips, scratches, road debris, & malicious damages.
Get more information on this report : Request Sample Pages
The global stealth coating market is primarily driven by surge in demand for stealth coatings from aerospace & defense and automotive industry as these coatings provide several properties such as strength, durability, and chemical resistance. In addition, stealth coatings have a very high heat deflection temperature and provides a scratch and impact-resistant finish. Furthermore, it also provides a high level of ultraviolet (UV) & water resistance and are easy to clean. In addition, consumption of stealth coating across the U.S. has been increased significantly in past three decades, owing to surge in production of stealth aircrafts, naval ships, and drones such as F-22 Raptor, F-35 Lightning II, and B-2 Spirit, Independence-class littoral combat ship, Zumwalt-class destroyer, Northrop Grumman RQ-180, and Lockheed Martin RQ-170 Sentinel. In addition, countries such as Russia and China have also developed stealth aircrafts such as Sukhoi Su-57 and Chengdu J-20, and are investing heavily on the development of stealth technology, which is likely to surge the demand for stealth coating during the forecast period.
However, high cost of stealth coating and decline in production of stealth aircrafts, ships, and drones amid the lockdowns declared by the government of various countries such as Russia, China, and Russia due to outbreak of COVID-19 pandemic is expected to restrain the stealth coating market growth. Furthermore, surge in investment by developing countries such as China and India in the development and production of stealth aircrafts, ships, and drones are likely to provide opportunities for the growth of the global stealth coating market.
The global stealth coating market size is segmented on the basis of resin type, application, and region. On the basis of resin type, it is divided into epoxy, polyurethane, and polyimide. By application, it is fragmented into aerospace & defense, and automotive. Region wise, the stealth coating market is analyzed across North America, Europe, Asia-Pacific, and LAMEA.
The major key players operating in the global stealth coating market include Intermat Defense, CFI Solutions, Hyper Stealth Technologies Pvt Ltd., Stealth Coatings Inc., Micromag, Veil Corporation, and Stealth Veils. These major key players adopt strategy, such as product launch, to stay competitive in the global stealth coating market.
North America accounted for the major share in 2019. The demand for stealth coating across North America is driven by growing aircraft production, especially in the U.S., and rising consumption of stealth coatings in luxurious cars. To protect their manned and unmanned aircraft from enemy radar, the U.S. military and its allies are increasingly becoming dependent on stealth technology. Owing to this the demand for stealth coating across the region is expected to surge significantly during the forecast period.
[REGIONGRAPH]
Get more information on this report : Request Sample Pages
The epoxy stealth coating segment accounted for the major stealth coating market share in 2019, owing to their increasing applications in the aerospace & defense and automotive industry. These coatings offer several properties including durability, strength, and chemical resistance. Additionally, it also has a very high heat deflection temperature and provides a scratch and impact-resistant finish than any other stealth coatings. It also provides a high level of UV & water resistance and are easy to clean. Due to these properties, its demand is anticipated to surge during the forecast period across the aerospace & defense and automotive industries around the world.
[RESINTYPEGRAPH]
Get more information on this report : Request Sample Pages
The aerospace & defense segment accounted for the major market share in 2019. Stealth technology plays a vital role in next-generation military assets such as aircraft, ships, and drones. The increasing aircraft production and demand along with technological innovations is anticipated to boost the growth of the stealth coating market during the forecast market.
[APPLICATIONGRAPH]
Get more information on this report : Request Sample Pages
COVID-19 analysis:
The coronavirus (COVID-19) pandemic situation has declined the sales of stealth coating. Due to COVID-19 pandemic the stealth aircraft manufacturing companies across the globe have halted their production activities amid lockdown. Due to this the demand for stealth coating has been hampered significantly. In addition, due to disrupted supply of automotive component amid lockdown the automobile manufacturers have halted their operation. This factor has led to decline in demand for stealth coating from the automotive industry.
Key benefits for stakeholders
Key Market Segments
Key Market Players
CHAPTER 1:INTRODUCTION
1.1.Report description
1.2.Key benefits for stakeholders
1.3.Key market segments
1.4.Research methodology
1.4.1.Secondary research
1.4.2.Primary research
1.5.Analyst tools and models
CHAPTER 2:EXECUTIVE SUMMARY
2.1.Key findings of the study
2.2.CXO perspective
CHAPTER 3:MARKET OVERVIEW
3.1.Market definition and scope
3.2.Key findings
3.2.1.Top investment pockets
3.3.Porter’s five forces analysis
3.4.Pricing analysis
3.4.1.Pricing analysis, by resin type, 2019–2027
3.4.2.Pricing analysis, by application, 2019–2027
3.4.3.Pricing analysis, by region, 2019–2027
3.5.Value chain analysis
3.6.Patent analysis
3.7.Impact of government regulations on the global stealth coating market
3.8.Market dynamics
3.8.1.Drivers
3.8.1.1.Rising demand for epoxy stealth coatings
3.8.1.2.Growing application of stealth coatings in aerospace & defense sector
3.8.1.3.Surge in consumption of stealth coating in the U.S
3.8.2.Restraints
3.8.2.1.High cost of stealth coating
3.8.2.2.Halted aircraft production amid lockdown due to outbreak of Covid-19
3.8.3.Opportunity
3.8.3.1.Surge in investment in R&D of stealth technology
3.9.Impact of COVID-19 on the global stealth coating market
CHAPTER 4:GLOBAL STEALTH COATING MARKET, BY RESIN TYPE
4.1.Overview
4.1.1.Market size and forecast
4.2.Epoxy
4.2.1.Key market trends, growth factors, and opportunities
4.2.2.Market size and forecast, by region
4.2.3.Market share analysis, by country
4.3.Polyurethane
4.3.1.Key market trends, growth factors, and opportunities
4.3.2.Market size and forecast, by region
4.3.3.Market share analysis, by country
4.4.Polyimide
4.4.1.Key market trends, growth factors, and opportunities
4.4.2.Market size and forecast, by region
4.4.3.Market share analysis, by country
CHAPTER 5:GLOBAL STEALTH COATING MARKET, BY APPLICATION
5.1.Overview
5.1.1.Market size and forecast
5.2.Aerospace & Defense
5.2.1.Key market trends, growth factors, and opportunities
5.2.2.Market size and forecast, by region
5.2.3.Market share analysis, by country
5.3.Automotive
5.3.1.Key market trends, growth factors, and opportunities
5.3.2.Market size and forecast, by region
5.3.3.Market share analysis, by country
CHAPTER 6:GLOBAL STEALTH COATING MARKET, BY REGION
6.1.Overview
6.1.1.Market size and forecast
6.2.North America
6.2.1.Key market trends, growth factors, and opportunities
6.2.2.Market size and forecast, by resin type
6.2.3.Market size and forecast, by application
6.2.4.Market share analysis, by country
6.2.4.1.U.S.
6.2.4.1.1.Market size and forecast, by resin type
6.2.4.1.2.Market size and forecast, by application
6.2.4.2.Canada
6.2.4.2.1.Market size and forecast, by resin type
6.2.4.2.2.Market size and forecast, by application
6.2.4.3.Mexico
6.2.4.3.1.Market size and forecast, by resin type
6.2.4.3.2.Market size and forecast, by application
6.3.Europe
6.3.1.Key market trends, growth factors, and opportunities
6.3.2.Market size and forecast, by resin type
6.3.3.Market size and forecast, by application
6.3.4.Market share analysis, by country
6.3.4.1.Germany
6.3.4.1.1.Market size and forecast, by resin type
6.3.4.1.2.Market size and forecast, by application
6.3.4.2.France
6.3.4.2.1.Market size and forecast, by resin type
6.3.4.2.2.Market size and forecast, by application
6.3.4.3.Italy
6.3.4.3.1.Market size and forecast, by resin type
6.3.4.3.2.Market size and forecast, by application
6.3.4.4.Spain
6.3.4.4.1.Market size and forecast, by resin type
6.3.4.4.2.Market size and forecast, by application
6.3.4.5.UK
6.3.4.5.1.Market size and forecast, by resin type
6.3.4.5.2.Market size and forecast, by application
6.3.4.6.Russia
6.3.4.6.1.Market size and forecast, by resin type
6.3.4.6.2.Market size and forecast, by application
6.3.4.7.Rest of Europe
6.3.4.7.1.Market size and forecast, by resin type
6.3.4.7.2.Market size and forecast, by application
6.4.Asia-Pacific
6.4.1.Key market trends, growth factors, and opportunities
6.4.2.Market size and forecast, by resin type
6.4.3.Market size and forecast, by application
6.4.4.Market share analysis, by country
6.4.4.1.China
6.4.4.1.1.Market size and forecast, by resin type
6.4.4.1.2.Market size and forecast, by application
6.4.4.2.Japan
6.4.4.2.1.Market size and forecast, by resin type
6.4.4.2.2.Market size and forecast, by application
6.4.4.3.South Korea
6.4.4.3.1.Market size and forecast, by resin type
6.4.4.3.2.Market size and forecast, by application
6.4.4.4.India
6.4.4.4.1.Market size and forecast, by resin type
6.4.4.4.2.Market size and forecast, by application
6.4.4.5.Australia
6.4.4.5.1.Market size and forecast, by resin type
6.4.4.5.2.Market size and forecast, by application
6.4.4.6.Rest of Asia-Pacific
6.4.4.6.1.Market size and forecast, by resin type
6.4.4.6.2.Market size and forecast, by application
6.5.LAMEA
6.5.1.Key market trends, growth factors, and opportunities
6.5.2.Market size and forecast, by resin type
6.5.3.Market size and forecast, by application
6.5.4.Market share analysis, by country
6.5.4.1.Brazil
6.5.4.1.1.Market size and forecast, by resin type
6.5.4.1.2.Market size and forecast, by application
6.5.4.2.United Arab Emirates (UAE)
6.5.4.2.1.Market size and forecast, by resin type
6.5.4.2.2.Market size and forecast, by application
6.5.4.3.Saudi Arabia
6.5.4.3.1.Market size and forecast, by resin type
6.5.4.3.2.Market size and forecast, by application
6.5.4.4.South Africa
6.5.4.4.1.Market size and forecast, by resin type
6.5.4.4.2.Market size and forecast, by application
6.5.4.5.Rest of LAMEA
6.5.4.5.1.Market size and forecast, by resin type
6.5.4.5.2.Market size and forecast, by application
CHAPTER 7:COMPETITIVE LANDSCAPE
7.1.Introduction
7.1.1.Market player positioning, 2019
7.2.Top winning strategies
7.2.1.Top winning strategies, by year
7.2.2.Top winning strategies, by development
7.2.3.Top winning strategies, by company
7.3.Product mapping of top 10 players
7.4.Competitive dashboard
7.5.Competitive heatmap
7.6.Key developments
7.6.1.New product launches
7.6.2.Expansions
7.6.3.Collaborations
7.6.4.Agreement
CHAPTER 8:COMPANY PROFILES
8.1.Intermat Defense
8.1.1.Company overview
8.1.2.Company snapshot
8.1.3.Operating business segments
8.1.4.Product portfolio
8.1.5.Business performance
8.1.6.Key strategic moves and developments
8.2.CFI Solutions
8.2.1.Company overview
8.2.2.Company snapshot
8.2.3.Operating business segments
8.2.4.Product portfolio
8.2.5.Business performance
8.2.6.Key strategic moves and developments
8.3.Hyper Stealth Technologies Pvt Ltd.
8.3.1.Company overview
8.3.2.Company snapshot
8.3.3.Operating business segments
8.3.4.Product portfolio
8.3.5.Business performance
8.3.6.Key strategic moves and developments
8.4.Stealth Coatings Inc.
8.4.1.Company overview
8.4.2.Company snapshot
8.4.3.Operating business segments
8.4.4.Product portfolio
8.4.5.Business performance
8.4.6.Key strategic moves and developments
8.5.Micromag
8.5.1.Company overview
8.5.2.Company snapshot
8.5.3.Operating business segments
8.5.4.Product portfolio
8.5.5.Business performance
8.5.6.Key strategic moves and developments
8.6.Veil Corporation
8.6.1.Company overview
8.6.2.Company snapshot
8.6.3.Operating business segments
8.6.4.Product portfolio
8.6.5.Business performance
8.6.6.Key strategic moves and developments
8.7.Stealth Veils
8.7.1.Company overview
8.7.2.Company snapshot
8.7.3.Operating business segments
8.7.4.Product portfolio
8.7.5.Business performance
LIST OF TABLES
TABLE 01.GLOBAL STEALTH COATING MARKET, BY RESIN TYPE, 2019-2027 (THOUSAND LITRES)
TABLE 02.GLOBAL STEALTH COATING MARKET, BY RESIN TYPE, 2019-2027 ($MILLION)
TABLE 03.STEALTH COATING MARKET FOR EPOXY, BY REGION, 2019–2027 (THOUSAND LITRES)
TABLE 04.STEALTH COATING MARKET FOR EPOXY, BY REGION, 2019–2027 ($MILLION)
TABLE 05.STEALTH COATING MARKET FOR POLYURETHANE, BY REGION, 2019–2027 (THOUSAND LITRES)
TABLE 06.STEALTH COATING MARKET FOR POLYURETHANE, BY REGION, 2019–2027 ($MILLION)
TABLE 07.STEALTH COATING MARKET FOR POLYIMIDE, BY REGION, 2019–2027 (THOUSAND LITRES)
TABLE 08.STEALTH COATING MARKET FOR POLYIMIDE, BY REGION, 2019–2027 ($MILLION)
TABLE 09.GLOBAL STEALTH COATING MARKET, BY APPLICATION, 2019-2027 (THOUSAND LITRES)
TABLE 10.GLOBAL STEALTH COATING MARKET, BY APPLICATION, 2019-2027 ($MILLION)
TABLE 11.STEALTH COATING MARKET FOR AEROSPACE & DEFENSE, BY REGION, 2019–2027 (THOUSAND LITRES)
TABLE 12.STEALTH COATING MARKET FOR AEROSPACE & DEFENSE, BY REGION, 2019–2027 ($MILLION)
TABLE 13.STEALTH COATING MARKET FOR AUTOMOTIVE, BY REGION, 2019–2027 (THOUSAND LITRES)
TABLE 14.STEALTH COATING MARKET FOR AUTOMOTIVE, BY REGION, 2019–2027 ($MILLION)
TABLE 15.STEALTH COATING MARKET, BY REGION, 2019-2027 (THOUSAND LITRES)
TABLE 16.STEALTH COATING MARKET, BY REGION, 2019-2027 ($MILLION)
TABLE 17.NORTH AMERICA STEALTH COATING MARKET, BY RESIN TYPE, 2019-2027 (THOUSAND LITRES)
TABLE 18.NORTH AMERICA STEALTH COATING MARKET, BY RESIN TYPE, 2019-2027 ($MILLION)
TABLE 19.NORTH AMERICA STEALTH COATING MARKET, BY APPLICATION, 2019-2027 (THOUSAND LITRES)
TABLE 20.NORTH AMERICA STEALTH COATING MARKET, BY APPLICATION, 2019-2027 ($MILLION)
TABLE 21.NORTH AMERICA STEALTH COATING MARKET, BY COUNTRY, 2019-2027 (THOUSAND LITRES)
TABLE 22.NORTH AMERICA STEALTH COATING MARKET, BY COUNTRY, 2019-2027 ($MILLION)
TABLE 23.U.S. STEALTH COATING MARKET, BY RESIN TYPE, 2019-2027 (THOUSAND LITRES)
TABLE 24.U.S. STEALTH COATING MARKET, BY RESIN TYPE, 2019-2027 ($MILLION)
TABLE 25.U.S. STEALTH COATING MARKET, BY APPLICATION, 2019-2027 (THOUSAND LITRES)
TABLE 26.U.S. STEALTH COATING MARKET, BY APPLICATION, 2019-2027 ($MILLION)
TABLE 27.CANADA STEALTH COATING MARKET, BY RESIN TYPE, 2019-2027 (THOUSAND LITRES)
TABLE 28.CANADA STEALTH COATING MARKET, BY RESIN TYPE, 2019-2027 ($MILLION)
TABLE 29.CANADA STEALTH COATING MARKET, BY APPLICATION, 2019-2027 (THOUSAND LITRES)
TABLE 30.CANADA STEALTH COATING MARKET, BY APPLICATION, 2019-2027 ($MILLION)
TABLE 31.MEXICO STEALTH COATING MARKET, BY RESIN TYPE, 2019-2027 (THOUSAND LITRES)
TABLE 32.MEXICO STEALTH COATING MARKET, BY RESIN TYPE, 2019-2027 ($MILLION)
TABLE 33.MEXICO STEALTH COATING MARKET, BY APPLICATION, 2019-2027 (THOUSAND LITRES)
TABLE 34.MEXICO STEALTH COATING MARKET, BY APPLICATION, 2019-2027 ($MILLION)
TABLE 35.EUROPE STEALTH COATING MARKET, BY RESIN TYPE, 2019-2027 (THOUSAND LITRES)
TABLE 36.EUROPE STEALTH COATING MARKET, BY RESIN TYPE, 2019-2027 ($MILLION)
TABLE 37.EUROPE STEALTH COATING MARKET, BY APPLICATION, 2019-2027 (THOUSAND LITRES)
TABLE 38.EUROPE STEALTH COATING MARKET, BY APPLICATION, 2019-2027 ($MILLION)
TABLE 39.EUROPE STEALTH COATING MARKET, BY COUNTRY, 2019-2027 (THOUSAND LITRES)
TABLE 40.EUROPE STEALTH COATING MARKET, BY COUNTRY, 2019-2027 ($MILLION)
TABLE 41.GERMANY STEALTH COATING MARKET, BY RESIN TYPE, 2019-2027 (THOUSAND LITRES)
TABLE 42.GERMANY STEALTH COATING MARKET, BY RESIN TYPE, 2019-2027 ($MILLION)
TABLE 43.GERMANY STEALTH COATING MARKET, BY APPLICATION, 2019-2027 (THOUSAND LITRES)
TABLE 44.GERMANY STEALTH COATING MARKET, BY APPLICATION, 2019-2027 ($MILLION)
TABLE 45.FRANCE STEALTH COATING MARKET, BY RESIN TYPE, 2019-2027 (THOUSAND LITRES)
TABLE 46.FRANCE STEALTH COATING MARKET, BY RESIN TYPE, 2019-2027 ($MILLION)
TABLE 47.FRANCE STEALTH COATING MARKET, BY APPLICATION, 2019-2027 (THOUSAND LITRES)
TABLE 48.FRANCE STEALTH COATING MARKET, BY APPLICATION, 2019-2027 ($MILLION)
TABLE 49.ITALY STEALTH COATING MARKET, BY RESIN TYPE, 2019-2027 (THOUSAND LITRES)
TABLE 50.ITALY STEALTH COATING MARKET, BY RESIN TYPE, 2019-2027 ($MILLION)
TABLE 51.ITALY STEALTH COATING MARKET, BY APPLICATION, 2019-2027 (THOUSAND LITRES)
TABLE 52.ITALY STEALTH COATING MARKET, BY APPLICATION, 2019-2027 ($MILLION)
TABLE 53.SPAIN STEALTH COATING MARKET, BY RESIN TYPE, 2019-2027 (THOUSAND LITRES)
TABLE 54.SPAIN STEALTH COATING MARKET, BY RESIN TYPE, 2019-2027 ($MILLION)
TABLE 55.SPAIN STEALTH COATING MARKET, BY APPLICATION, 2019-2027 (THOUSAND LITRES)
TABLE 56.SPAIN STEALTH COATING MARKET, BY APPLICATION, 2019-2027 ($MILLION)
TABLE 57.UK STEALTH COATING MARKET, BY RESIN TYPE, 2019-2027 (THOUSAND LITRES)
TABLE 58.UK STEALTH COATING MARKET, BY RESIN TYPE, 2019-2027 ($MILLION)
TABLE 59.UK STEALTH COATING MARKET, BY APPLICATION, 2019-2027 (THOUSAND LITRES)
TABLE 60.UK STEALTH COATING MARKET, BY APPLICATION, 2019-2027 ($MILLION)
TABLE 61.RUSSIA STEALTH COATING MARKET, BY RESIN TYPE, 2019-2027 (THOUSAND LITRES)
TABLE 62.RUSSIA STEALTH COATING MARKET, BY RESIN TYPE, 2019-2027 ($MILLION)
TABLE 63.RUSSIA STEALTH COATING MARKET, BY APPLICATION, 2019-2027 (THOUSAND LITRES)
TABLE 64.RUSSIA STEALTH COATING MARKET, BY APPLICATION, 2019-2027 ($MILLION)
TABLE 65.REST OF EUROPE STEALTH COATING MARKET, BY RESIN TYPE, 2019-2027 (THOUSAND LITRES)
TABLE 66.REST OF EUROPE STEALTH COATING MARKET, BY RESIN TYPE, 2019-2027 ($MILLION)
TABLE 67.REST OF EUROPE STEALTH COATING MARKET, BY APPLICATION, 2019-2027 (THOUSAND LITRES)
TABLE 68.REST OF EUROPE STEALTH COATING MARKET, BY APPLICATION, 2019-2027 ($MILLION)
TABLE 69.ASIA-PACIFIC STEALTH COATING MARKET, BY RESIN TYPE, 2019-2027 (THOUSAND LITRES)
TABLE 70.ASIA-PACIFIC STEALTH COATING MARKET, BY RESIN TYPE, 2019-2027 ($MILLION)
TABLE 71.ASIA-PACIFIC STEALTH COATING MARKET, BY APPLICATION, 2019-2027 (THOUSAND LITRES)
TABLE 72.ASIA-PACIFIC STEALTH COATING MARKET, BY APPLICATION, 2019-2027 ($MILLION)
TABLE 73.ASIA-PACIFIC STEALTH COATING MARKET, BY COUNTRY, 2019-2027 (THOUSAND LITRES)
TABLE 74.ASIA-PACIFIC STEALTH COATING MARKET, BY COUNTRY, 2019-2027 ($MILLION)
TABLE 75.CHINA STEALTH COATING MARKET, BY RESIN TYPE, 2019-2027 (THOUSAND LITRES)
TABLE 76.CHINA STEALTH COATING MARKET, BY RESIN TYPE, 2019-2027 ($MILLION)
TABLE 77.CHINA STEALTH COATING MARKET, BY APPLICATION, 2019-2027 (THOUSAND LITRES)
TABLE 78.CHINA STEALTH COATING MARKET, BY APPLICATION, 2019-2027 ($MILLION)
TABLE 79.JAPAN STEALTH COATING MARKET, BY RESIN TYPE, 2019-2027 (THOUSAND LITRES)
TABLE 80.JAPAN STEALTH COATING MARKET, BY RESIN TYPE, 2019-2027 ($MILLION)
TABLE 81.JAPAN STEALTH COATING MARKET, BY APPLICATION, 2019-2027 (THOUSAND LITRES)
TABLE 82.JAPAN STEALTH COATING MARKET, BY APPLICATION, 2019-2027 ($MILLION)
TABLE 83.SOUTH KOREA STEALTH COATING MARKET, BY RESIN TYPE, 2019-2027 (THOUSAND LITRES)
TABLE 84.SOUTH KOREA STEALTH COATING MARKET, BY RESIN TYPE, 2019-2027 ($MILLION)
TABLE 85.SOUTH KOREA STEALTH COATING MARKET, BY APPLICATION, 2019-2027 (THOUSAND LITRES)
TABLE 86.SOUTH KOREA STEALTH COATING MARKET, BY APPLICATION, 2019-2027 ($MILLION)
TABLE 87.INDIA STEALTH COATING MARKET, BY RESIN TYPE, 2019-2027 (THOUSAND LITRES)
TABLE 88.INDIA STEALTH COATING MARKET, BY RESIN TYPE, 2019-2027 ($MILLION)
TABLE 89.INDIA STEALTH COATING MARKET, BY APPLICATION, 2019-2027 (THOUSAND LITRES)
TABLE 90.INDIA STEALTH COATING MARKET, BY APPLICATION, 2019-2027 ($MILLION)
TABLE 91.AUSTRALIA STEALTH COATING MARKET, BY RESIN TYPE, 2019-2027 (THOUSAND LITRES)
TABLE 92.AUSTRALIA STEALTH COATING MARKET, BY RESIN TYPE, 2019-2027 ($MILLION)
TABLE 93.AUSTRALIA STEALTH COATING MARKET, BY APPLICATION, 2019-2027 (THOUSAND LITRES)
TABLE 94.AUSTRALIA STEALTH COATING MARKET, BY APPLICATION, 2019-2027 ($MILLION)
TABLE 95.REST OF ASIA-PACIFIC STEALTH COATING MARKET, BY RESIN TYPE, 2019-2027 (THOUSAND LITRES)
TABLE 96.REST OF ASIA-PACIFIC STEALTH COATING MARKET, BY RESIN TYPE, 2019-2027 ($MILLION)
TABLE 97.REST OF ASIA-PACIFIC STEALTH COATING MARKET, BY APPLICATION, 2019-2027 (THOUSAND LITRES)
TABLE 98.REST OF ASIA-PACIFIC STEALTH COATING MARKET, BY APPLICATION, 2019-2027 ($MILLION)
TABLE 99.LAMEA STEALTH COATING MARKET, BY RESIN TYPE, 2019-2027 (THOUSAND LITRES)
TABLE 100.LAMEA STEALTH COATING MARKET, BY RESIN TYPE, 2019-2027 ($MILLION)
TABLE 101.LAMEA STEALTH COATING MARKET, BY APPLICATION, 2019-2027 (THOUSAND LITRES)
TABLE 102.LAMEA STEALTH COATING MARKET, BY APPLICATION, 2019-2027 ($MILLION)
TABLE 103.LAMEA STEALTH COATING MARKET, BY COUNTRY, 2019-2027 (THOUSAND LITRES)
TABLE 104.LAMEA STEALTH COATING MARKET, BY COUNTRY, 2019-2027 ($MILLION)
TABLE 105.BRAZIL STEALTH COATING MARKET, BY RESIN TYPE, 2019-2027 (THOUSAND LITRES)
TABLE 106.BRAZIL STEALTH COATING MARKET, BY RESIN TYPE, 2019-2027 ($MILLION)
TABLE 107.BRAZIL STEALTH COATING MARKET, BY APPLICATION, 2019-2027 (THOUSAND LITRES)
TABLE 108.BRAZIL STEALTH COATING MARKET, BY APPLICATION, 2019-2027 ($MILLION)
TABLE 109.UNITED ARAB EMIRATES (UAE) STEALTH COATING MARKET, BY RESIN TYPE, 2019-2027 (THOUSAND LITRES)
TABLE 110.UNITED ARAB EMIRATES (UAE) STEALTH COATING MARKET, BY RESIN TYPE, 2019-2027 ($MILLION)
TABLE 111.UNITED ARAB EMIRATES (UAE) STEALTH COATING MARKET, BY APPLICATION, 2019-2027 (THOUSAND LITRES)
TABLE 112.UNITED ARAB EMIRATES (UAE) STEALTH COATING MARKET, BY APPLICATION, 2019-2027 ($MILLION)
TABLE 113.SAUDI ARABIA STEALTH COATING MARKET, BY RESIN TYPE, 2019-2027 (THOUSAND LITRES)
TABLE 114.SAUDI ARABIA STEALTH COATING MARKET, BY RESIN TYPE, 2019-2027 ($MILLION)
TABLE 115.SAUDI ARABIA STEALTH COATING MARKET, BY APPLICATION, 2019-2027 (THOUSAND LITRES)
TABLE 116.SAUDI ARABIA STEALTH COATING MARKET, BY APPLICATION, 2019-2027 ($MILLION)
TABLE 117.SOUTH AFRICA STEALTH COATING MARKET, BY RESIN TYPE, 2019-2027 (THOUSAND LITRES)
TABLE 118.SOUTH AFRICA STEALTH COATING MARKET, BY RESIN TYPE, 2019-2027 ($MILLION)
TABLE 119.SOUTH AFRICA STEALTH COATING MARKET, BY APPLICATION, 2019-2027 (THOUSAND LITRES)
TABLE 120.SOUTH AFRICA STEALTH COATING MARKET, BY APPLICATION, 2019-2027 ($MILLION)
TABLE 121.REST OF LAMEA STEALTH COATING MARKET, BY RESIN TYPE, 2019-2027 (THOUSAND LITRES)
TABLE 122.REST OF LAMEA STEALTH COATING MARKET, BY RESIN TYPE, 2019-2027 ($MILLION)
TABLE 123.REST OF LAMEA STEALTH COATING MARKET, BY APPLICATION, 2019-2027 (THOUSAND LITRES)
TABLE 124.REST OF LAMEA STEALTH COATING MARKET, BY APPLICATION, 2019-2027 ($MILLION)
TABLE 125.KEY NEW PRODUCT LAUNCHES (2016-2020)
TABLE 126.KEY EXPANSIONS (2016-2020)
TABLE 127.KEY COLLABORATION (2016-2020)
TABLE 128.KEY AGREEMENT (2016-2020)
TABLE 129.INTERMAT DEFENSE: COMPANY SNAPSHOT
TABLE 130.ASHLAND: OPERATING SEGMENTS
TABLE 131.INTERMAT DEFENSE: PRODUCT PORTFOLIO
TABLE 132.INTERMAT DEFENSE: OVERALL FINANCIAL STATUS ($MILLION)
TABLE 133.ASHLAND: KEY STRATEGIC MOVES AND DEVELOPMENTS
TABLE 134.CFI SOLUTIONS: COMPANY SNAPSHOT
TABLE 135.CFI SOLUTIONS: OPERATING SEGMENTS
TABLE 136.CFI SOLUTIONS: PRODUCT PORTFOLIO
TABLE 137.CFI SOLUTIONS: OVERALL FINANCIAL STATUS ($MILLION)
TABLE 138.CFI SOLUTIONS: KEY STRATEGIC MOVES AND DEVELOPMENTS
TABLE 139.HYPER STEALTH TECHNOLOGIES PVT LTD.: COMPANY SNAPSHOT
TABLE 140.HYPER STEALTH TECHNOLOGIES PVT LTD.: OPERATING SEGMENTS
TABLE 141.HYPER STEALTH TECHNOLOGIES PVT LTD.: PRODUCT PORTFOLIO
TABLE 142.HYPER STEALTH TECHNOLOGIES PVT LTD.: OVERALL FINANCIAL STATUS ($MILLION)
TABLE 143.HYPER STEALTH TECHNOLOGIES PVT LTD.: KEY STRATEGIC MOVES AND DEVELOPMENTS
TABLE 144.STEALTH COATINGS INC.: COMPANY SNAPSHOT
TABLE 145.STEALTH COATINGS INC.: OPERATING SEGMENTS
TABLE 146.STEALTH COATINGS INC.: PRODUCT PORTFOLIO
TABLE 147.OVERALL FINANCIAL STATUS ($MILLION)
TABLE 148.STEALTH COATINGS INC.: KEY STRATEGIC MOVES AND DEVELOPMENTS
TABLE 149.MICROMAG: COMPANY SNAPSHOT
TABLE 150.MICROMAG: OPERATING SEGMENTS
TABLE 151.MICROMAG: PRODUCT PORTFOLIO
TABLE 152.MICROMAG: OVERALL FINANCIAL STATUS ($MILLION)
TABLE 153.VEIL CORPORATION: COMPANY SNAPSHOT
TABLE 154.VEIL CORPORATION: OPERATING SEGMENTS
TABLE 155.VEIL CORPORATION: PRODUCT PORTFOLIO
TABLE 156.VEIL CORPORATION: OVERALL FINANCIAL STATUS ($MILLION)
TABLE 157.VEIL CORPORATION: KEY STRATEGIC MOVES AND DEVELOPMENTS
TABLE 158.STEALTH VEILS: COMPANY SNAPSHOT
TABLE 159.STEALTH VEILS: OPERATING SEGMENTS
TABLE 160.STEALTH VEILS: PRODUCT PORTFOLIO
TABLE 161.STEALTH VEILS: OVERALL FINANCIAL STATUS ($MILLION)
LIST OF FIGURES
FIGURE 01.EXECUTIVE SUMMARY
FIGURE 02.GLOBAL STEALTH COATING MARKET SEGMENTATION
FIGURE 03.TOP INVESTMENT POCKETS, BY COUNTRY
FIGURE 04.MODERATE BARGAINING POWER OF SUPPLIERS
FIGURE 05.HIGH BARGAINING POWER OF BUYERS
FIGURE 06.HIGH THREAT OF NEW ENTRANTS
FIGURE 07.MODERATE THREAT OF SUBSTITUTES
FIGURE 08.MODERATE INTENSITY OF COMPETITIVE RIVALRY
FIGURE 09.PRICING ANALYSIS, BY RESIN TYPE, 2019–2027
FIGURE 10.PRICING ANALYSIS, BY APPLICATION, 2019–2027
FIGURE 11.PRICING ANALYSIS, BY REGION, 2019–2027
FIGURE 12.VALUE CHAIN ANALYSIS
FIGURE 13.PATENT ANALYSIS: BY REGION (2015-2020)
FIGURE 14.GLOBAL STEALTH COATING MARKET DYNAMICS
FIGURE 01.GLOBAL STEALTH COATING MARKET, BY RESIN TYPE, 2019 VS 2027 ($MILLION)
FIGURE 02.COMPARATIVE ANALYSIS OF STEALTH COATING MARKET FOR EPOXY, BY COUNTRY, 2019 VS 2027 ($MILLION)
FIGURE 03.COMPARATIVE ANALYSIS OF STEALTH COATING MARKET FOR POLYURETHANE, BY COUNTRY, 2019 VS 2027 ($MILLION)
FIGURE 04.COMPARATIVE ANALYSIS OF STEALTH COATING MARKET FOR POLYIMIDE, BY COUNTRY, 2019 VS 2027 ($MILLION)
FIGURE 05.GLOBAL STEALTH COATING MARKET, BY APPLICATION, 2019 VS 2027 ($MILLION)
FIGURE 06.COMPARATIVE ANALYSIS OF STEALTH COATING MARKET FOR AEROSPACE & DEFENSE, BY COUNTRY, 2019 VS 2027 ($MILLION)
FIGURE 07.COMPARATIVE ANALYSIS OF STEALTH COATING MARKET FOR AUTOMOTIVE, BY COUNTRY, 2019 VS 2027 ($MILLION)
FIGURE 08.GLOBAL STEALTH COATING MARKET, BY REGION, 2019 VS 2027 ($MILLION)
FIGURE 09.U.S. STEALTH COATING MARKET REVENUE, 2019–2027 ($MILLION)
FIGURE 10.CANADA STEALTH COATING MARKET REVENUE, 2019–2027 ($MILLION)
FIGURE 11.MEXICO STEALTH COATING MARKET REVENUE, 2019–2027 ($MILLION)
FIGURE 12.GERMANY STEALTH COATING MARKET REVENUE, 2019–2027 ($MILLION)
FIGURE 13.FRANCE STEALTH COATING MARKET REVENUE, 2019–2027 ($MILLION)
FIGURE 14.ITALY STEALTH COATING MARKET REVENUE, 2019–2027 ($MILLION)
FIGURE 15.SPAIN STEALTH COATING MARKET REVENUE, 2019–2027 ($MILLION)
FIGURE 16.UK STEALTH COATING MARKET REVENUE, 2019–2027 ($MILLION)
FIGURE 17.RUSSIA STEALTH COATING MARKET REVENUE, 2019–2027 ($MILLION)
FIGURE 18.REST OF EUROPE STEALTH COATING MARKET REVENUE, 2019–2027 ($MILLION)
FIGURE 19.CHINA STEALTH COATING MARKET REVENUE, 2019–2027 ($MILLION)
FIGURE 20.JAPAN STEALTH COATING MARKET REVENUE, 2019–2027 ($MILLION)
FIGURE 21.SOUTH KOREA STEALTH COATING MARKET REVENUE, 2019–2027 ($MILLION)
FIGURE 22.INDIA STEALTH COATING MARKET REVENUE, 2019–2027 ($MILLION)
FIGURE 23.AUSTRALIA STEALTH COATING MARKET REVENUE, 2019–2027 ($MILLION)
FIGURE 24.REST OF ASIA-PACIFIC STEALTH COATING MARKET REVENUE, 2019–2027 ($MILLION)
FIGURE 25.BRAZIL STEALTH COATING MARKET REVENUE, 2019–2027 ($MILLION)
FIGURE 26.UNITED ARAB EMIRATES (UAE) STEALTH COATING MARKET REVENUE, 2019–2027 ($MILLION)
FIGURE 27.SAUDI ARABIA STEALTH COATING MARKET REVENUE, 2019–2027 ($MILLION)
FIGURE 28.SOUTH AFRICA STEALTH COATING MARKET REVENUE, 2019–2027 ($MILLION)
FIGURE 29.REST OF LAMEA STEALTH COATING MARKET REVENUE, 2019–2027 ($MILLION)
FIGURE 30.MARKET PLAYER POSITIONING, 2019
FIGURE 31.TOP WINNING STRATEGIES, BY YEAR, 2016–2020
FIGURE 32.TOP WINNING STRATEGIES, BY DEVELOPMENT, 2016–2020 (%)
FIGURE 33.TOP WINNING STRATEGIES, BY COMPANY, 2016–2020
FIGURE 34.PRODUCT MAPPING OF TOP 10 PLAYERS
FIGURE 35.COMPETITIVE DASHBOARD
FIGURE 36.COMPETITIVE HEATMAP OF KEY PLAYERS
FIGURE 37.INTERMAT DEFENSE: NET SALES, 2017–2019 ($MILLION)
FIGURE 38.INTERMAT DEFENSE: REVENUE SHARE BY SEGMENT, 2019 (%)
FIGURE 39.INTERMAT DEFENSE: REVENUE SHARE BY REGION, 2019 (%)
FIGURE 40.CFI SOLUTIONS: REVENUE, 2017–2019 ($MILLION)
FIGURE 41.CFI SOLUTIONS: REVENUE SHARE BY SEGMENT, 2019 (%)
FIGURE 42.CFI SOLUTIONS: REVENUE SHARE BY REGION, 2019 (%)
FIGURE 43.HYPER STEALTH TECHNOLOGIES PVT LTD.: REVENUE, 2017–2019 ($MILLION)
FIGURE 44.HYPER STEALTH TECHNOLOGIES PVT LTD.: REVENUE SHARE BY SEGMENT, 2019 (%)
FIGURE 45.HYPER STEALTH TECHNOLOGIES PVT LTD.: REVENUE SHARE BY REGION, 2019 (%)
FIGURE 46.STEALTH COATINGS INC.: REVENUE, 2017–2019 ($MILLION)
FIGURE 47.STEALTH COATINGS INC.: REVENUE SHARE BY SEGMENT, 2019 (%)
FIGURE 48.STEALTH COATINGS INC.: REVENUE SHARE BY REGION, 2019 (%)
FIGURE 49.MICROMAG: NET SALES, 2017–2019 ($MILLION)
FIGURE 50.MICROMAG: REVENUE SHARE BY SEGMENT, 2019 (%)
FIGURE 51.MICROMAG: REVENUE SHARE BY REGION, 2019 (%)
FIGURE 52.VEIL CORPORATION: REVENUE, 2017–2019 ($MILLION)
FIGURE 53.VEIL CORPORATION: REVENUE SHARE BY SEGMENT, 2019 (%)
FIGURE 54.VEIL CORPORATION: REVENUE SHARE BY REGION, 2019 (%)
FIGURE 55.STEALTH VEILS: REVENUE, 2017–2019 ($MILLION)
FIGURE 56.STEALTH VEILS: REVENUE SHARE BY SEGMENT, 2019 (%)
FIGURE 57.STEALTH VEILS: REVENUE SHARE BY REGION, 2019 (%)