Int'l : +1-503-894-6022 | Toll Free : +1-800-792-5285 | help@alliedmarketresearch.com
A10613 | Pages: 290 | Charts: 69 | Tables: 141 |
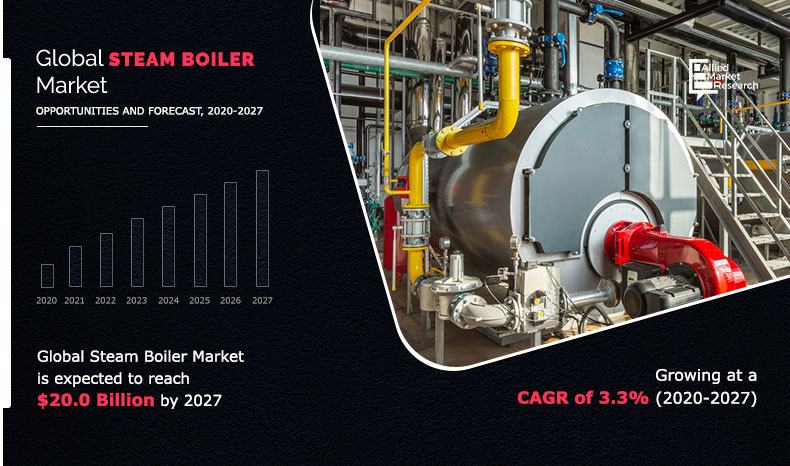
The global steam boiler market size was valued at $15.6 billion in 2019, and is expected to reach $20.0 billion by 2027, registering a CAGR of 3.3% from 2020 to 2027. Steam boiler is a type of closed vessel designed and constructed with steel to generate steam by heating water with the help of combustion of various fuels, including oil, coal, gas, and others. It offers various advantages, including low construction cost, less floor area, portable, easy installation, and others. Steam boilers are used in various applications, including generation of power, process industries, heating application in residential & commercial buildings, and others.
Rise in demand for electricity across the globe is expected to increase the demand for steam boilers from the power generation industry, which is anticipated to drive the growth of the market during the forecast period. In addition, rise in oil & gas offshore and onshore exploration activities is further expected to increase the demand for steam boilers in the future. However, high initial cost associated with steam boiler is the key factor expected to hinder the growth of the market during the analyzed timeframe. On the contrary, rapid growth of end-use industries, such as chemical, food processing, pulp & paper, pharmaceutical, and others, by developing and expanding their production bases or expansion of manufacturing facilities is expected to create opportunity for key players in the market in the coming years.
Get more information on this report : Request Sample Pages
The global steam boiler market is segmented into type, fuel type, pressure, end-use industry, and region. Depending on type, the market is bifurcated into water tube boiler and fire tube boiler. On the basis of fuel type, it is categorized into coal fired, oil fired, gas fired, and others. By pressure, it is classified into low pressure and high pressure. Based on end-use industry, it is fragmented into power generation, oil & gas, chemical, and others. Region-wise, it is analyzed across North America, Europe, Asia-Pacific, and LAMEA.
The global steam boiler market covers in-depth information of the major industry participants. Some of the major players in the market include General Electric, Babcock & Wilcox Enterprises, Inc., IHI Corporation, Forbes Marshall, Mitsubishi Heavy Industries, Ltd., Viessmann Limited, Alfa Laval AB, Thyssenkrup, Hurst Boiler & Welding, Inc. and Thermax Limited.
Other players in the value chain of the steam boiler industry include Fulton Boiler, Clayton Industries, Cleaver-Brooks, Inc., Cochran Ltd., Dongfeng Electric, and Walchandnagar Industries Limited.
By type, the water tube boiler segment held the largest market share in 2019, owing to rise in demand for high operational efficiency and high temperature steam from the power generation industry. In addition, it offers various advantages over fire tube boilers, including high steam generation rate, easy transportation, high efficiency, ability to work on varying loads, and others. These factors are expected to drive the growth of the market during the analyzed time frame.
[TYPEGRAPH]
Get more information on this report : Request Sample Pages
On the basis of fuel type, the gas fired segment is projected to grow at the highest CAGR of 3.6% during the forecast period, owing to rise in awareness and stringent government regulations toward low emission fuels. In addition, gas steam boiler possesses advantages such as faster steam production, less greenhouse gas emissions, better operational performance, high efficiency, and others.
[FUELTYPEGRAPH]
Get more information on this report : Request Sample Pages
By pressure, the high pressure segment garnered the highest market share in 2019. This is attributed to increase in demand for high pressure steam boilers from various industries, including food & processing, pulp & paper, chemical, pharmaceutical, manufacturing, and others.
[PRESSUREGRAPH]
Get more information on this report : Request Sample Pages
By end-use industry, in 2019, the power generation segment held the largest market share, owing to increase in demand for electricity across the globe. In addition, rise in demand for continuous and stable electricity from various manufacturing and processing industries is expected to increase the demand for steam boilers during the forecast period.
[ENDUSEINDUSTRYGRAPH]
Get more information on this report : Request Sample Pages
Asia-Pacific garnered the highest growth rate in the global steam boiler market in 2019, in terms of revenue, and is anticipated to maintain its dominance over the forecast period. This is attributed to the presence of key players and huge consumer base in the region. In addition, steam boiler is gaining importance in power generation, chemical, pharmaceutical, paper & pulp, and food processing, owing to its reliability and superior efficiency. This is expected to augment the growth of the steam boiler market during the forecast period.
[REGIONGRAPH]
Get more information on this report : Request Sample Pages
Lockdowns imposed due to the outbreak of COVID-19 pandemic resulted in temporary ban on import & export and manufacturing & processing activities across various industries, which decreased the demand for electricity from consumers. This resulted in decline in market growth in the second, third, and fourth quarters of 2020. However, the steam boiler market is expected to recover by the first quarter of 2021 as the demand for electricity from industries and individual customers (residential and commercial) increases.
Key Market Segments
Key Market Players
CHAPTER 1:INTRODUCTION
1.1.Report description
1.2.Key benefits for stakeholders
1.3.Key market segments
1.4.Research methodology
1.4.1.Primary research
1.4.2.Secondary research
1.4.3.Analyst tools and models
CHAPTER 2:EXECUTIVE SUMMARY
2.1.Key findings
2.2.CXO perspective
CHAPTER 3:MARKET OVERVIEW
3.1.Market definition and scope
3.2.Key forces shaping the market
3.3.Value chain analysis
3.4.Top investment pockets
3.5.Patent analysis
3.5.1.By region, 2013–2019
3.6.Market dynamics
3.6.1.Drivers
3.6.1.1.Rise in demand for steam boilers from various end-use industries
3.6.1.2.Increase in investment towards adding power generation capacity
3.6.2.Restraints
3.6.2.1.Implementation of stringent government regulations toward environmental pollution and high initial cost
3.6.2.2.Rapid development in the renewable energy sector
3.6.3.Opportunity
3.6.3.1.Technological advancements and upgradation of aging power generation infrastructure
3.7.Impact of COVID-19 outbreak on the market
CHAPTER 4:STEAM BOILER MARKET, BY TYPE
4.1.Overview
4.1.1.Market size and forecast
4.2.Water Tube Boiler
4.2.1.Key market trends, growth factors, and opportunities
4.2.2.Market size and forecast, by region
4.2.3.Market share analysis, by country
4.3.Fire tube boiler
4.3.1.Key market trends, growth factors, and opportunities
4.3.2.Market size and forecast, by region
4.3.3.Market share analysis, by country
CHAPTER 5:STEAM BOILER MARKET, BY PRESSURE
5.1.Overview
5.1.1.Market size and forecast
5.2.Low-Pressure
5.2.1.Key market trends, growth factors, and opportunities
5.2.2.Market size and forecast, by region
5.2.3.Market share analysis, by country
5.3.High-pressure
5.3.1.Key market trends, growth factors, and opportunities
5.3.2.Market size and forecast, by region
5.3.3.Market share analysis, by country
CHAPTER 6:STEAM BOILER MARKET, BY FUEL TYPE
6.1.Overview
6.1.1.Market size and forecast
6.2.Coal fired
6.2.1.Key market trends, growth factors, and opportunities
6.2.2.Market size and forecast, by region
6.2.3.Market share analysis, by country
6.3.Oil-fired
6.3.1.Key market trends, growth factors, and opportunities
6.3.2.Market size and forecast, by region
6.3.3.Market share analysis, by country
6.4.Gas fired
6.4.1.Key market trends, growth factors, and opportunities
6.4.2.Market size and forecast, by region
6.4.3.Market share analysis, by country
6.5.Others
6.5.1.Key market trends, growth factors, and opportunities
6.5.2.Market size and forecast, by region
6.5.3.Market share analysis, by country
CHAPTER 7:STEAM BOILER MARKET, BY END-USE INDUSTRY
7.1.Overview
7.1.1.Market size and forecast
7.2.Power Generation
7.2.1.Key market trends, growth factors, and opportunities
7.2.2.Market size and forecast, by region
7.2.3.Market share analysis, by country
7.3.Oil & gas
7.3.1.Key market trends, growth factors, and opportunities
7.3.2.Market size and forecast, by region
7.3.3.Market share analysis, by country
7.4.Chemical
7.4.1.Key market trends, growth factors, and opportunities
7.4.2.Market size and forecast, by region
7.4.3.Market share analysis, by country
7.5.Others
7.5.1.Key market trends, growth factors, and opportunities
7.5.2.Market size and forecast, by region
7.5.3.Market share analysis, by country
CHAPTER 8:STEAM BOILER MARKET, BY REGION
8.1.Overview
8.1.1.Market size and forecast
8.2.North America
8.2.1.Key market trends, growth factors, and opportunities
8.2.2.Market size and forecast, by type
8.2.3.Market size and forecast, by pressure
8.2.4.Market size and forecast, by fuel type
8.2.5.Market size and forecast, by end-use industry
8.2.6.Market share analysis, by country
8.2.7.U.S.
8.2.7.1.Market size and forecast, by type
8.2.7.2.Market size and forecast, by pressure
8.2.7.3.Market size and forecast, by fuel type
8.2.7.4.Market size and forecast, by end-use industry
8.2.8.Canada
8.2.8.1.Market size and forecast, by type
8.2.8.2.Market size and forecast, by pressure
8.2.8.3.Market size and forecast, by fuel type
8.2.8.4.Market size and forecast, by end-use industry
8.2.9.Mexico
8.2.9.1.Market size and forecast, by type
8.2.9.2.Market size and forecast, by pressure
8.2.9.3.Market size and forecast, by fuel type
8.2.9.4.Market size and forecast, by end-use industry
8.3.Europe
8.3.1.Key market trends, growth factors, and opportunities
8.3.2.Market size and forecast, by type
8.3.3.Market size and forecast, by pressure
8.3.4.Market size and forecast, by fuel type
8.3.5.Market size and forecast, by end-use industry
8.3.6.Market share analysis, by country
8.3.7.Germany
8.3.7.1.Market size and forecast, by type
8.3.7.2.Market size and forecast, by pressure
8.3.7.3.Market size and forecast, by fuel type
8.3.7.4.Market size and forecast, by end-use industry
8.3.8.France
8.3.8.1.Market size and forecast, by type
8.3.8.2.Market size and forecast, by pressure
8.3.8.3.Market size and forecast, by fuel type
8.3.8.4.Market size and forecast, by end-use industry
8.3.9.Italy
8.3.9.1.Market size and forecast, by type
8.3.9.2.Market size and forecast, by pressure
8.3.9.3.Market size and forecast, by fuel type
8.3.9.4.Market size and forecast, by end-use industry
8.3.10.UK
8.3.10.1.Market size and forecast, by type
8.3.10.2.Market size and forecast, by pressure
8.3.10.3.Market size and forecast, by fuel type
8.3.10.4.Market size and forecast, by end-use industry
8.3.11.Rest Of Europe
8.3.11.1.Market size and forecast, by type
8.3.11.2.Market size and forecast, by pressure
8.3.11.3.Market size and forecast, by fuel type
8.3.11.4.Market size and forecast, by end-use industry
8.4.Asia-Pacific
8.4.1.Key market trends, growth factors, and opportunities
8.4.2.Market size and forecast, by type
8.4.3.Market size and forecast, by pressure
8.4.4.Market size and forecast, by fuel type
8.4.5.Market size and forecast, by end-use industry
8.4.6.Market share analysis, by country
8.4.7.China
8.4.7.1.Market size and forecast, by type
8.4.7.2.Market size and forecast, by pressure
8.4.7.3.Market size and forecast, by fuel type
8.4.7.4.Market size and forecast, by end-use industry
8.4.8.Japan
8.4.8.1.Market size and forecast, by type
8.4.8.2.Market size and forecast, by pressure
8.4.8.3.Market size and forecast, by fuel type
8.4.8.4.Market size and forecast, by end-use industry
8.4.9.India
8.4.9.1.Market size and forecast, by type
8.4.9.2.Market size and forecast, by pressure
8.4.9.3.Market size and forecast, by fuel type
8.4.9.4.Market size and forecast, by end-use industry
8.4.10.Rest of Asia-Pacific
8.4.10.1.Market size and forecast, by type
8.4.10.2.Market size and forecast, by pressure
8.4.10.3.Market size and forecast, by fuel type
8.4.10.4.Market size and forecast, by end-use industry
8.5.LAMEA
8.5.1.Key market trends, growth factors, and opportunities
8.5.2.Market size and forecast, by type
8.5.3.Market size and forecast, by pressure
8.5.4.Market size and forecast, by fuel type
8.5.5.Market size and forecast, by end-use industry
8.5.6.Market share analysis, by country
8.5.7.Brazil
8.5.7.1.Market size and forecast, by type
8.5.7.2.Market size and forecast, by pressure
8.5.7.3.Market size and forecast, by fuel type
8.5.7.4.Market size and forecast, by end-use industry
8.5.8.Saudi Arabia
8.5.8.1.Market size and forecast, by type
8.5.8.2.Market size and forecast, by pressure
8.5.8.3.Market size and forecast, by fuel type
8.5.8.4.Market size and forecast, by end-use industry
8.5.9.South Africa
8.5.9.1.Market size and forecast, by type
8.5.9.2.Market size and forecast, by pressure
8.5.9.3.Market size and forecast, by fuel type
8.5.9.4.Market size and forecast, by end-use industry
8.5.10.Rest of LAMEA
8.5.10.1.Market size and forecast, by type
8.5.10.2.Market size and forecast, by pressure
8.5.10.3.Market size and forecast, by fuel type
8.5.10.4.Market size and forecast, by end-use industry
CHAPTER 9:COMPETITIVE LANDSCAPE
9.1.Introduction
9.1.1.Market Player Positioning, 2019
9.2.Top winning strategies
9.2.1.Top winning strategies, by year
9.2.2.Top winning strategies, by development
9.2.3.Top winning strategies, by company
9.3.Product Mapping of Top 10 Player
9.4.Competitive Heatmap
9.5.Key developments
9.5.1.Acquisition
9.5.2.Agreement
CHAPTER 10:COMPANY PROFILES
10.1.ALFA LAVAL AB
10.1.1.Company overview
10.1.2.Company Snapshot
10.1.3.Operating business segments
10.1.4.Product portfolio
10.1.5.Business performance
10.2.Babcock & Wilcox Enterprises, Inc.
10.2.1.Company overview
10.2.2.Company snapshot
10.2.3.Operating business segments
10.2.4.Product portfolio
10.2.5.Business performance
10.2.6.Key strategic moves and developments
10.3.Forbes Marshall
10.3.1.Company overview
10.3.2.Company snapshot
10.3.3.Product portfolio
10.4.GENERAL ELECTRIC
10.4.1.Company overview
10.4.2.Company snapshot
10.4.3.Operating business segments
10.4.4.Product portfolio
10.4.5.Business performance
10.5.Hurst Boiler & Welding Co, Inc.
10.5.1.Company overview
10.5.2.Company snapshot
10.5.3.Product portfolio
10.6.IHI Corporation
10.6.1.Company overview
10.6.2.Company snapshot
10.6.3.Operating business segments
10.6.4.Product portfolio
10.6.5.Business performance
10.7.MITSUBISHI HEAVY INDUSTRIES, LTD.
10.7.1.Company overview
10.7.2.Company snapshot
10.7.3.Operating business segments
10.7.4.Product portfolio
10.7.5.Business performance
10.8.THERMAX LIMITED
10.8.1.Company overview
10.8.2.Company snapshot
10.8.3.Operating business segments
10.8.4.Product portfolio
10.8.5.Business performance
10.8.6.Key strategic moves and developments
10.9.Thyssenkrupp AG
10.9.1.Company overview
10.9.2.Company Snapshot
10.9.3.Operating business segments
10.9.4.Product portfolio
10.9.5.Business performance
10.9.6.Key strategic moves and developments
10.10.Viessmann Limited
10.10.1.Company overview
10.10.2.Company snapshot
10.10.3.Product portfolio
LIST OF TABLES
TABLE 01.GLOBAL STEAM BOILER MARKET, BY TYPE, 2019–2027 ($MILLION)
TABLE 02.WATER TUBE BOILER MARKET, BY REGION, 2019–2027 ($MILLION)
TABLE 03.FIRE TUBE BOILER MARKET, BY REGION, 2019–2027 ($MILLION)
TABLE 04.GLOBAL STEAM BOILER MARKET, BY PRESSURE, 2019–2027 ($MILLION)
TABLE 05.LOW-PRESSURE STEAM BOILER MARKET, BY REGION, 2019–2027 ($MILLION)
TABLE 06.HIGH-PRESSURE STEAM BOILER MARKET, BY REGION, 2019–2027 ($MILLION)
TABLE 07.GLOBAL STEAM BOILER MARKET, BY FUEL TYPE, 2019–2027 ($MILLION)
TABLE 08.COAL FIRED STEAM BOILER MARKET, BY REGION, 2019–2027 ($MILLION)
TABLE 09.OIL-FIRED STEAM BOILER MARKET, BY REGION, 2019–2027 ($MILLION)
TABLE 10.GAS FIRED STEAM BOILER MARKET, BY REGION, 2019–2027 ($MILLION)
TABLE 11.STEAM BOILER MARKET FOR OTHERS, BY REGION, 2019–2027 ($MILLION)
TABLE 12.GLOBAL STEAM BOILER MARKET, BY END-USE INDUSTRY, 2019–2027 ($MILLION)
TABLE 13.STEAM BOILER MARKET FOR POWER GENERATION SECTOR, BY REGION, 2019–2027 ($MILLION)
TABLE 14.STEAM BOILER MARKET FOR OIL & GAS SECTOR, BY REGION, 2019–2027 ($MILLION)
TABLE 15.STEAM BOILER MARKET FOR CHEMICAL SECTOR, BY REGION, 2019–2027 ($MILLION)
TABLE 16.STEAM BOILER MARKET FOR OTHERS, BY REGION, 2019–2027 ($MILLION)
TABLE 17.STEAM BOILER MARKET, BY REGION, 2019-2027 ($MILLION)
TABLE 18.NORTH AMERICA STEAM BOILER MARKET, BY TYPE, 2019–2027 ($MILLION)
TABLE 19.NORTH AMERICA STEAM BOILER MARKET, BY PRESSURE, 2019–2027 ($MILLION)
TABLE 20.NORTH AMERICA STEAM BOILER MARKET, BY FUEL TYPE, 2019–2027 ($MILLION)
TABLE 21.NORTH AMERICA STEAM BOILER MARKET, BY END-USE INDUSTRY, 2019–2027 ($MILLION)
TABLE 22.NORTH AMERICA STEAM BOILER MARKET, BY COUNTRY, 2019–2027 ($MILLION)
TABLE 23.THE U.S. STEAM BOILER MARKET, BY TYPE, 2019–2027 ($MILLION)
TABLE 24.THE U.S. STEAM BOILER MARKET, BY PRESSURE, 2019–2027 ($MILLION)
TABLE 25.THE U.S. STEAM BOILER MARKET, BY FUEL TYPE, 2019–2027 ($MILLION)
TABLE 26.THE U.S. STEAM BOILER MARKET, BY END-USE INDUSTRY, 2019–2027 ($MILLION)
TABLE 27.CANADA STEAM BOILER MARKET, BY TYPE, 2019–2027 ($MILLION)
TABLE 28.CANADA STEAM BOILER MARKET, BY PRESSURE, 2019–2027 ($MILLION)
TABLE 29.CANADA STEAM BOILER MARKET, BY FUEL TYPE, 2019–2027 ($MILLION)
TABLE 30.CANADA STEAM BOILER MARKET, BY END-USE INDUSTRY, 2019–2027 ($MILLION)
TABLE 31.MEXICO STEAM BOILER MARKET, BY TYPE, 2019–2027 ($MILLION)
TABLE 32.MEXICO STEAM BOILER MARKET, BY PRESSURE, 2019–2027 ($MILLION)
TABLE 33.MEXICO STEAM BOILER MARKET, BY FUEL TYPE, 2019–2027 ($MILLION)
TABLE 34.MEXICO STEAM BOILER MARKET, BY END-USE INDUSTRY, 2019–2027 ($MILLION)
TABLE 35.EUROPE STEAM BOILER MARKET, BY TYPE, 2019–2027 ($MILLION)
TABLE 36.EUROPE STEAM BOILER MARKET, BY PRESSURE, 2019–2027 ($MILLION)
TABLE 37.EUROPE STEAM BOILER MARKET, BY FUEL TYPE, 2019–2027 ($MILLION)
TABLE 38.EUROPE STEAM BOILER MARKET, BY END-USE INDUSTRY, 2019–2027 ($MILLION)
TABLE 39.EUROPE STEAM BOILER MARKET, BY COUNTRY, 2019–2027 ($MILLION)
TABLE 40.GERMANY STEAM BOILER MARKET, BY TYPE, 2019–2027 ($MILLION)
TABLE 41.GERMANY STEAM BOILER MARKET, BY PRESSURE, 2019–2027 ($MILLION)
TABLE 42.GERMANY STEAM BOILER MARKET, BY FUEL TYPE, 2019–2027 ($MILLION)
TABLE 43.GERMANY STEAM BOILER MARKET, BY END-USE INDUSTRY, 2019–2027 ($MILLION)
TABLE 44.FRANCE STEAM BOILER MARKET, BY TYPE, 2019–2027 ($MILLION)
TABLE 45.FRANCE STEAM BOILER MARKET, BY PRESSURE, 2019–2027 ($MILLION)
TABLE 46.FRANCE STEAM BOILER MARKET, BY FUEL TYPE, 2019–2027 ($MILLION)
TABLE 47.FRANCE STEAM BOILER MARKET, BY END-USE INDUSTRY, 2019–2027 ($MILLION)
TABLE 48.ITALY STEAM BOILER MARKET, BY TYPE, 2019–2027 ($MILLION)
TABLE 49.ITALY STEAM BOILER MARKET, BY PRESSURE, 2019–2027 ($MILLION)
TABLE 50.ITALY STEAM BOILER MARKET, BY FUEL TYPE, 2019–2027 ($MILLION)
TABLE 51.ITALY STEAM BOILER MARKET, BY END-USE INDUSTRY, 2019–2027 ($MILLION)
TABLE 52.UK STEAM BOILER MARKET, BY TYPE, 2019–2027 ($MILLION)
TABLE 53.UK STEAM BOILER MARKET, BY PRESSURE, 2019–2027 ($MILLION)
TABLE 54.UK STEAM BOILER MARKET, BY FUEL TYPE, 2019–2027 ($MILLION)
TABLE 55.UK STEAM BOILER MARKET, BY END-USE INDUSTRY, 2019–2027 ($MILLION)
TABLE 56.REST OF THE EUROPE STEAM BOILER MARKET, BY TYPE, 2019–2027 ($MILLION)
TABLE 57.REST OF THE EUROPE STEAM BOILER MARKET, BY PRESSURE, 2019–2027 ($MILLION)
TABLE 58.REST OF THE EUROPE STEAM BOILER MARKET, BY FUEL TYPE, 2019–2027 ($MILLION)
TABLE 59.REST OF THE EUROPE STEAM BOILER MARKET, BY END-USE INDUSTRY, 2019–2027 ($MILLION)
TABLE 60.ASIA-PACIFIC STEAM BOILER MARKET, BY TYPE, 2019–2027 ($MILLION)
TABLE 61.ASIA-PACIFIC STEAM BOILER MARKET, BY PRESSURE, 2019–2027 ($MILLION)
TABLE 62.ASIA-PACIFIC STEAM BOILER MARKET, BY FUEL TYPE, 2019–2027 ($MILLION)
TABLE 63.ASIA-PACIFIC STEAM BOILER MARKET, BY END-USE INDUSTRY, 2019–2027 ($MILLION)
TABLE 64.ASIA-PACIFIC STEAM BOILER MARKET, BY COUNTRY, 2019–2027 ($MILLION)
TABLE 65.CHINA STEAM BOILER MARKET, BY TYPE, 2019–2027 ($MILLION)
TABLE 66.CHINA STEAM BOILER MARKET, BY PRESSURE, 2019–2027 ($MILLION)
TABLE 67.CHINA STEAM BOILER MARKET, BY FUEL TYPE, 2019–2027 ($MILLION)
TABLE 68.CHINA STEAM BOILER MARKET, BY END-USE INDUSTRY, 2019–2027 ($MILLION)
TABLE 69.JAPAN STEAM BOILER MARKET, BY TYPE, 2019–2027 ($MILLION)
TABLE 70.JAPAN STEAM BOILER MARKET, BY PRESSURE, 2019–2027 ($MILLION)
TABLE 71.JAPAN STEAM BOILER MARKET, BY FUEL TYPE, 2019–2027 ($MILLION)
TABLE 72.JAPAN STEAM BOILER MARKET, BY END-USE INDUSTRY, 2019–2027 ($MILLION)
TABLE 73.INDIA STEAM BOILER MARKET, BY TYPE, 2019–2027 ($MILLION)
TABLE 74.INDIA STEAM BOILER MARKET, BY PRESSURE, 2019–2027 ($MILLION)
TABLE 75.INDIA STEAM BOILER MARKET, BY FUEL TYPE, 2019–2027 ($MILLION)
TABLE 76.INDIA STEAM BOILER MARKET, BY END-USE INDUSTRY, 2019–2027 ($MILLION)
TABLE 77.REST OF ASIA-PACIFIC STEAM BOILER MARKET, BY TYPE, 2019–2027 ($MILLION)
TABLE 78.REST OF ASIA-PACIFIC STEAM BOILER MARKET, BY PRESSURE, 2019–2027 ($MILLION)
TABLE 79.REST OF ASIA-PACIFIC STEAM BOILER MARKET, BY FUEL TYPE, 2019–2027 ($MILLION)
TABLE 80.REST OF ASIA-PACIFIC STEAM BOILER MARKET, BY END-USE INDUSTRY, 2019–2027 ($MILLION)
TABLE 81.LAMEA STEAM BOILER MARKET, BY TYPE, 2019–2027 ($MILLION)
TABLE 82.LAMEA STEAM BOILER MARKET, BY PRESSURE, 2019–2027 ($MILLION)
TABLE 83.LAMEA STEAM BOILER MARKET, BY FUEL TYPE, 2019–2027 ($MILLION)
TABLE 84.LAMEA STEAM BOILER MARKET, BY END-USE INDUSTRY, 2019–2027 ($MILLION)
TABLE 85.LAMEA STEAM BOILER MARKET, BY COUNTRY, 2019–2027 ($MILLION)
TABLE 86.BRAZIL STEAM BOILER MARKET, BY TYPE, 2019–2027 ($MILLION)
TABLE 87.BRAZIL STEAM BOILER MARKET, BY PRESSURE, 2019–2027 ($MILLION)
TABLE 88.BRAZIL STEAM BOILER MARKET, BY FUEL TYPE, 2019–2027 ($MILLION)
TABLE 89.BRAZIL STEAM BOILER MARKET, BY END-USE INDUSTRY, 2019–2027 ($MILLION)
TABLE 90.SAUDI ARABIA STEAM BOILER MARKET, BY TYPE, 2019–2027 ($MILLION)
TABLE 91.SAUDI ARABIA STEAM BOILER MARKET, BY PRESSURE, 2019–2027 ($MILLION)
TABLE 92.SAUDI ARABIA STEAM BOILER MARKET, BY FUEL TYPE, 2019–2027 ($MILLION)
TABLE 93.SAUDI ARABIA STEAM BOILER MARKET, BY END-USE INDUSTRY, 2019–2027 ($MILLION)
TABLE 94.SOUTH AFRICA STEAM BOILER MARKET, BY TYPE, 2019–2027 ($MILLION)
TABLE 95.SOUTH AFRICA STEAM BOILER MARKET, BY PRESSURE, 2019–2027 ($MILLION)
TABLE 96.SOUTH AFRICA STEAM BOILER MARKET, BY FUEL TYPE, 2019–2027 ($MILLION)
TABLE 97.SOUTH AFRICA STEAM BOILER MARKET, BY END-USE INDUSTRY, 2019–2027 ($MILLION)
TABLE 98.REST OF THE LAMEA STEAM BOILER MARKET, BY TYPE, 2019–2027 ($MILLION)
TABLE 99.REST OF THE LAMEA STEAM BOILER MARKET, BY PRESSURE, 2019–2027 ($MILLION)
TABLE 100.REST OF THE LAMEA STEAM BOILER MARKET, BY FUEL TYPE, 2019–2027 ($MILLION)
TABLE 101.REST OF THE LAMEA STEAM BOILER MARKET, BY END-USE INDUSTRY, 2019–2027 ($MILLION)
TABLE 102.KEY NEW PRODUCT LAUNCHES (2016-2020)
TABLE 103.KEY AGREEMENT (2016-2020)
TABLE 104.KEY JOINT VENTURE (2016-2020)
TABLE 105.ALFA LAVAL AB: COMPANY SNAPSHOT
TABLE 106.ALFA LAVAL AB: OPERATING SEGMENTS
TABLE 107.ALFA LAVAL AB: PRODUCT PORTFOLIO
TABLE 108.OVERALL FINANCIAL STATUS ($MILLION)
TABLE 109.BABCOCK & WILCOX: COMPANY SNAPSHOT
TABLE 110.BABCOCK & WILCOX: OPERATING SEGMENTS
TABLE 111.BABCOCK & WILCOX: PRODUCT PORTFOLIO
TABLE 112.OVERALL FINANCIAL STATUS ($MILLION)
TABLE 113.BABCOCK & WILCOX: KEY STRATEGIC MOVES AND DEVELOPMENTS
TABLE 114.FORBES MARSHALL: COMPANY SNAPSHOT
TABLE 115.FORBES MARSHALL: PRODUCT PORTFOLIO
TABLE 116.GENERAL ELECTRIC: COMPANY SNAPSHOT
TABLE 117.GENERAL ELECTRIC: OPERATING SEGMENTS
TABLE 118.GENERAL ELECTRIC
TABLE 119.OVERALL FINANCIAL STATUS ($MILLION)
TABLE 120.HURST BOILER: COMPANY SNAPSHOT
TABLE 121.HURST BOILER: PRODUCT PORTFOLIO
TABLE 122.IHI CORPORATION: COMPANY SNAPSHOT
TABLE 123.IHI CORPORATION: OPERATING SEGMENTS
TABLE 124.IHI CORPORATION: PRODUCT PORTFOLIO
TABLE 125.OVERALL FINANCIAL STATUS ($MILLION)
TABLE 126.MITSUBISHI: COMPANY SNAPSHOT
TABLE 127.MITSUBISHI: OPERATING SEGMENTS
TABLE 128.MITSUBISHI: PRODUCT PORTFOLIO
TABLE 129.OVERALL FINANCIAL STATUS ($MILLION)
TABLE 130.THERMAX LIMITED: COMPANY SNAPSHOT
TABLE 131.THERMAX LIMITED: OPERATING SEGMENTS
TABLE 132.THERMAX LIMITED: PRODUCT PORTFOLIO
TABLE 133.OVERALL FINANCIAL STATUS ($MILLION)
TABLE 134.THERMAX LIMITED: KEY STRATEGIC MOVES AND DEVELOPMENTS
TABLE 135.THYSSENKRUPP AG: COMPANY SNAPSHOT
TABLE 136.THYSSENKRUPP AG: OPERATING SEGMENTS
TABLE 137.THYSSENKRUPP AG: PRODUCT PORTFOLIO
TABLE 138.OVERALL FINANCIAL STATUS ($MILLION)
TABLE 139.THYSSENKRUPP AG: KEY STRATEGIC MOVES AND DEVELOPMENTS
TABLE 140.VIESSMANN LIMITED: COMPANY SNAPSHOT
TABLE 141.VIESSMANN LIMITED
LIST OF FIGURES
FIGURE 01.KEY MARKET SEGMENTS
FIGURE 02.MODERATE BARGAINING POWER OF SUPPLIERS
FIGURE 03.MODERATE THREAT OF NEW ENTRANTS
FIGURE 04.MODERATE THREAT OF SUBSTITUTES
FIGURE 05.MODERATE INTENSITY OF COMPETITIVE RIVALRY
FIGURE 06.MODERATE BARGAINING POWER OF BUYERS
FIGURE 07.VALUE CHAIN ANALYSIS
FIGURE 08.TOP INVESTMENT POCKETS
FIGURE 09.PATENT ANALYSIS, BY REGION
FIGURE 10.STEAM BOILER MARKET DYNAMICS
FIGURE 11.GLOBAL STEAM BOILER MARKET, BY TYPE, 2019–2027
FIGURE 12.COMPARATIVE ANALYSIS OF WATER TUBE BOILER MARKET, BY COUNTRY, 2019 & 2027 ($MILLION)
FIGURE 13.COMPARATIVE ANALYSIS OF FIRE TUBE BOILER MARKET, BY COUNTRY, 2019 & 2027 ($MILLION)
FIGURE 14.GLOBAL STEAM BOILER MARKET, BY PRESSURE, 2019–2027
FIGURE 15.COMPARATIVE ANALYSIS OF LOW-PRESSURE STEAM BOILER MARKET, BY COUNTRY, 2019 & 2027 ($MILLION)
FIGURE 16.COMPARATIVE ANALYSIS OF HIGH-PRESSURE STEAM BOILER MARKET, BY COUNTRY, 2019 & 2027 ($MILLION)
FIGURE 17.GLOBAL STEAM BOILER MARKET, BY FUEL TYPE, 2019–2027
FIGURE 18.COMPARATIVE ANALYSIS OF COAL FIRED STEAM BOILER MARKET, BY COUNTRY, 2019 & 2027 ($MILLION)
FIGURE 19.COMPARATIVE ANALYSIS OF OIL-FIRED STEAM BOILER MARKET, BY COUNTRY, 2019 & 2027 ($MILLION)
FIGURE 20.COMPARATIVE ANALYSIS OF GAS FIRED STEAM BOILER MARKET, BY COUNTRY, 2019 & 2027 ($MILLION)
FIGURE 21.COMPARATIVE ANALYSIS OF STEAM BOILER MARKET FOR OTHERS, BY COUNTRY, 2019 & 2027 ($MILLION)
FIGURE 22.GLOBAL STEAM BOILER MARKET, BY END-USE INDUSTRY, 2019–2027
FIGURE 23.COMPARATIVE ANALYSIS OF STEAM BOILER MARKET FOR POWER GENERATION SECTOR, BY COUNTRY, 2019 & 2027 ($MILLION)
FIGURE 24.COMPARATIVE ANALYSIS OF STEAM BOILER MARKET FOR OIL & GAS SECTOR, BY COUNTRY, 2019 & 2027 ($MILLION)
FIGURE 25.COMPARATIVE ANALYSIS OF STEAM BOILER MARKET FOR CHEMICAL SECTOR, BY COUNTRY, 2019 & 2027 ($MILLION)
FIGURE 26.COMPARATIVE ANALYSIS OF STEAM BOILER MARKET FOR OTHERS, BY COUNTRY, 2019 & 2027 ($MILLION)
FIGURE 27.U.S. STEAM BOILER MARKET REVENUE, 2019–2027 ($MILLION)
FIGURE 28.CANADA STEAM BOILER MARKET REVENUE, 2019–2027 ($MILLION)
FIGURE 29.MEXICO STEAM BOILER MARKET REVENUE, 2019–2027 ($MILLION)
FIGURE 30.GERMANY STEAM BOILER MARKET REVENUE, 2019–2027 ($MILLION)
FIGURE 31.FRANCE STEAM BOILER MARKET REVENUE, 2019–2027 ($MILLION)
FIGURE 32.ITALY STEAM BOILER MARKET REVENUE, 2019–2027 ($MILLION)
FIGURE 33.UK STEAM BOILER MARKET REVENUE, 2019–2027 ($MILLION)
FIGURE 34.REST OF EUROPE STEAM BOILER MARKET REVENUE, 2019–2027 ($MILLION)
FIGURE 35.CHINA STEAM BOILER MARKET REVENUE, 2019–2027 ($MILLION)
FIGURE 36.JAPAN STEAM BOILER MARKET REVENUE, 2019–2027 ($MILLION)
FIGURE 37.INDIA STEAM BOILER MARKET REVENUE, 2019–2027 ($MILLION)
FIGURE 38.REST OF ASIA-PACIFIC STEAM BOILER MARKET REVENUE, 2019–2027 ($MILLION)
FIGURE 39.BRAZIL STEAM BOILER MARKET REVENUE, 2019–2027 ($MILLION)
FIGURE 40.SAUDI ARABIA STEAM BOILER MARKET REVENUE, 2019–2027 ($MILLION)
FIGURE 41.SOUTH AFRICA STEAM BOILER MARKET REVENUE, 2019–2027 ($MILLION)
FIGURE 42.REST OF LAMEA STEAM BOILER MARKET REVENUE, 2019–2027 ($MILLION)
FIGURE 43.MARKET PLAYER POSITIONING, 2019
FIGURE 44.TOP WINNING STRATEGIES, BY YEAR, 2016–2020
FIGURE 45.TOP WINNING STRATEGIES, BY DEVELOPMENT, 2016–2020 (%)
FIGURE 46.TOP WINNING STRATEGIES, BY COMPANY, 2016–2020
FIGURE 47.PRODUCT MAPPING OF TOP 10 PLAYERS
FIGURE 48.COMPETITIVE HEATMAP OF KEY PLAYERS
FIGURE 49.ALFA LAVAL AB: NET SALES, 2017–2019 ($MILLION)
FIGURE 50.ALFA LAVAL AB: REVENUE SHARE BY SEGMENT, 2019 (%)
FIGURE 51.ALFA LAVAL AB: REVENUE SHARE BY REGION, 2019 (%)
FIGURE 52.BABCOCK & WILCOX: REVENUE, 2017–2019 ($MILLION)
FIGURE 53.BABCOCK & WILCOX: REVENUE SHARE BY SEGMENT, 2019 (%)
FIGURE 54.BABCOCK & WILCOX: REVENUE SHARE BY REGION, 2019 (%)
FIGURE 55.GENERAL ELECTRIC: REVENUE, 2017–2019 ($MILLION)
FIGURE 56.GENERAL ELECTRIC: REVENUE SHARE BY SEGMENT, 2019 (%)
FIGURE 57.GENERAL ELECTRIC: REVENUE SHARE BY REGION, 2019 (%)
FIGURE 58.IHI CORPORATION: REVENUE, 2017–2019 ($MILLION)
FIGURE 59.IHI CORPORATION: REVENUE SHARE BY SEGMENT, 2019 (%)
FIGURE 60.IHI CORPORATION: REVENUE SHARE BY REGION, 2019 (%)
FIGURE 61.MITSUBISHI: REVENUE, 2017–2019 ($MILLION)
FIGURE 62.MITSUBISHI: REVENUE SHARE BY SEGMENT, 2019 (%)
FIGURE 63.MITSUBISHI: REVENUE SHARE BY REGION, 2019 (%)
FIGURE 64.THERMAX LIMITED: REVENUE, 2017–2019 ($MILLION)
FIGURE 65.THERMAX LIMITED: REVENUE SHARE BY SEGMENT, 2019 (%)
FIGURE 66.THERMAX LIMITED: REVENUE SHARE BY REGION, 2019 (%)
FIGURE 67.THYSSENKRUPP AG: NET SALES, 2018–2020 ($MILLION)
FIGURE 68.THYSSENKRUPP AG: REVENUE SHARE BY SEGMENT, 2019 (%)
FIGURE 69.THYSSENKRUPP AG: REVENUE SHARE BY REGION, 2019 (%)