Categories
Life Sciences Consumer Goods Materials and Chemicals Construction & Manufacturing Food and Beverages Energy and Power Semiconductor and Electronics Automotive and Transportation ICT & Media Aerospace & Defense BFSI

Int'l : +1-503-894-6022 | Toll Free : +1-800-792-5285 | help@alliedmarketresearch.com

Surface Combatant Market by Platform (Aircraft Carriers, Destroyers, Corvettes, Amphibious ships, Frigates, Auxiliary Vessels), by System (Marine Engine System, Weapon Launch System, Control System, Electrical system, Communication System, Others) and by Application (Search and Rescue, Combat operations, MCM Operations, Coastal Surveillance, Others): Global Opportunity Analysis and Industry Forecast, 2023-2032

A10147

Pages: NA

Charts: NA

Tables: NA

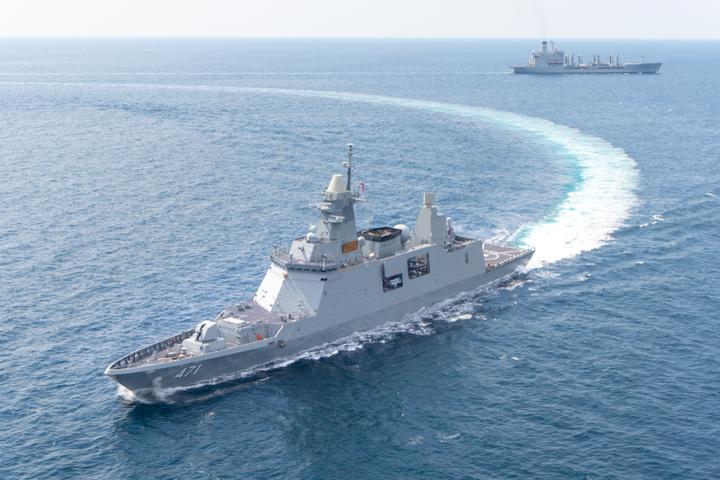
The surface combatant,also known as surface shipor surface vessel, is a subset of naval warships thatis designed for warfare on the surface of the water, with weapons and armed forces. They are generally ships built to fight other ships, submarines, aircraft or land targets, and can carry out several other missions, including counter-narcotics operations and maritime interdiction. Their primary purpose is to engage space, air, surface, and submerged targets with weapons deployed from the ship itself, rather than by manned carried craft. Moreover, the surface combatants are technologically advanced warships used for sea-based battlefield operations. Naval warships are equipped with their weapon launch systems such as anti-submarine rocket launchers, torpedo launching systems, rocket launchers, and vertical missile launchers. The incorporation of information, communication, and technology (ICT) in the naval ship is expected to boostthe growth of the surface combatant market during the forecast period.

COVID-19 scenario analysis:

  • The global market for surface combatant is severely impacted by the outbreak of the COVID-19 pandemic.
  • The COVID-19 pandemic saw a decline in the economic growth in almost all the major countries, thus affecting consumer spending patterns.
  • Owing to the lockdown implemented across various countries, national and international transport have been hampered, which has significantly impacted the supply chain of numerous industries across the globe, thereby increasing the supply–demand gap.
  • Thus, insufficiency in raw material supply is expected to hamper the production rate of aircraft doors, which negatively impact the market growth.
  • However, government around the world have allowed only few essential industries to operate until situation becomes favorable for resuming other business activities.
  • This situation is further expected to improve as government has started relaxing norms around the world for resuming business activities.

Top impacting factors: market scenario analysis, trends, drivers, and impact analysis

Some of the factors that boost the growth of the global market include the use of robotics and technological advancements in naval vessels and surface combatant’s shipbuilding facilitiesand increase in adoption of LNG fueled engines in the naval vessels and surface combatants. However, high development cost of naval vessels and surface combatants and prevalent practices, industry consolidation, and procurement patterns within the marketare creating obstacles,thus hampering the market growth. Conversely, new products, processes, and innovations recently inducted within the sectorare expected to offer lucrative opportunities for the market during the forecast period.

The surface combatant market trends are as follows:

Use of robotics and technological advancements naval vessels and surface combatants shipbuilding facilities

New technologies in naval vessels and surface combatants provide safe and efficient maritime operations. Shipbuilding robotics is used to carry out welding, heavy lifting, blasting, painting, and other tasks in the shipyards. Many companies are launching such products, which are currently in the production processes are carried out by using robotic systems. In addition, these robotics systems are increasing the production rate of the shipbuilding industry. Moreover, these companies which have developed mini welding robots are set to adopt robotics technology in shipbuilding. Furthermore, increase indemand for robotics technology in shipbuilding is fueling naval vessels and surface combatants market growth.

Increase in adoption of LNG fueled engines in the naval vessels and surface combatants

The liquefied Natural Gas (LNG) is an alternate fuel for naval vessels and surface combatants. In the LNG engines, CO2 emission is reduced by 20% as compared to conventional diesel engines. Nitrogen oxide emission (NOX) emissions are cut by almost 90%, while sulfur oxide (SOX) emissions are eliminated. Furthermore, the new generation of naval vessel engines is strongly required to comply with the TIER 3 restrictions in many economies by the International Maritime Organization (IMO). Therefore, increase inadoption of LNG fueled engines will propel the growth of the market in the forecast period.

Key benefits of the report:

  • This study presents the analytical depiction of the surface combatant market industry along with the current trends and future estimations to determine the imminent investment pockets.
  • The report presents information related to key drivers, restraints, and opportunities along with a detailed analysis of the surface combatant market share.
  • The current market is quantitatively analyzed to highlight the surface combatant market scenario.
  • Porter’s five forces analysis illustrates the potency of buyers & suppliers in the market.
  • The report provides a detailed surface combatant market analysis based on competitive intensity and how the competition will take shape in the coming years.

Questions answered in the surface combatant market research report:

  • Whichare the leading players active in the surface combatant market?
  • What are the current trends that will influence the market in the next few years?
  • What are the driving factors, restraints, and opportunities of the market?
  • What are the projections for the future that would help in taking further strategic steps?

Key Market Segments

  • By Platform
    • Aircraft Carriers
    • Destroyers
    • Corvettes
    • Amphibious ships
    • Frigates
    • Auxiliary Vessels
  • By System
    • Marine Engine System
    • Weapon Launch System
    • Control System
    • Electrical system
    • Communication System
    • Others
  • By Application
    • Search and Rescue
    • Combat operations
    • MCM Operations
    • Coastal Surveillance
    • Others
  • By Region
    • North America
      • U.S.
      • Canada
      • Mexico
    • Europe
      • France
      • Germany
      • Italy
      • UK
      • Rest of Europe
    • Asia-Pacific
      • China
      • Japan
      • India
      • South Korea
      • Rest of Asia-Pacific
    • LAMEA
      • Latin America
      • Middle East
      • Africa


Key Market Players

  • ASC PTY LTD
  • Huntington Ingalls Industries
  • BAE Systems
  • Damen Shipyards Group
  • Austal Limited
  • Naval Group
  • x`General Dynamics Corporation
  • Abu Dhabi Ship Building
  • General Dynamics Corp
  • CHAPTER 1: INTRODUCTION

    • 1.1. Report Description

    • 1.2. Key Market Segments

    • 1.3. Key Benefits

    • 1.4. Research Methodology

      • 1.4.1. Primary Research

      • 1.4.2. Secondary Research

      • 1.4.3. Analyst Tools and Models

  • CHAPTER 2: EXECUTIVE SUMMARY

    • 2.1. CXO Perspective

  • CHAPTER 3: MARKET LANDSCAPE

    • 3.1. Market Definition and Scope

    • 3.2. Key Findings

      • 3.2.1. Top Investment Pockets

      • 3.2.2. Top Winning Strategies

    • 3.3. Porter's Five Forces Analysis

      • 3.3.1. Bargaining Power of Suppliers

      • 3.3.2. Threat of New Entrants

      • 3.3.3. Threat of Substitutes

      • 3.3.4. Competitive Rivalry

      • 3.3.5. Bargaining Power among Buyers

    • 3.5. Market Dynamics

      • 3.5.1. Drivers

      • 3.5.2. Restraints

      • 3.5.3. Opportunities

  • CHAPTER 4: SURFACE COMBATANT MARKET, BY PLATFORM

    • 4.1. Market Overview

      • 4.1.1 Market Size and Forecast, By Platform

    • 4.2. Aircraft Carriers

      • 4.2.1. Key Market Trends, Growth Factors and Opportunities

      • 4.2.2. Market Size and Forecast, By Region

      • 4.2.3. Market Share Analysis, By Country

    • 4.3. Destroyers

      • 4.3.1. Key Market Trends, Growth Factors and Opportunities

      • 4.3.2. Market Size and Forecast, By Region

      • 4.3.3. Market Share Analysis, By Country

    • 4.4. Corvettes

      • 4.4.1. Key Market Trends, Growth Factors and Opportunities

      • 4.4.2. Market Size and Forecast, By Region

      • 4.4.3. Market Share Analysis, By Country

    • 4.5. Amphibious Ships

      • 4.5.1. Key Market Trends, Growth Factors and Opportunities

      • 4.5.2. Market Size and Forecast, By Region

      • 4.5.3. Market Share Analysis, By Country

    • 4.6. Frigates

      • 4.6.1. Key Market Trends, Growth Factors and Opportunities

      • 4.6.2. Market Size and Forecast, By Region

      • 4.6.3. Market Share Analysis, By Country

    • 4.7. Auxiliary Vessels

      • 4.7.1. Key Market Trends, Growth Factors and Opportunities

      • 4.7.2. Market Size and Forecast, By Region

      • 4.7.3. Market Share Analysis, By Country

  • CHAPTER 5: SURFACE COMBATANT MARKET, BY SYSTEM

    • 5.1. Market Overview

      • 5.1.1 Market Size and Forecast, By System

    • 5.2. Marine Engine System

      • 5.2.1. Key Market Trends, Growth Factors and Opportunities

      • 5.2.2. Market Size and Forecast, By Region

      • 5.2.3. Market Share Analysis, By Country

    • 5.3. Weapon Launch System

      • 5.3.1. Key Market Trends, Growth Factors and Opportunities

      • 5.3.2. Market Size and Forecast, By Region

      • 5.3.3. Market Share Analysis, By Country

    • 5.4. Control System

      • 5.4.1. Key Market Trends, Growth Factors and Opportunities

      • 5.4.2. Market Size and Forecast, By Region

      • 5.4.3. Market Share Analysis, By Country

    • 5.5. Electrical System

      • 5.5.1. Key Market Trends, Growth Factors and Opportunities

      • 5.5.2. Market Size and Forecast, By Region

      • 5.5.3. Market Share Analysis, By Country

    • 5.6. Communication System

      • 5.6.1. Key Market Trends, Growth Factors and Opportunities

      • 5.6.2. Market Size and Forecast, By Region

      • 5.6.3. Market Share Analysis, By Country

    • 5.7. Others

      • 5.7.1. Key Market Trends, Growth Factors and Opportunities

      • 5.7.2. Market Size and Forecast, By Region

      • 5.7.3. Market Share Analysis, By Country

  • CHAPTER 6: SURFACE COMBATANT MARKET, BY APPLICATION

    • 6.1. Market Overview

      • 6.1.1 Market Size and Forecast, By Application

    • 6.2. Search And Rescue

      • 6.2.1. Key Market Trends, Growth Factors and Opportunities

      • 6.2.2. Market Size and Forecast, By Region

      • 6.2.3. Market Share Analysis, By Country

    • 6.3. Combat Operations

      • 6.3.1. Key Market Trends, Growth Factors and Opportunities

      • 6.3.2. Market Size and Forecast, By Region

      • 6.3.3. Market Share Analysis, By Country

    • 6.4. MCM Operations

      • 6.4.1. Key Market Trends, Growth Factors and Opportunities

      • 6.4.2. Market Size and Forecast, By Region

      • 6.4.3. Market Share Analysis, By Country

    • 6.5. Coastal Surveillance

      • 6.5.1. Key Market Trends, Growth Factors and Opportunities

      • 6.5.2. Market Size and Forecast, By Region

      • 6.5.3. Market Share Analysis, By Country

    • 6.6. Others

      • 6.6.1. Key Market Trends, Growth Factors and Opportunities

      • 6.6.2. Market Size and Forecast, By Region

      • 6.6.3. Market Share Analysis, By Country

  • CHAPTER 7: SURFACE COMBATANT MARKET, BY REGION

    • 7.1. Market Overview

      • 7.1.1 Market Size and Forecast, By Region

    • 7.2. North America

      • 7.2.1. Key Market Trends and Opportunities

      • 7.2.2. Market Size and Forecast, By Platform

      • 7.2.3. Market Size and Forecast, By System

      • 7.2.4. Market Size and Forecast, By Application

      • 7.2.5. Market Size and Forecast, By Country

      • 7.2.6. U.S. Surface Combatant Market

        • 7.2.6.1. Market Size and Forecast, By Platform
        • 7.2.6.2. Market Size and Forecast, By System
        • 7.2.6.3. Market Size and Forecast, By Application
      • 7.2.7. Canada Surface Combatant Market

        • 7.2.7.1. Market Size and Forecast, By Platform
        • 7.2.7.2. Market Size and Forecast, By System
        • 7.2.7.3. Market Size and Forecast, By Application
      • 7.2.8. Mexico Surface Combatant Market

        • 7.2.8.1. Market Size and Forecast, By Platform
        • 7.2.8.2. Market Size and Forecast, By System
        • 7.2.8.3. Market Size and Forecast, By Application
    • 7.3. Europe

      • 7.3.1. Key Market Trends and Opportunities

      • 7.3.2. Market Size and Forecast, By Platform

      • 7.3.3. Market Size and Forecast, By System

      • 7.3.4. Market Size and Forecast, By Application

      • 7.3.5. Market Size and Forecast, By Country

      • 7.3.6. France Surface Combatant Market

        • 7.3.6.1. Market Size and Forecast, By Platform
        • 7.3.6.2. Market Size and Forecast, By System
        • 7.3.6.3. Market Size and Forecast, By Application
      • 7.3.7. Germany Surface Combatant Market

        • 7.3.7.1. Market Size and Forecast, By Platform
        • 7.3.7.2. Market Size and Forecast, By System
        • 7.3.7.3. Market Size and Forecast, By Application
      • 7.3.8. Italy Surface Combatant Market

        • 7.3.8.1. Market Size and Forecast, By Platform
        • 7.3.8.2. Market Size and Forecast, By System
        • 7.3.8.3. Market Size and Forecast, By Application
      • 7.3.9. Spain Surface Combatant Market

        • 7.3.9.1. Market Size and Forecast, By Platform
        • 7.3.9.2. Market Size and Forecast, By System
        • 7.3.9.3. Market Size and Forecast, By Application
      • 7.3.10. UK Surface Combatant Market

        • 7.3.10.1. Market Size and Forecast, By Platform
        • 7.3.10.2. Market Size and Forecast, By System
        • 7.3.10.3. Market Size and Forecast, By Application
      • 7.3.11. Russia Surface Combatant Market

        • 7.3.11.1. Market Size and Forecast, By Platform
        • 7.3.11.2. Market Size and Forecast, By System
        • 7.3.11.3. Market Size and Forecast, By Application
      • 7.3.12. Rest Of Europe Surface Combatant Market

        • 7.3.12.1. Market Size and Forecast, By Platform
        • 7.3.12.2. Market Size and Forecast, By System
        • 7.3.12.3. Market Size and Forecast, By Application
    • 7.4. Asia-Pacific

      • 7.4.1. Key Market Trends and Opportunities

      • 7.4.2. Market Size and Forecast, By Platform

      • 7.4.3. Market Size and Forecast, By System

      • 7.4.4. Market Size and Forecast, By Application

      • 7.4.5. Market Size and Forecast, By Country

      • 7.4.6. China Surface Combatant Market

        • 7.4.6.1. Market Size and Forecast, By Platform
        • 7.4.6.2. Market Size and Forecast, By System
        • 7.4.6.3. Market Size and Forecast, By Application
      • 7.4.7. Japan Surface Combatant Market

        • 7.4.7.1. Market Size and Forecast, By Platform
        • 7.4.7.2. Market Size and Forecast, By System
        • 7.4.7.3. Market Size and Forecast, By Application
      • 7.4.8. India Surface Combatant Market

        • 7.4.8.1. Market Size and Forecast, By Platform
        • 7.4.8.2. Market Size and Forecast, By System
        • 7.4.8.3. Market Size and Forecast, By Application
      • 7.4.9. South Korea Surface Combatant Market

        • 7.4.9.1. Market Size and Forecast, By Platform
        • 7.4.9.2. Market Size and Forecast, By System
        • 7.4.9.3. Market Size and Forecast, By Application
      • 7.4.10. Australia Surface Combatant Market

        • 7.4.10.1. Market Size and Forecast, By Platform
        • 7.4.10.2. Market Size and Forecast, By System
        • 7.4.10.3. Market Size and Forecast, By Application
      • 7.4.11. Thailand Surface Combatant Market

        • 7.4.11.1. Market Size and Forecast, By Platform
        • 7.4.11.2. Market Size and Forecast, By System
        • 7.4.11.3. Market Size and Forecast, By Application
      • 7.4.12. Malaysia Surface Combatant Market

        • 7.4.12.1. Market Size and Forecast, By Platform
        • 7.4.12.2. Market Size and Forecast, By System
        • 7.4.12.3. Market Size and Forecast, By Application
      • 7.4.13. Indonesia Surface Combatant Market

        • 7.4.13.1. Market Size and Forecast, By Platform
        • 7.4.13.2. Market Size and Forecast, By System
        • 7.4.13.3. Market Size and Forecast, By Application
      • 7.4.14. Rest of Asia Pacific Surface Combatant Market

        • 7.4.14.1. Market Size and Forecast, By Platform
        • 7.4.14.2. Market Size and Forecast, By System
        • 7.4.14.3. Market Size and Forecast, By Application
    • 7.5. LAMEA

      • 7.5.1. Key Market Trends and Opportunities

      • 7.5.2. Market Size and Forecast, By Platform

      • 7.5.3. Market Size and Forecast, By System

      • 7.5.4. Market Size and Forecast, By Application

      • 7.5.5. Market Size and Forecast, By Country

      • 7.5.6. Brazil Surface Combatant Market

        • 7.5.6.1. Market Size and Forecast, By Platform
        • 7.5.6.2. Market Size and Forecast, By System
        • 7.5.6.3. Market Size and Forecast, By Application
      • 7.5.7. South Africa Surface Combatant Market

        • 7.5.7.1. Market Size and Forecast, By Platform
        • 7.5.7.2. Market Size and Forecast, By System
        • 7.5.7.3. Market Size and Forecast, By Application
      • 7.5.8. Saudi Arabia Surface Combatant Market

        • 7.5.8.1. Market Size and Forecast, By Platform
        • 7.5.8.2. Market Size and Forecast, By System
        • 7.5.8.3. Market Size and Forecast, By Application
      • 7.5.9. UAE Surface Combatant Market

        • 7.5.9.1. Market Size and Forecast, By Platform
        • 7.5.9.2. Market Size and Forecast, By System
        • 7.5.9.3. Market Size and Forecast, By Application
      • 7.5.10. Argentina Surface Combatant Market

        • 7.5.10.1. Market Size and Forecast, By Platform
        • 7.5.10.2. Market Size and Forecast, By System
        • 7.5.10.3. Market Size and Forecast, By Application
      • 7.5.11. Rest of LAMEA Surface Combatant Market

        • 7.5.11.1. Market Size and Forecast, By Platform
        • 7.5.11.2. Market Size and Forecast, By System
        • 7.5.11.3. Market Size and Forecast, By Application
  • CHAPTER 8: COMPETITIVE LANDSCAPE

    • 8.1. Introduction

    • 8.2. Top Winning Strategies

    • 8.3. Product Mapping Of Top 10 Player

    • 8.4. Competitive Dashboard

    • 8.5. Competitive Heatmap

    • 8.6. Top Player Positioning, 2024

  • CHAPTER 9: COMPANY PROFILES

    • 9.1. Abu Dhabi Ship Building

      • 9.1.1. Company Overview

      • 9.1.2. Key Executives

      • 9.1.3. Company Snapshot

      • 9.1.4. Operating Business Segments

      • 9.1.5. Product Portfolio

      • 9.1.6. Business Performance

      • 9.1.7. Key Strategic Moves and Developments

    • 9.2. ASC PTY LTD

      • 9.2.1. Company Overview

      • 9.2.2. Key Executives

      • 9.2.3. Company Snapshot

      • 9.2.4. Operating Business Segments

      • 9.2.5. Product Portfolio

      • 9.2.6. Business Performance

      • 9.2.7. Key Strategic Moves and Developments

    • 9.3. Austal Limited

      • 9.3.1. Company Overview

      • 9.3.2. Key Executives

      • 9.3.3. Company Snapshot

      • 9.3.4. Operating Business Segments

      • 9.3.5. Product Portfolio

      • 9.3.6. Business Performance

      • 9.3.7. Key Strategic Moves and Developments

    • 9.4. BAE Systems

      • 9.4.1. Company Overview

      • 9.4.2. Key Executives

      • 9.4.3. Company Snapshot

      • 9.4.4. Operating Business Segments

      • 9.4.5. Product Portfolio

      • 9.4.6. Business Performance

      • 9.4.7. Key Strategic Moves and Developments

    • 9.5. Damen Shipyards Group

      • 9.5.1. Company Overview

      • 9.5.2. Key Executives

      • 9.5.3. Company Snapshot

      • 9.5.4. Operating Business Segments

      • 9.5.5. Product Portfolio

      • 9.5.6. Business Performance

      • 9.5.7. Key Strategic Moves and Developments

    • 9.6. X`General Dynamics Corporation

      • 9.6.1. Company Overview

      • 9.6.2. Key Executives

      • 9.6.3. Company Snapshot

      • 9.6.4. Operating Business Segments

      • 9.6.5. Product Portfolio

      • 9.6.6. Business Performance

      • 9.6.7. Key Strategic Moves and Developments

    • 9.7. Huntington Ingalls Industries

      • 9.7.1. Company Overview

      • 9.7.2. Key Executives

      • 9.7.3. Company Snapshot

      • 9.7.4. Operating Business Segments

      • 9.7.5. Product Portfolio

      • 9.7.6. Business Performance

      • 9.7.7. Key Strategic Moves and Developments

    • 9.8. General Dynamics Corp

      • 9.8.1. Company Overview

      • 9.8.2. Key Executives

      • 9.8.3. Company Snapshot

      • 9.8.4. Operating Business Segments

      • 9.8.5. Product Portfolio

      • 9.8.6. Business Performance

      • 9.8.7. Key Strategic Moves and Developments

    • 9.9. Naval Group

      • 9.9.1. Company Overview

      • 9.9.2. Key Executives

      • 9.9.3. Company Snapshot

      • 9.9.4. Operating Business Segments

      • 9.9.5. Product Portfolio

      • 9.9.6. Business Performance

      • 9.9.7. Key Strategic Moves and Developments

  • LIST OF TABLES

  • TABLE 1. GLOBAL SURFACE COMBATANT MARKET, BY PLATFORM, 2025-2033 ($MILLION)
  • TABLE 2. GLOBAL SURFACE COMBATANT MARKET FOR AIRCRAFT CARRIERS, BY REGION, 2025-2033 ($MILLION)
  • TABLE 3. GLOBAL SURFACE COMBATANT MARKET FOR DESTROYERS, BY REGION, 2025-2033 ($MILLION)
  • TABLE 4. GLOBAL SURFACE COMBATANT MARKET FOR CORVETTES, BY REGION, 2025-2033 ($MILLION)
  • TABLE 5. GLOBAL SURFACE COMBATANT MARKET FOR AMPHIBIOUS SHIPS, BY REGION, 2025-2033 ($MILLION)
  • TABLE 6. GLOBAL SURFACE COMBATANT MARKET FOR FRIGATES, BY REGION, 2025-2033 ($MILLION)
  • TABLE 7. GLOBAL SURFACE COMBATANT MARKET FOR AUXILIARY VESSELS, BY REGION, 2025-2033 ($MILLION)
  • TABLE 8. GLOBAL SURFACE COMBATANT MARKET, BY SYSTEM, 2025-2033 ($MILLION)
  • TABLE 9. GLOBAL SURFACE COMBATANT MARKET FOR MARINE ENGINE SYSTEM, BY REGION, 2025-2033 ($MILLION)
  • TABLE 10. GLOBAL SURFACE COMBATANT MARKET FOR WEAPON LAUNCH SYSTEM, BY REGION, 2025-2033 ($MILLION)
  • TABLE 11. GLOBAL SURFACE COMBATANT MARKET FOR CONTROL SYSTEM, BY REGION, 2025-2033 ($MILLION)
  • TABLE 12. GLOBAL SURFACE COMBATANT MARKET FOR ELECTRICAL SYSTEM, BY REGION, 2025-2033 ($MILLION)
  • TABLE 13. GLOBAL SURFACE COMBATANT MARKET FOR COMMUNICATION SYSTEM, BY REGION, 2025-2033 ($MILLION)
  • TABLE 14. GLOBAL SURFACE COMBATANT MARKET FOR OTHERS, BY REGION, 2025-2033 ($MILLION)
  • TABLE 15. GLOBAL SURFACE COMBATANT MARKET, BY APPLICATION, 2025-2033 ($MILLION)
  • TABLE 16. GLOBAL SURFACE COMBATANT MARKET FOR SEARCH AND RESCUE, BY REGION, 2025-2033 ($MILLION)
  • TABLE 17. GLOBAL SURFACE COMBATANT MARKET FOR COMBAT OPERATIONS, BY REGION, 2025-2033 ($MILLION)
  • TABLE 18. GLOBAL SURFACE COMBATANT MARKET FOR MCM OPERATIONS, BY REGION, 2025-2033 ($MILLION)
  • TABLE 19. GLOBAL SURFACE COMBATANT MARKET FOR COASTAL SURVEILLANCE, BY REGION, 2025-2033 ($MILLION)
  • TABLE 20. GLOBAL SURFACE COMBATANT MARKET FOR OTHERS, BY REGION, 2025-2033 ($MILLION)
  • TABLE 21. GLOBAL SURFACE COMBATANT MARKET, BY REGION, 2025-2033 ($MILLION)
  • TABLE 22. NORTH AMERICA SURFACE COMBATANT, BY REGION, 2025-2033 ($MILLION)
  • TABLE 23. NORTH AMERICA SURFACE COMBATANT, BY PLATFORM, 2025-2033 ($MILLION)
  • TABLE 24. NORTH AMERICA SURFACE COMBATANT, BY SYSTEM, 2025-2033 ($MILLION)
  • TABLE 25. NORTH AMERICA SURFACE COMBATANT, BY APPLICATION, 2025-2033 ($MILLION)
  • TABLE 26. U.S. SURFACE COMBATANT, BY PLATFORM, 2025-2033 ($MILLION)
  • TABLE 27. U.S. SURFACE COMBATANT, BY SYSTEM, 2025-2033 ($MILLION)
  • TABLE 28. U.S. SURFACE COMBATANT, BY APPLICATION, 2025-2033 ($MILLION)
  • TABLE 29. CANADA SURFACE COMBATANT, BY PLATFORM, 2025-2033 ($MILLION)
  • TABLE 30. CANADA SURFACE COMBATANT, BY SYSTEM, 2025-2033 ($MILLION)
  • TABLE 31. CANADA SURFACE COMBATANT, BY APPLICATION, 2025-2033 ($MILLION)
  • TABLE 32. MEXICO SURFACE COMBATANT, BY PLATFORM, 2025-2033 ($MILLION)
  • TABLE 33. MEXICO SURFACE COMBATANT, BY SYSTEM, 2025-2033 ($MILLION)
  • TABLE 34. MEXICO SURFACE COMBATANT, BY APPLICATION, 2025-2033 ($MILLION)
  • TABLE 35. EUROPE SURFACE COMBATANT, BY REGION, 2025-2033 ($MILLION)
  • TABLE 36. EUROPE SURFACE COMBATANT, BY PLATFORM, 2025-2033 ($MILLION)
  • TABLE 37. EUROPE SURFACE COMBATANT, BY SYSTEM, 2025-2033 ($MILLION)
  • TABLE 38. EUROPE SURFACE COMBATANT, BY APPLICATION, 2025-2033 ($MILLION)
  • TABLE 39. FRANCE SURFACE COMBATANT, BY PLATFORM, 2025-2033 ($MILLION)
  • TABLE 40. FRANCE SURFACE COMBATANT, BY SYSTEM, 2025-2033 ($MILLION)
  • TABLE 41. FRANCE SURFACE COMBATANT, BY APPLICATION, 2025-2033 ($MILLION)
  • TABLE 42. GERMANY SURFACE COMBATANT, BY PLATFORM, 2025-2033 ($MILLION)
  • TABLE 43. GERMANY SURFACE COMBATANT, BY SYSTEM, 2025-2033 ($MILLION)
  • TABLE 44. GERMANY SURFACE COMBATANT, BY APPLICATION, 2025-2033 ($MILLION)
  • TABLE 45. ITALY SURFACE COMBATANT, BY PLATFORM, 2025-2033 ($MILLION)
  • TABLE 46. ITALY SURFACE COMBATANT, BY SYSTEM, 2025-2033 ($MILLION)
  • TABLE 47. ITALY SURFACE COMBATANT, BY APPLICATION, 2025-2033 ($MILLION)
  • TABLE 48. SPAIN SURFACE COMBATANT, BY PLATFORM, 2025-2033 ($MILLION)
  • TABLE 49. SPAIN SURFACE COMBATANT, BY SYSTEM, 2025-2033 ($MILLION)
  • TABLE 50. SPAIN SURFACE COMBATANT, BY APPLICATION, 2025-2033 ($MILLION)
  • TABLE 51. UK SURFACE COMBATANT, BY PLATFORM, 2025-2033 ($MILLION)
  • TABLE 52. UK SURFACE COMBATANT, BY SYSTEM, 2025-2033 ($MILLION)
  • TABLE 53. UK SURFACE COMBATANT, BY APPLICATION, 2025-2033 ($MILLION)
  • TABLE 54. RUSSIA SURFACE COMBATANT, BY PLATFORM, 2025-2033 ($MILLION)
  • TABLE 55. RUSSIA SURFACE COMBATANT, BY SYSTEM, 2025-2033 ($MILLION)
  • TABLE 56. RUSSIA SURFACE COMBATANT, BY APPLICATION, 2025-2033 ($MILLION)
  • TABLE 57. REST OF EUROPE SURFACE COMBATANT, BY PLATFORM, 2025-2033 ($MILLION)
  • TABLE 58. REST OF EUROPE SURFACE COMBATANT, BY SYSTEM, 2025-2033 ($MILLION)
  • TABLE 59. REST OF EUROPE SURFACE COMBATANT, BY APPLICATION, 2025-2033 ($MILLION)
  • TABLE 60. ASIA-PACIFIC SURFACE COMBATANT, BY REGION, 2025-2033 ($MILLION)
  • TABLE 61. ASIA-PACIFIC SURFACE COMBATANT, BY PLATFORM, 2025-2033 ($MILLION)
  • TABLE 62. ASIA-PACIFIC SURFACE COMBATANT, BY SYSTEM, 2025-2033 ($MILLION)
  • TABLE 63. ASIA-PACIFIC SURFACE COMBATANT, BY APPLICATION, 2025-2033 ($MILLION)
  • TABLE 64. CHINA SURFACE COMBATANT, BY PLATFORM, 2025-2033 ($MILLION)
  • TABLE 65. CHINA SURFACE COMBATANT, BY SYSTEM, 2025-2033 ($MILLION)
  • TABLE 66. CHINA SURFACE COMBATANT, BY APPLICATION, 2025-2033 ($MILLION)
  • TABLE 67. JAPAN SURFACE COMBATANT, BY PLATFORM, 2025-2033 ($MILLION)
  • TABLE 68. JAPAN SURFACE COMBATANT, BY SYSTEM, 2025-2033 ($MILLION)
  • TABLE 69. JAPAN SURFACE COMBATANT, BY APPLICATION, 2025-2033 ($MILLION)
  • TABLE 70. INDIA SURFACE COMBATANT, BY PLATFORM, 2025-2033 ($MILLION)
  • TABLE 71. INDIA SURFACE COMBATANT, BY SYSTEM, 2025-2033 ($MILLION)
  • TABLE 72. INDIA SURFACE COMBATANT, BY APPLICATION, 2025-2033 ($MILLION)
  • TABLE 73. SOUTH KOREA SURFACE COMBATANT, BY PLATFORM, 2025-2033 ($MILLION)
  • TABLE 74. SOUTH KOREA SURFACE COMBATANT, BY SYSTEM, 2025-2033 ($MILLION)
  • TABLE 75. SOUTH KOREA SURFACE COMBATANT, BY APPLICATION, 2025-2033 ($MILLION)
  • TABLE 76. AUSTRALIA SURFACE COMBATANT, BY PLATFORM, 2025-2033 ($MILLION)
  • TABLE 77. AUSTRALIA SURFACE COMBATANT, BY SYSTEM, 2025-2033 ($MILLION)
  • TABLE 78. AUSTRALIA SURFACE COMBATANT, BY APPLICATION, 2025-2033 ($MILLION)
  • TABLE 79. THAILAND SURFACE COMBATANT, BY PLATFORM, 2025-2033 ($MILLION)
  • TABLE 80. THAILAND SURFACE COMBATANT, BY SYSTEM, 2025-2033 ($MILLION)
  • TABLE 81. THAILAND SURFACE COMBATANT, BY APPLICATION, 2025-2033 ($MILLION)
  • TABLE 82. MALAYSIA SURFACE COMBATANT, BY PLATFORM, 2025-2033 ($MILLION)
  • TABLE 83. MALAYSIA SURFACE COMBATANT, BY SYSTEM, 2025-2033 ($MILLION)
  • TABLE 84. MALAYSIA SURFACE COMBATANT, BY APPLICATION, 2025-2033 ($MILLION)
  • TABLE 85. INDONESIA SURFACE COMBATANT, BY PLATFORM, 2025-2033 ($MILLION)
  • TABLE 86. INDONESIA SURFACE COMBATANT, BY SYSTEM, 2025-2033 ($MILLION)
  • TABLE 87. INDONESIA SURFACE COMBATANT, BY APPLICATION, 2025-2033 ($MILLION)
  • TABLE 88. REST OF ASIA PACIFIC SURFACE COMBATANT, BY PLATFORM, 2025-2033 ($MILLION)
  • TABLE 89. REST OF ASIA PACIFIC SURFACE COMBATANT, BY SYSTEM, 2025-2033 ($MILLION)
  • TABLE 90. REST OF ASIA PACIFIC SURFACE COMBATANT, BY APPLICATION, 2025-2033 ($MILLION)
  • TABLE 91. LAMEA SURFACE COMBATANT, BY REGION, 2025-2033 ($MILLION)
  • TABLE 92. LAMEA SURFACE COMBATANT, BY PLATFORM, 2025-2033 ($MILLION)
  • TABLE 93. LAMEA SURFACE COMBATANT, BY SYSTEM, 2025-2033 ($MILLION)
  • TABLE 94. LAMEA SURFACE COMBATANT, BY APPLICATION, 2025-2033 ($MILLION)
  • TABLE 95. BRAZIL SURFACE COMBATANT, BY PLATFORM, 2025-2033 ($MILLION)
  • TABLE 96. BRAZIL SURFACE COMBATANT, BY SYSTEM, 2025-2033 ($MILLION)
  • TABLE 97. BRAZIL SURFACE COMBATANT, BY APPLICATION, 2025-2033 ($MILLION)
  • TABLE 98. SOUTH AFRICA SURFACE COMBATANT, BY PLATFORM, 2025-2033 ($MILLION)
  • TABLE 99. SOUTH AFRICA SURFACE COMBATANT, BY SYSTEM, 2025-2033 ($MILLION)
  • TABLE 100. SOUTH AFRICA SURFACE COMBATANT, BY APPLICATION, 2025-2033 ($MILLION)
  • TABLE 101. SAUDI ARABIA SURFACE COMBATANT, BY PLATFORM, 2025-2033 ($MILLION)
  • TABLE 102. SAUDI ARABIA SURFACE COMBATANT, BY SYSTEM, 2025-2033 ($MILLION)
  • TABLE 103. SAUDI ARABIA SURFACE COMBATANT, BY APPLICATION, 2025-2033 ($MILLION)
  • TABLE 104. UAE SURFACE COMBATANT, BY PLATFORM, 2025-2033 ($MILLION)
  • TABLE 105. UAE SURFACE COMBATANT, BY SYSTEM, 2025-2033 ($MILLION)
  • TABLE 106. UAE SURFACE COMBATANT, BY APPLICATION, 2025-2033 ($MILLION)
  • TABLE 107. ARGENTINA SURFACE COMBATANT, BY PLATFORM, 2025-2033 ($MILLION)
  • TABLE 108. ARGENTINA SURFACE COMBATANT, BY SYSTEM, 2025-2033 ($MILLION)
  • TABLE 109. ARGENTINA SURFACE COMBATANT, BY APPLICATION, 2025-2033 ($MILLION)
  • TABLE 110. REST OF LAMEA SURFACE COMBATANT, BY PLATFORM, 2025-2033 ($MILLION)
  • TABLE 111. REST OF LAMEA SURFACE COMBATANT, BY SYSTEM, 2025-2033 ($MILLION)
  • TABLE 112. REST OF LAMEA SURFACE COMBATANT, BY APPLICATION, 2025-2033 ($MILLION)
  • TABLE 113. ABU DHABI SHIP BUILDING: KEY EXECUTIVES
  • TABLE 114. ABU DHABI SHIP BUILDING: COMPANY SNAPSHOT
  • TABLE 115. ABU DHABI SHIP BUILDING: OPERATING SEGMENTS
  • TABLE 116. ABU DHABI SHIP BUILDING: PRODUCT PORTFOLIO
  • TABLE 117. ABU DHABI SHIP BUILDING: KEY STRATEGIC MOVES AND DEVELOPMENTS
  • TABLE 118. ASC PTY LTD: KEY EXECUTIVES
  • TABLE 119. ASC PTY LTD: COMPANY SNAPSHOT
  • TABLE 120. ASC PTY LTD: OPERATING SEGMENTS
  • TABLE 121. ASC PTY LTD: PRODUCT PORTFOLIO
  • TABLE 122. ASC PTY LTD: KEY STRATEGIC MOVES AND DEVELOPMENTS
  • TABLE 123. AUSTAL LIMITED: KEY EXECUTIVES
  • TABLE 124. AUSTAL LIMITED: COMPANY SNAPSHOT
  • TABLE 125. AUSTAL LIMITED: OPERATING SEGMENTS
  • TABLE 126. AUSTAL LIMITED: PRODUCT PORTFOLIO
  • TABLE 127. AUSTAL LIMITED: KEY STRATEGIC MOVES AND DEVELOPMENTS
  • TABLE 128. BAE SYSTEMS: KEY EXECUTIVES
  • TABLE 129. BAE SYSTEMS: COMPANY SNAPSHOT
  • TABLE 130. BAE SYSTEMS: OPERATING SEGMENTS
  • TABLE 131. BAE SYSTEMS: PRODUCT PORTFOLIO
  • TABLE 132. BAE SYSTEMS: KEY STRATEGIC MOVES AND DEVELOPMENTS
  • TABLE 133. DAMEN SHIPYARDS GROUP: KEY EXECUTIVES
  • TABLE 134. DAMEN SHIPYARDS GROUP: COMPANY SNAPSHOT
  • TABLE 135. DAMEN SHIPYARDS GROUP: OPERATING SEGMENTS
  • TABLE 136. DAMEN SHIPYARDS GROUP: PRODUCT PORTFOLIO
  • TABLE 137. DAMEN SHIPYARDS GROUP: KEY STRATEGIC MOVES AND DEVELOPMENTS
  • TABLE 138. X`GENERAL DYNAMICS CORPORATION: KEY EXECUTIVES
  • TABLE 139. X`GENERAL DYNAMICS CORPORATION: COMPANY SNAPSHOT
  • TABLE 140. X`GENERAL DYNAMICS CORPORATION: OPERATING SEGMENTS
  • TABLE 141. X`GENERAL DYNAMICS CORPORATION: PRODUCT PORTFOLIO
  • TABLE 142. X`GENERAL DYNAMICS CORPORATION: KEY STRATEGIC MOVES AND DEVELOPMENTS
  • TABLE 143. HUNTINGTON INGALLS INDUSTRIES: KEY EXECUTIVES
  • TABLE 144. HUNTINGTON INGALLS INDUSTRIES: COMPANY SNAPSHOT
  • TABLE 145. HUNTINGTON INGALLS INDUSTRIES: OPERATING SEGMENTS
  • TABLE 146. HUNTINGTON INGALLS INDUSTRIES: PRODUCT PORTFOLIO
  • TABLE 147. HUNTINGTON INGALLS INDUSTRIES: KEY STRATEGIC MOVES AND DEVELOPMENTS
  • TABLE 148. GENERAL DYNAMICS CORP: KEY EXECUTIVES
  • TABLE 149. GENERAL DYNAMICS CORP: COMPANY SNAPSHOT
  • TABLE 150. GENERAL DYNAMICS CORP: OPERATING SEGMENTS
  • TABLE 151. GENERAL DYNAMICS CORP: PRODUCT PORTFOLIO
  • TABLE 152. GENERAL DYNAMICS CORP: KEY STRATEGIC MOVES AND DEVELOPMENTS
  • TABLE 153. NAVAL GROUP: KEY EXECUTIVES
  • TABLE 154. NAVAL GROUP: COMPANY SNAPSHOT
  • TABLE 155. NAVAL GROUP: OPERATING SEGMENTS
  • TABLE 156. NAVAL GROUP: PRODUCT PORTFOLIO
  • TABLE 157. NAVAL GROUP: KEY STRATEGIC MOVES AND DEVELOPMENTS
  • LIST OF FIGURES

  • FIGURE 1. GLOBAL SURFACE COMBATANT MARKET SEGMENTATION
  • FIGURE 2. GLOBAL SURFACE COMBATANT MARKET
  • FIGURE 3. SEGMENTATION SURFACE COMBATANT MARKET
  • FIGURE 4. TOP INVESTMENT POCKET IN SURFACE COMBATANT MARKET
  • FIGURE 5. MODERATE BARGAINING POWER OF BUYERS
  • FIGURE 6. MODERATE BARGAINING POWER OF SUPPLIERS
  • FIGURE 7. MODERATE THREAT OF NEW ENTRANTS
  • FIGURE 8. LOW THREAT OF SUBSTITUTION
  • FIGURE 9. HIGH COMPETITIVE RIVALRY
  • FIGURE 10. OPPORTUNITIES, RESTRAINTS AND DRIVERS: GLOBALSURFACE COMBATANT MARKET
  • FIGURE 11. SURFACE COMBATANT MARKET SEGMENTATION, BY BY PLATFORM
  • FIGURE 12. SURFACE COMBATANT MARKET FOR AIRCRAFT CARRIERS, BY COUNTRY, 2025-2033 ($MILLION)
  • FIGURE 13. SURFACE COMBATANT MARKET FOR DESTROYERS, BY COUNTRY, 2025-2033 ($MILLION)
  • FIGURE 14. SURFACE COMBATANT MARKET FOR CORVETTES, BY COUNTRY, 2025-2033 ($MILLION)
  • FIGURE 15. SURFACE COMBATANT MARKET FOR AMPHIBIOUS SHIPS, BY COUNTRY, 2025-2033 ($MILLION)
  • FIGURE 16. SURFACE COMBATANT MARKET FOR FRIGATES, BY COUNTRY, 2025-2033 ($MILLION)
  • FIGURE 17. SURFACE COMBATANT MARKET FOR AUXILIARY VESSELS, BY COUNTRY, 2025-2033 ($MILLION)
  • FIGURE 18. SURFACE COMBATANT MARKET SEGMENTATION, BY BY SYSTEM
  • FIGURE 19. SURFACE COMBATANT MARKET FOR MARINE ENGINE SYSTEM, BY COUNTRY, 2025-2033 ($MILLION)
  • FIGURE 20. SURFACE COMBATANT MARKET FOR WEAPON LAUNCH SYSTEM, BY COUNTRY, 2025-2033 ($MILLION)
  • FIGURE 21. SURFACE COMBATANT MARKET FOR CONTROL SYSTEM, BY COUNTRY, 2025-2033 ($MILLION)
  • FIGURE 22. SURFACE COMBATANT MARKET FOR ELECTRICAL SYSTEM, BY COUNTRY, 2025-2033 ($MILLION)
  • FIGURE 23. SURFACE COMBATANT MARKET FOR COMMUNICATION SYSTEM, BY COUNTRY, 2025-2033 ($MILLION)
  • FIGURE 24. SURFACE COMBATANT MARKET FOR OTHERS, BY COUNTRY, 2025-2033 ($MILLION)
  • FIGURE 25. SURFACE COMBATANT MARKET SEGMENTATION, BY BY APPLICATION
  • FIGURE 26. SURFACE COMBATANT MARKET FOR SEARCH AND RESCUE, BY COUNTRY, 2025-2033 ($MILLION)
  • FIGURE 27. SURFACE COMBATANT MARKET FOR COMBAT OPERATIONS, BY COUNTRY, 2025-2033 ($MILLION)
  • FIGURE 28. SURFACE COMBATANT MARKET FOR MCM OPERATIONS, BY COUNTRY, 2025-2033 ($MILLION)
  • FIGURE 29. SURFACE COMBATANT MARKET FOR COASTAL SURVEILLANCE, BY COUNTRY, 2025-2033 ($MILLION)
  • FIGURE 30. SURFACE COMBATANT MARKET FOR OTHERS, BY COUNTRY, 2025-2033 ($MILLION)
  • FIGURE 31. TOP WINNING STRATEGIES, BY YEAR, 2022-2024*
  • FIGURE 32. TOP WINNING STRATEGIES, BY DEVELOPMENT, 2022-2024*
  • FIGURE 33. TOP WINNING STRATEGIES, BY COMPANY, 2022-2024*
  • FIGURE 34. PRODUCT MAPPING OF TOP 10 PLAYERS
  • FIGURE 35. COMPETITIVE DASHBOARD
  • FIGURE 36. COMPETITIVE HEATMAP: SURFACE COMBATANT MARKET
  • FIGURE 37. TOP PLAYER POSITIONING, 2024
  • FIGURE 38. ABU DHABI SHIP BUILDING: NET SALES, 2022-2024 ($MILLION)
  • FIGURE 39. ABU DHABI SHIP BUILDING: REVENUE SHARE, BY SEGMENT, 2024 (%)
  • FIGURE 40. ABU DHABI SHIP BUILDING: REVENUE SHARE, BY REGION, 2024 (%)
  • FIGURE 41. ASC PTY LTD: NET SALES, 2022-2024 ($MILLION)
  • FIGURE 42. ASC PTY LTD: REVENUE SHARE, BY SEGMENT, 2024 (%)
  • FIGURE 43. ASC PTY LTD: REVENUE SHARE, BY REGION, 2024 (%)
  • FIGURE 44. AUSTAL LIMITED: NET SALES, 2022-2024 ($MILLION)
  • FIGURE 45. AUSTAL LIMITED: REVENUE SHARE, BY SEGMENT, 2024 (%)
  • FIGURE 46. AUSTAL LIMITED: REVENUE SHARE, BY REGION, 2024 (%)
  • FIGURE 47. BAE SYSTEMS: NET SALES, 2022-2024 ($MILLION)
  • FIGURE 48. BAE SYSTEMS: REVENUE SHARE, BY SEGMENT, 2024 (%)
  • FIGURE 49. BAE SYSTEMS: REVENUE SHARE, BY REGION, 2024 (%)
  • FIGURE 50. DAMEN SHIPYARDS GROUP: NET SALES, 2022-2024 ($MILLION)
  • FIGURE 51. DAMEN SHIPYARDS GROUP: REVENUE SHARE, BY SEGMENT, 2024 (%)
  • FIGURE 52. DAMEN SHIPYARDS GROUP: REVENUE SHARE, BY REGION, 2024 (%)
  • FIGURE 53. X`GENERAL DYNAMICS CORPORATION: NET SALES, 2022-2024 ($MILLION)
  • FIGURE 54. X`GENERAL DYNAMICS CORPORATION: REVENUE SHARE, BY SEGMENT, 2024 (%)
  • FIGURE 55. X`GENERAL DYNAMICS CORPORATION: REVENUE SHARE, BY REGION, 2024 (%)
  • FIGURE 56. HUNTINGTON INGALLS INDUSTRIES: NET SALES, 2022-2024 ($MILLION)
  • FIGURE 57. HUNTINGTON INGALLS INDUSTRIES: REVENUE SHARE, BY SEGMENT, 2024 (%)
  • FIGURE 58. HUNTINGTON INGALLS INDUSTRIES: REVENUE SHARE, BY REGION, 2024 (%)
  • FIGURE 59. GENERAL DYNAMICS CORP: NET SALES, 2022-2024 ($MILLION)
  • FIGURE 60. GENERAL DYNAMICS CORP: REVENUE SHARE, BY SEGMENT, 2024 (%)
  • FIGURE 61. GENERAL DYNAMICS CORP: REVENUE SHARE, BY REGION, 2024 (%)
  • FIGURE 62. NAVAL GROUP: NET SALES, 2022-2024 ($MILLION)
  • FIGURE 63. NAVAL GROUP: REVENUE SHARE, BY SEGMENT, 2024 (%)
  • FIGURE 64. NAVAL GROUP: REVENUE SHARE, BY REGION, 2024 (%)

Purchase Full Report of
Surface Combatant Market

PURCHASE OPTIONS


* Taxes/Fees, If applicable will be added during checkout. All prices in USD.

Have a question ?

Need to add more ?

Avail up to 30% discount on subscription plans on


Avenue