Int'l : +1-503-894-6022 | Toll Free : +1-800-792-5285 | help@alliedmarketresearch.com
A06612 | Pages: 142 | Charts: 42 | Tables: 79 |
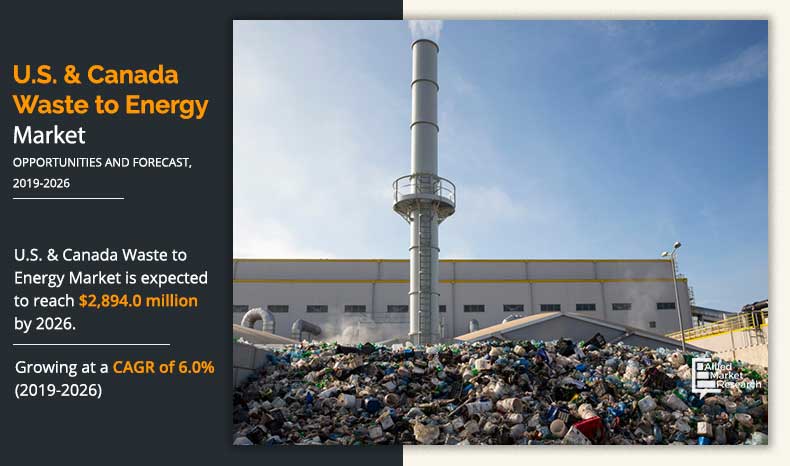
The U.S. and Canada waste-to-energy (WtE) market was valued at $1,811.0 million in 2018, and is projected to reach $2,894.0 million by 2026, growing at a CAGR of 6.0% from 2019 to 2026.Waste-to-energy is the process of energy generation by the primary treatment of waste. This process produces electricity or heat directly by combustion. In addition, it produces combustible fuel commodities such as methanol, methane, synthetic fuels, or ethanol.
Increase in demand for renewable sources of energy drives the growth of the U.S. & Canada waste-to-energy market. In addition, rise in demand for electricity consumption fuels the growth of the market during the forecast period. However, high initial cost associated with waste-to-energy plant installation is the key factor that is expected to hamper the growth of the market during the forecast period. Moreover, increase in waste generation and government initiatives to promote relevant utilization of waste in the U.S. and Canada is anticipated to offer growth opportunities for the market growth.
Get more information on this report : Request Sample Pages
The U.S. & Canada waste-to-energy market is segmented on the basis of type of technology and U.S. & Canada region. On the basis of type of technology, the market is divided into thermal, biochemical, and others. The thermal segment is further categorized into incineration, pyrolysis, and gasification. The incineration segment is anticipated to register a significant CAGR during the forecast period. Country wise, the market is analyzed across the U.S. & Canada.
The U.S. & Canada waste-to-energy market analysis covers in-depth information of the major industry participants. Some of the major players in the waste-to-energy market include John Wood Group PLC, Babcock & Wilcox Enterprises, Inc., Covanta Holding Corporation, Waste Management, Inc., Mitsubishi Heavy Industries, Plasco Energy Group, Inc., Xcel Energy, Inc., Wheelabrator Technologies Inc., BlueFire Renewables, and Ener-Core, Inc.
Other players operating in the value chain of the U.S. & Canada waste-to-energy market are Global Clean Energy, Inc., Natural Energy Systems, Inc., Greenlight Energy Solutions, International Composting Corporation, and WaterSmart Environmental, Inc.
Key players are adopting numerous strategies such as partnership, agreement, acquisition, and business expansion to stay competitive in the U.S. & Canada waste-to-energy market.
For instance, B&W Volund A/S a subsidiary of the B&W turned over a biomass-to-energy plant in Margam, Wales, to Margam Green Energy Ltd. This expansion is designed to burn waste wood to generate approximately 40 megawatts of electricity and features Vølund’s patented DynaGrate® technology.
Moreover, in January 2018, Covanta partnered with Lancaster County Solid Waste Management Authority (LCSWMA), based in Lancaster, PA. The aim of the partnership was the operation and maintenance of LCSWMA’s two energy-from-waste facilities, the Lancaster Waste-to-Energy (WTE) facility, located in Bainbridge, PA, and the Susquehanna Resource Management Complex (SRMC), located in Harrisburg, PA.
[TECHNOLOGYGRAPH]
Get more information on this report : Request Sample Pages
By type of technology, the thermal technology segment accounted for the highest market share in 2018, owing to increase in the demand for thermal gasification in energy generation for waste materials due to rise in demand for clean energy across the countries. In addition, unavailability of landfills is expected to drive the growth of the U.S. & Canada waste-to-energy market during the forecast period
[COUNTRYGRAPH]
Get more information on this report : Request Sample Pages
By country, the U.S. dominated the highest market share in the year 2018. This is owing to rise in energy prices coupled with increase in consumer focus to use the generated energy efficiently. In addition, increase in stress on energy conservation in the highly waste generating areas in the U.S. is expected to exhibit growth of the waste-to-energy market.
This report highlights the factors that influence the waste-to-energy market growth, such as forecast, trends, drivers, restraints, opportunities, and roles of different key players that shape the market growth. Moreover, it focuses on the overall demand for waste-to-energy across various countries and different applications, presenting data in terms of both value and volume. The revenue is calculated by proliferating the volume by country-specific prices and considering the country-wise differentiated prices.
COVID-19 pandemic affected most of the industries including automotive, construction, processing and others. This has affected waste generation from this industries which in turn affecting the waste to energy market in the U.S. and Canada region. This affect will remain for upcoming one or two years. Governments put lockdown across the globe which is further resulted in the slowing down of transport, trade and economic activity. Owing to the lockdown in these countries, there is rise in waste generation in municipal area and also generation of waste from hospital is on the verge of increasing further stabilizing the growth of the market in the ongoing year.
Key Benefits For Stakeholders
Key Market Segments
Key Market Players
CHAPTER 1:INTRODUCTION
1.1.Report description
1.2.Key benefits for stakeholders
1.3.Key market segments
1.4.Research methodology
1.4.1.Secondary research
1.4.2.Primary research
1.4.3.Analyst tools and models
CHAPTER 2:EXECUTIVE SUMMARY
2.1.CXO perspective
CHAPTER 3:MARKET OVERVIEW
3.1.Market definition and scope
3.2.Key findings
3.2.1.Top investment pockets
3.2.2.Top winning strategies
3.3.Porter’s five forces analysis
3.4.Top player positioning, 2018
3.5.Pricing analysis and forecast, 2018-2026
3.5.1.Pricing Analysis of U.S. and Canada Waste-to-energy Market, 2018 to 2026
3.6.Value chain analysis
3.7.Impact of government regulations on the market
3.8.Waste-to-energy as a share of U.S. & Canada electricity production, 2018
3.8.1.U.S.
3.8.2.Canada
3.9.Patent analysis
3.9.1.By Country (2012-2019)
3.10.Market dynamics
3.10.1.Drivers
3.10.1.1.Increase in demand for renewable sources of energy
3.10.1.2.Rise in demand for electricity consumption
3.10.2.Restraints
3.10.2.1.High initial costs
3.10.2.2.Less investments
3.10.3.Opportunity
3.10.3.1.Potential growth opportunities from government regulations
CHAPTER 4:U.S. & CANADA WASTE-TO-ENERGY MARKET, BY TECHNOLOGY
4.1.Overview
4.1.1.Market size and forecast
4.2.Thermal
4.2.1.Key market trends, growth factors, and opportunities
4.2.2.Market size and forecast, by thermal technology type
4.2.3.Market analysis, by country
4.2.4.Incineration
4.2.5.Pyrolysis
4.2.6.Gasification
4.3.Biochemical
4.3.1.Key market trends, growth factors, and opportunities
4.3.2.Market size and forecast
4.3.3.Market analysis, by country
4.4.Others
4.4.1.Key market trends, growth factors, and opportunities
4.4.2.Market size and forecast
4.4.3.Market analysis, by country
CHAPTER 5:WASTE-TO-ENERGY MARKET, COUNTRY
5.1.Overview
5.1.1.Market size and forecast
5.2.U.S.
5.2.1.Key market trends, growth factors, and opportunities
5.2.2.Market size and forecast, by technology
5.2.3.Market size and forecast, by thermal technology type
5.2.4.Market size and forecast, by biochemical technology
5.2.5.Market size and forecast, by other technology
5.3.Canada
5.3.1.Key market trends, growth factors, and opportunities
5.3.2.Market size and forecast, by technology
5.3.3.Market size and forecast, by thermal technology type
5.3.4.Market size and forecast, by biochemical technology
5.3.5.Market size and forecast, by other technology
CHAPTER 6:COMPETITIVE LANDSCAPE
6.1.Introduction
6.2.Competitive dashboard
6.3.Competitive heatmap
6.4.Key developments
6.4.1.Partnerships
6.4.2.Expansions
6.4.3.Acquisition
6.4.4.Agreements
CHAPTER 7:COMPANY PROFILES:
7.1.BABCOCK & WILCOX ENTERPRISES, INC.
7.1.1.Company overview
7.1.2.Company snapshot
7.1.3.Operating business segments
7.1.4.Product portfolio
7.1.5.Business performance
7.1.6.Key strategic moves and developments
7.2.BLUEFIRE RENEWABLES
7.2.1.Company overview
7.2.2.Company snapshot
7.2.3.Product portfolio
7.3.COVANTA HOLDING CORPORATION
7.3.1.Company overview
7.3.2.Company snapshot
7.3.3.Operating business segments
7.3.4.Product portfolio
7.3.5.Business performance
7.3.6.Key strategic moves and developments
7.4.ENER-CORE, INC.
7.4.1.Company overview
7.4.2.Company snapshot
7.4.3.Product portfolio
7.4.4.Key strategic moves and developments
7.5.JOHN WOOD GROUP PLC
7.5.1.Company overview
7.5.2.Company snapshot
7.5.3.Operating business segments
7.5.4.Product portfolio
7.5.5.Business performance
7.5.6.Key strategic moves and developments
7.6.MITSUBISHI HEAVY INDUSTRIES
7.6.1.Company overview
7.6.2.Company snapshot
7.6.3.Operating business segments
7.6.4.Product portfolio
7.6.5.Business performance
7.7.PLASCO ENERGY GROUP, INC.
7.7.1.Company overview
7.7.2.Company snapshot
7.7.3.Product portfolio
7.8.WASTE MANAGEMENT, INC.
7.8.1.Company overview
7.8.2.Company snapshot
7.8.3.Operating business segments
7.8.4.Product portfolio
7.8.5.Business performance
7.9.WHEELABRATOR TECHNOLOGIES INC.
7.9.1.Company overview
7.9.2.Company snapshot
7.9.3.Product portfolio
7.10.XCEL ENERGY, INC.
7.10.1.Company overview
7.10.2.Company snapshot
7.10.3.Operating business segments
7.10.4.Product portfolio
7.10.5.Business performance
LIST OF TABLES
TABLE 01.U.S. & CANADA WASTE-TO-ENERGY MARKET, BY TECHNOLOGY, 2018-2026, MILLION TONS
TABLE 02.U.S. & CANADA WASTE-TO-ENERGY MARKET, BY TECHNOLOGY, 2018-2026, GWH
TABLE 03.U.S. & CANADA WASTE-TO-ENERGY MARKET, BY TECHNOLOGY, 2018-2026, $MILLION
TABLE 04.U.S. & CANADA THERMAL WASTE-TO-ENERGY MARKET, BY TYPE, 2018 – 2026, MILLION TONS
TABLE 05.U.S. & CANADA THERMAL WASTE-TO-ENERGY MARKET, BY TYPE, 2018 – 2026, GWH
TABLE 06.U.S. & CANADA THERMAL WASTE-TO-ENERGY MARKET, BY TYPE, 2018 – 2026, $MILLION
TABLE 07.U.S. & CANADA BIOCHEMICAL WASTE-TO-ENERGY MARKET, 2018 – 2026, MILLION TONS
TABLE 08.U.S. & CANADA BIOCHEMICAL WASTE-TO-ENERGY MARKET, 2018 – 2026, GWH
TABLE 09.U.S. & CANADA BIOCHEMICAL WASTE-TO-ENERGY MARKET, 2018 – 2026, $MILLION
TABLE 10.U.S. & CANADA OTHERS WASTE-TO-ENERGY MARKET, 2018 – 2026, MILLION TONS
TABLE 11.U.S. & CANADA OTHERS WASTE-TO-ENERGY MARKET, 2018 – 2026, GWH
TABLE 12.U.S. & CANADA OTHERS WASTE-TO-ENERGY MARKET, 2018 – 2026, $MILLION
TABLE 13.U.S. & CANADA WASTE-TO-ENERGY MARKET, BY COUNTRY, 2018-2026, (MILLION TONS)
TABLE 14.U.S. & CANADA WASTE-TO-ENERGY MARKET, BY COUNTRY, 2018-2026, (GWH)
TABLE 15.U.S. & CANADA WASTE-TO-ENERGY MARKET, BY COUNTRY, 2018-2026, ($MILLION)
TABLE 16.U.S. WASTE-TO-ENERGY MARKET, BY TECHNOLOGY, 2018-2026, (MILLION TONS)
TABLE 17.U.S. WASTE-TO-ENERGY MARKET, BY TECHNOLOGY, 2018-2026, (GWH)
TABLE 18.U.S. WASTE-TO-ENERGY MARKET, BY TECHNOLOGY, 2018-2026, ($MILLION)
TABLE 19.U.S. THERMAL WASTE-TO-ENERGY MARKET, BY TYPE, 2018-2026, (MILLION TONS)
TABLE 20.U.S. THERMAL WASTE-TO-ENERGY MARKET, BY TYPE, 2018-2026, (GWH)
TABLE 21.U.S. THERMAL WASTE-TO-ENERGY MARKET, BY TYPE, 2018-2026, ($MILLION)
TABLE 22.U.S. BIOCHEMICAL WASTE-TO-ENERGY MARKET, 2018-2026, (MILLION TONS)
TABLE 23.U.S. BIOCHEMICAL WASTE-TO-ENERGY MARKET, 2018-2026, (GWH)
TABLE 24.U.S. BIOCHEMICAL WASTE-TO-ENERGY MARKET, 2018-2026, ($MILLION)
TABLE 25.U.S. OTHERS WASTE-TO-ENERGY MARKET, 2018-2026, (MILLION TONS)
TABLE 26.U.S. OTHERS WASTE-TO-ENERGY MARKET, 2018-2026, (GWH)
TABLE 27.U.S. OTHERS WASTE-TO-ENERGY MARKET, 2018-2026, ($MILLION)
TABLE 28.CANADA WASTE-TO-ENERGY MARKET, BY TECHNOLOGY, 2018-2026, (MILLION TONS)
TABLE 29.CANADA WASTE-TO-ENERGY MARKET, BY TECHNOLOGY, 2018-2026, (GWH)
TABLE 30.CANADA WASTE-TO-ENERGY MARKET, BY TECHNOLOGY, 2018-2026, ($MILLION)
TABLE 31.CANADA THERMAL WASTE-TO-ENERGY MARKET, BY TYPE, 2018-2026, (MILLION TONS)
TABLE 32.CANADA THERMAL WASTE-TO-ENERGY MARKET, BY TYPE, 2018-2026, (GWH)
TABLE 33.CANADA THERMAL WASTE-TO-ENERGY MARKET, BY TECHNOLOGY, 2018-2026, ($MILLION)
TABLE 34.CANADA BIOCHEMICAL WASTE-TO-ENERGY MARKET, BY TYPE, 2018-2026, (MILLION TONS)
TABLE 35.CANADA BIOCHEMICAL WASTE-TO-ENERGY MARKET, BY TYPE, 2018-2026, (GWH)
TABLE 36.CANADA BIOCHEMICAL WASTE-TO-ENERGY MARKET, BY TECHNOLOGY, 2018-2026, ($MILLION)
TABLE 37.CANADA OTHERS WASTE-TO-ENERGY MARKET, BY TYPE, 2018-2026, (MILLION TONS)
TABLE 38.CANADA OTHERS WASTE-TO-ENERGY MARKET, BY TYPE, 2018-2026, (GWH)
TABLE 39.CANADA OTHERS WASTE-TO-ENERGY MARKET, BY TECHNOLOGY, 2018-2026, ($MILLION)
TABLE 40.KEY PARTNERSHIP (2016-2019)
TABLE 41.KEY EXPANSIONS (2016-2019)
TABLE 42.KEY ACQUISITION (2016-2019)
TABLE 43.KEY AGREEMENTS (2016-2019)
TABLE 44.B & W: COMPANY SNAPSHOT
TABLE 45.B & W: OPERATING SEGMENTS
TABLE 46.B & W: PRODUCT PORTFOLIO
TABLE 47.OVERALL FINANCIAL STATUS ($MILLION)
TABLE 48.B & W: KEY STRATEGIC MOVES AND DEVELOPMENTS
TABLE 49.BLUEFIRE: COMPANY SNAPSHOT
TABLE 50.BLUEFIRE: PRODUCT PORTFOLIO
TABLE 51.COVANTA: COMPANY SNAPSHOT
TABLE 52.COVANTA: OPERATING SEGMENTS
TABLE 53.COVANTA: PRODUCT PORTFOLIO
TABLE 54.OVERALL FINANCIAL STATUS ($MILLION)
TABLE 55.COVANTA: KEY STRATEGIC MOVES AND DEVELOPMENTS
TABLE 56.ENER-CORE: COMPANY SNAPSHOT
TABLE 57.ENER-CORE: PRODUCT PORTFOLIO
TABLE 58.ENER-CORE: KEY STRATEGIC MOVES AND DEVELOPMENTS
TABLE 59.WOOD GROUP: COMPANY SNAPSHOT
TABLE 60.WOOD GROUP: OPERATING SEGMENTS
TABLE 61.WOOD GROUP: PRODUCT PORTFOLIO
TABLE 62.OVERALL FINANCIAL STATUS ($MILLION)
TABLE 63.WOOD GROUP: KEY STRATEGIC MOVES AND DEVELOPMENTS
TABLE 64.MITSUBISHI: COMPANY SNAPSHOT
TABLE 65.MITSUBISHI: OPERATING SEGMENTS
TABLE 66.MITSUBISHI: PRODUCT PORTFOLIO
TABLE 67.OVERALL FINANCIAL STATUS ($MILLION)
TABLE 68.PLASCO: COMPANY SNAPSHOT
TABLE 69.PLASCO: PRODUCT PORTFOLIO
TABLE 70.WM: COMPANY SNAPSHOT
TABLE 71.WM: OPERATING SEGMENTS
TABLE 72.WM: PRODUCT PORTFOLIO
TABLE 73.OVERALL FINANCIAL STATUS ($MILLION)
TABLE 74.WHEELABRATOR: COMPANY SNAPSHOT132
TABLE 75.WHEELABRATOR: PRODUCT PORTFOLIO132
TABLE 76.XCEL ENERGY: COMPANY SNAPSHOT
TABLE 77.XCEL ENERGY: OPERATING SEGMENTS
TABLE 78.XCEL ENERGY
TABLE 79.OVERALL FINANCIAL STATUS ($MILLION)
LIST OF FIGURES
FIGURE 01.U.S. AND CANADA WASTE-TO-ENERGY MARKET SEGMENTATION
FIGURE 02.TOP INVESTMENT POCKETS, BY TYPE OF TECHNOLOGY
FIGURE 03.TOP WINNING STRATEGIES, BY YEAR, 2016–2018
FIGURE 04.TOP WINNING STRATEGIES, BY DEVELOPMENT, 2016–2018 (%)
FIGURE 05.TOP WINNING STRATEGIES, BY COMPANY, 2016–2018
FIGURE 06.HIGH BARGAINING POWER OF SUPPLIERS
FIGURE 07.LOW BARGAINING POWER OF BUYERS
FIGURE 08.MODERATE THREAT OF NEW ENTRANTS
FIGURE 09.LOW THREAT OF SUBSTITUTES
FIGURE 10.MODERATE INTENSITY OF COMPETITIVE RIVALRY
FIGURE 11.TOP PLAYER POSITIONNG, 2018
FIGURE 12.U.S. WASTE-TO-ENERGY AS A SHARE OF ELECTRICITY PRODUCTION, 2018 (%)
FIGURE 13.CANADA WASTE-TO-ENERGY AS A SHARE OF ELECTRICITY PRODUCTION, 2018 (%)
FIGURE 14.PATENT ANALYSIS, BY COUNTRY
FIGURE 15.WASTE-TO-ENERGY MARKET DYNAMICS
FIGURE 16.FACTS AT A GLANCE
FIGURE 17.U.S. AND CANADA ELECTRICITY GENERATION 2015- 2018
FIGURE 18.TOTAL OVERNIGHT COST OF NEW ELECTRICITY GENERATING TECHNOLOGIES, (2016 $/KW)
FIGURE 19.COMPARATIVE ANALYSIS OF U.S. & CANADA WASTE-TO-ENERGY MARKET, BY TECHNOLOGY, 2018 VS 2026
FIGURE 20.COMPARATIVE ANALYSIS OF THERMAL WASTE-TO-ENERGY MARKET, BY COUNTRY, 2018 VS 2026 ($MILLION)
FIGURE 21.COMPARATIVE ANALYSIS OF BIOCHEMICAL WASTE-TO-ENERGY MARKET, BY COUNTRY, 2018 VS 2026 ($MILLION)
FIGURE 22.COMPARATIVE ANALYSIS OF OTHERS WASTE-TO-ENERGY MARKET, BY COUNTRY, 2018 VS 2026 ($MILLION)
FIGURE 23.U.S. WASTE-TO-ENERGY MARKET REVENUE (2018-2026) ($MILLION)
FIGURE 24.CANADA WASTE-TO-ENERGY MARKET REVENUE (2018-2026) ($MILLION)
FIGURE 25.COMPETITIVE DASHBOARD OF OTHER KEY PLAYERS
FIGURE 26.COMPETITIVE HEATMAP OF KEY PLAYERS
FIGURE 27.B & W: REVENUE, 2016–2018 ($MILLION)
FIGURE 28.B & W: REVENUE SHARE BY SEGMENT, 2018 (%)
FIGURE 29.B & W: REVENUE SHARE BY REGION, 2018 (%)
FIGURE 30.COVANTA: NET SALES, 2016–2018 ($MILLION)
FIGURE 31.COVANTA: REVENUE SHARE BY SEGMENT, 2018 (%)
FIGURE 32.COVANTA: REVENUE SHARE BY REGION, 2018 (%)
FIGURE 33.WOOD GROUP: REVENUE, 2016–2018 ($MILLION)
FIGURE 34.WOOD GROUP: REVENUE SHARE BY SEGMENT, 2018 (%)
FIGURE 35.WOOD GROUP: REVENUE SHARE BY REGION, 2018 (%)
FIGURE 36.MITSUBISHI: REVENUE, 2016–2018 ($MILLION)
FIGURE 37.MITSUBISHI: REVENUE SHARE BY SEGMENT, 2018 (%)
FIGURE 38.WM: NET SALES, 2016–2018 ($MILLION)
FIGURE 39.WM: REVENUE SHARE BY SEGMENT, 2018 (%)
FIGURE 40.WM: REVENUE SHARE BY REGION, 2018 (%)
FIGURE 41.XCEL ENERGY: REVENUE, 2016–2018 ($MILLION)
FIGURE 42.XCEL ENERGY: REVENUE SHARE BY SEGMENT, 2018 (%)