
Biodigester Market Research, 2033
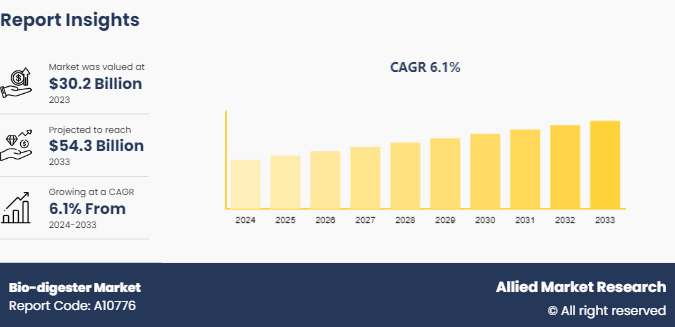
The global biodigester market size was valued at $30.2 billion in 2023, and is projected to reach $54.3 billion by 2033, growing at a CAGR of 6.1% from 2024 to 2033.
Market Introduction and Definition
A biodigester, also known as a biogas digester or anaerobic digester, is a system that processes organic waste material to produce biogas and biofertilizer through the process of anaerobic digestion. This technology is environmentally sustainable and economically beneficial, playing a crucial role in waste management, renewable energy production, and agricultural enhancement. Biodigesters vary in size and complexity, from small household units to large industrial plants, making them versatile tools applicable across various industries.
Biodigesters are integral to efficient waste management practices. By converting organic waste into biogas and biofertilizer, they reduce the volume of waste that ends up in landfills, thus mitigating greenhouse gas emissions from decomposing organic material. In urban settings, community-level biodigesters can manage food waste from markets and households, while industrial biodigesters handle waste from food processing units and agricultural operations. This not only addresses waste disposal challenges but also transforms waste into valuable resources.
The biogas produced by biodigesters is a significant source of renewable energy. Comprising primarily methane and carbon dioxide, biogas can be utilized for heating, electricity generation, and as a vehicle fuel after purification. In rural areas, small-scale biodigesters provide households with a reliable source of cooking gas, reducing dependence on traditional biomass fuels like wood and charcoal. On a larger scale, biogas plants can contribute to the energy grid, offering a sustainable alternative to fossil fuels and enhancing energy security.
Key Takeaways
- The bio-digester industry covers 20 countries. The research includes a segment analysis of each country in terms of value for the projected period bio-digester market statistics.
- The study integrated high-quality data, professional opinions and analysis, and critical independent perspectives. The research approach is intended to provide a balanced view of the global bio-digester market overview and to assist stakeholders in making educated decisions to achieve their growth objectives.
- Over 3, 700 product literature, annual reports, industry statements, and other comparable materials from major industry participants were reviewed to gain a better understanding of the bio-digester market report.
- The bio-digester market share is highly fragmented, with several players including EISENMANN GmbH, PlanET Biogas Group, BIOGEST, EnviTec Biogas AG, SEAB Power Ltd, Martin Energy Group, ATEC, Sistema.bio, Zero-D Industries Private Limited, and Anaergia. Also tracked key strategies such as acquisitions, product launches, mergers, and expansion of the players operating in the bio-digester market growth.
Market Segmentation
The bio-digester market is segmented into type feedstock, end-use, and region. On the basis of type, the market is divided into small-scale, medium-scale, and large-scale. On the basis of feedstock, the market is classified into agricultural waste, industrial waste, municipal waste, and others. Based on application, the market is divided into residential, commercial, industrial, and others. Region-wise, the market is analyzed across North America, Europe, Asia-Pacific, and LAMEA.
Key Market Dynamics
Growth in greenhouse gas emissions and promoting sustainable practices is expected to drive the growth of bio-digester market during the forecast period. Bio-digesters facilitate the anaerobic digestion of organic waste, such as agricultural residues, food waste, and animal manure, to produce biogas. Biogas is a renewable energy source primarily composed of methane (CH?) and carbon dioxide (CO?) , with methane being a potent GHG. By capturing methane from organic waste that would otherwise decompose in landfills or open environments, bio-digesters prevent its release into the atmosphere. Methane has a significantly higher global warming potential than CO? over a 20-year period, making its mitigation crucial for climate change mitigation efforts. As per the International Energy Agency, in 2022, global energy-related CO2 emissions rose by 0.9%, totaling 36.8 gigatons (Gt) . This marks a modest increase of 321 million tons (Mt) , contrasting sharply with the significant rebound of over 6% observed in 2021 following pandemic-related fluctuations. Emissions from energy combustion grew by 423 Mt, while those from industrial processes saw a decrease of 102 Mt. In addition to GHG mitigation, bio-digesters play a crucial role in promoting sustainable waste management practices. Organic waste is a significant contributor to landfill volumes and is responsible for producing methane emissions as it decomposes anaerobically. By diverting organic waste streams into bio-digesters, these systems not only reduce the environmental footprint of waste disposal but also generate valuable biogas and nutrient-rich digestate. The digestate can be used as an organic fertilizer, thereby closing the nutrient loop and supporting sustainable agricultural practices.
However, dependence on consistent and suitable organic feedstock is expected to restraint the growth of bio-digester market during the forecast period. Bio-digesters operate by anaerobically digesting organic materials such as agricultural residues, food waste, animal manure, and sewage sludge to produce biogas. The success and efficiency of bio-digesters depend on a steady supply of these feedstocks. In regions where organic waste generation is sporadic or seasonal, maintaining consistent operation of bio-digester facilities becomes challenging. This variability can lead to underutilization of installed capacity and affect the economic viability of bio-digester projects. There is often competition for organic waste resources between bio-digesters and other traditional waste management practices, such as landfill disposal or composting. Municipalities and industries may prioritize cheaper or more convenient disposal methods over investing in bio-digester infrastructure, especially if there are logistical challenges in collecting and transporting organic waste to bio-digester facilities. This competition can limit the availability of feedstock for bio-digesters, particularly in urban areas with high waste generation rates but limited space for bio-digester installations.
Furthermore, diverse utilization of biogas for electricity generation, heating, and vehicle fuel is expected to offer lucrative opportunities in the bio-digester market forecast. Biogas, a versatile renewable energy source produced through anaerobic digestion of organic materials, offers diverse applications that contribute to sustainable energy solutions and economic benefits. This methane-rich gas can be utilized in various sectors, including electricity generation, heating, and as a vehicle fuel, thereby creating multiple revenue streams and promoting energy. One of the primary applications of biogas is in electricity generation. Biogas can be used in combined heat and power (CHP) systems or dedicated biogas generators to produce electricity. CHP systems utilize the heat generated during electricity production, increasing overall efficiency. This dual-use capability makes biogas-powered CHP systems particularly attractive for facilities with high heat demand, such as wastewater treatment plants, farms, and food processing industries. By generating electricity from biogas, these facilities can reduce their reliance on grid electricity, lower operating costs, and mitigate greenhouse gas emissions. In May 2022, Enertech Fuel Solutions unveiled a bold $7.19 million investment initiative to venture into the compressed biogas (CBG) sector across India. The plan involves a phased approach, beginning with the establishment of four CBG plants in Gujarat, Uttar Pradesh, Punjab, and Haryana. Following this initial phase, additional plants will be set up in these states, alongside new facilities in Madhya Pradesh, marking a significant expansion effort in renewable energy infrastructure.
Biogas is also valuable for heating applications, especially in industries and buildings requiring space heating or process heat. Biogas can replace natural gas in boilers, furnaces, and district heating systems, providing a renewable alternative that reduces fossil fuel consumption and greenhouse gas emissions. The use of biogas for heating can be integrated into existing infrastructure with minimal modifications, making it a cost-effective solution for both industrial and residential sectors.
Regional Market Outlook
Region-wise, bio-digester market is analyzed across North America, Europe, Asia-Pacific, and LAMEA. In North America, bio-digesters are increasingly recognized for their dual benefits in waste management and energy generation. The U.S. and Canada lead in adoption, driven by agricultural operations seeking to manage organic waste efficiently while harnessing biogas for energy. Biodigesters are commonly integrated into dairy farms, where they process livestock manure and food waste to produce biogas, a renewable energy source used for heating, electricity generation, and even vehicle fuel.
Europe has been at the forefront of biodigester adoption, supported by robust policies promoting renewable energy and sustainability. Countries such as Germany, Denmark, and the Netherlands have extensive networks of biodigesters, primarily on farms but also in municipal waste management systems. European biodigesters utilize various feedstocks, including agricultural residues, food waste, and sewage sludge, to produce biogas that is fed into the grid or used locally for heat and power generation. The European Biomethane sector is set to receive $27.05 billion (€25 billion) in private investments by 2030, marking a 30% increase from previous estimates. The latest analysis by the European Biogas Association reveals an additional €2.1 billion in planned investments. This initiative will lead to the establishment of 950 new biomethane plants alongside the existing 1, 300 facilities, resulting in an annual capacity increase of 6.3 billion cubic meters of biomethane. This expansion is projected to mitigate nearly 29 million tons of CO2 emissions annually, provide renewable energy to 5 million European households year-round, and yield 830 thousand tons of fertilizer annually.
In the Asia-Pacific region, biodigesters are gaining traction as countries address energy security and environmental challenges. India, China, and Thailand are notable adopters, leveraging biodigesters in rural communities for decentralized energy production and waste management. Agricultural residues, animal manure, and organic household waste are common feedstocks used in biodigesters across Asia-Pacific, providing clean cooking fuel and electricity to off-grid areas.

Competitive Analysis
Key market players in the bio-digester market EISENMANN GmbH, PlanET Biogas Group, BIOGEST, EnviTec Biogas AG, SEAB Power Ltd, Martin Energy Group, ATEC, Sistema.bio, Zero-D Industries Private Limited, and Anaergia.
Industry Trends
- In 2023, Chevron announced a $10 billion investment over five years in lower carbon projects. This initiative includes the production of methane from farm-based biodigesters. Chevron is advancing the development and delivery of affordable, reliable, and progressively cleaner energy.
- According to the IEA Net Zero Emissions by 2050 Scenario, production of biogases should quadruple by 2030. Although we expect growth to accelerate from 19% in 2017-2022 to 32% in 2023-2028, an even higher pace is required to meet the Net Zero objective for 2030.
- As per the International Energy Agency, India is expanding its use of biogas in rural areas without grid access for cooking and lighting. The country aims to boost natural gas usage through the One Nation One Gas Grid initiative, aiming for a 15% share in the energy sector by 2030, up from 6.2% in 2022. India has also set a target to blend 5% biomethane into compressed natural gas (CNG) for transport and piped natural gas for homes by 2028, starting with 1% in FY 2025-2026 and increasing annually.

Key Sources Referred
- U.S. Environmental Protection Agency
- Defense Research and Development Organization
- Department of Energy
- U.S. Department of Commerce
- International Energy Agency
- National Renewable Energy Laboratory
- Biomass Power Association
- California Energy Consumption
- Algae Biomass Organization
Key Benefits For Stakeholders
- This report provides a quantitative analysis of the market segments, current trends, estimations, and dynamics of the bio-digester market analysis from 2024 to 2033 to identify the prevailing bio-digester market opportunities.
- The market research is offered along with information related to key drivers, restraints, and opportunities.
- Porter's five forces analysis highlights the potency of buyers and suppliers to enable stakeholders make profit-oriented business decisions and strengthen their supplier-buyer network.
- In-depth analysis of the bio-digester market segmentation assists to determine the prevailing market opportunities.
- Major countries in each region are mapped according to their revenue contribution to the global market.
- Market player positioning facilitates benchmarking and provides a clear understanding of the present position of the market players.
- The report includes the analysis of the regional as well as global bio-digester market trends, key players, market segments, application areas, and market growth strategies.
Biodigester Market Report Highlights
| Aspects | Details |
| Market Size By 2033 | USD 54.3 Billion |
| Growth Rate | CAGR of 6.1% |
| Forecast period | 2024 - 2033 |
| Report Pages | 300 |
| By Type |
|
| By Feedstock |
|
| By End-Use |
|
| By Region |
|
| Key Market Players | SEAB Power Ltd, EISENMANN GmbH, EnviTec Biogas AG, Anaergia, BIOGEST, Martin Energy Group, PlanET Biogas Group, Zero-D Industries Private Limited, ATEC, Sistema.bio |
| | SEaB Energy Ltd., The TEG Group, CH4E Ltd, GE Water & Process Technologies, ADI Systems, Others |
The global biodigester market was valued at $30.2 billion in 2023, and is projected to reach $54.3 billion by 2033, growing at a CAGR of 6.1% from 2024 to 2033.
Key market players in the biodigester market EISENMANN GmbH, PlanET Biogas Group, BIOGEST, EnviTec Biogas AG, SEAB Power Ltd, Martin Energy Group, ATEC, Sistema.bio, Zero-D Industries Private Limited, and Anaergia.
Asia-Pacific is the largest region for biodigester market.
Industrial is the leading end-use of biodigester market
Diverse utilization of biogas for electricity generation, heating, and vehicle fuel are the upcoming trends of biodigester market.
Loading Table Of Content...

