0
2022
Car Care Product Market

Car Care Product Market

by Product Type (Cleaning & Washing, Polishing & Waxing, Sealing Glaze & Coating, Others), by Solvent (Water-Based, Foam-Based), by Application (Interior, Exterior), by Vehicle Type (Passenger Cars, Light Commercial Vehicles, Heavy Commercial Vehicles), by Distribution Channel (Online, Offline), by Sales Channel (B2B, B2C): Global Opportunity Analysis and Industry Forecast, 2021-2031

Report Code: A10270
Sep 2022 | Pages: 362
Tables: 265
Charts: 70
  • Formats*:

  • pdf

    Single User License, Five User
    License & Enterprise User License

  • xls

    Data Pack Excel License

  • ppt

    It comes with the additional cost
    of $2500.00 contact sales.


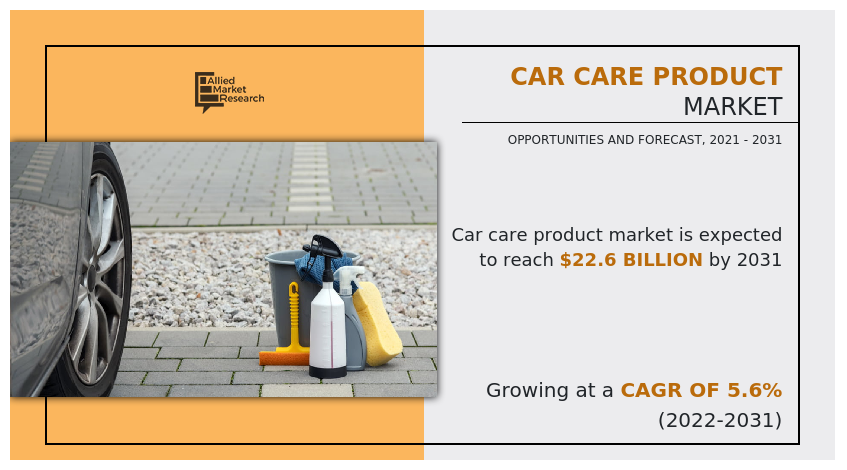
The global car care product market was valued at $13 billion in 2021, and is projected to reach $22.6 billion by 2031, growing at a CAGR of 5.6% from 2022 to 2031.

Car care products are high-performing chemicals used to enhance the aesthetic appearance of cars and improve their durability of the vehicles. It generally includes pads, cleaners, sprays, waxes, anti-aging moisturizing milk, and dust repellents. Apart from this, these products not only improve the shine and gloss of automobiles but also retain or protect the cars' visual appeal or aesthetic value.
The COVID-19 outbreak severely impacted the automotive sector on a global level, which in turn led to considerable drop in automotive sales, insufficiency of raw material, and others. Many small and big players in the automotive sector is witnessing issues such as a halt of production activities, mandated plant closures by the government, and others. As a result, the production of car care product witnessed decline due to the world's economic ecosystems. Furthermore, the overall auto industry, including members in value chain faced uncertainty in their respective businesses. However, the auto industry has shown tremendous resilience over the last few months. From the economic depths experienced in spring 2020, it has rebounded to deliver year-over-year growth in new-vehicle sales across China, Europe, and the US over the last few months. Similarly, the fastest recovery rates owing to the strict lockdowns and social distancing to contain the spread of the virus in some regions are also expected to boost the demand for the car care product industry.

Car Care Product Market, Car Care Product Industry

Currently, leading manufacturers are introducing novel products, such as powerful degreasers that can eliminate engine grease and clean dirt buildup on wheels and tires. In addition, the car care product market is gaining traction due to the customer inclination toward installing advanced components in vehicles to improve vehicle appearance and ensure safety while driving. This increased inclination among customers leads to the growth of aftermarket service, which is expected to eventually lead to the development of the car care product industry in the near future. Furthermore, the contribution of automotive component manufacturers boosts the market's growth. For instance, in May 2019, Castrol, a lubricant company, joined hands with 3M for vehicle care products. This partnership will bring 3M-Castrol branded bike and car care products like shampoo, glass cleaner, cream wax, and dashboard and tire dressers.
Car Care Product Market

The factors such as stringent government regulations to replace or upgrade vehicle components, growth of automotive after sale services, and adoption of ecommerce platforms by leading players supplement the growth of the car care product market. However, volatile prices of raw materials and usage of hazardous chemicals in car care products are the factors expected to hamper the growth of the market. In addition, rise in trend of vehicle customization coupled with increase in disposable income and development of anti-microbial car care products creates market opportunities for the key players operating in the car care products market.

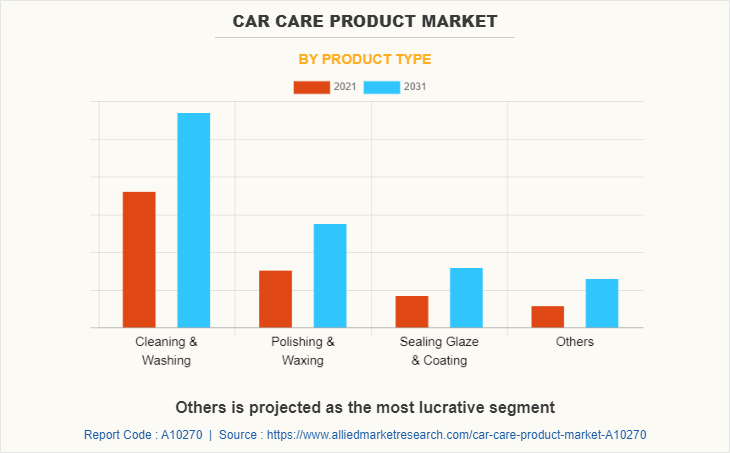
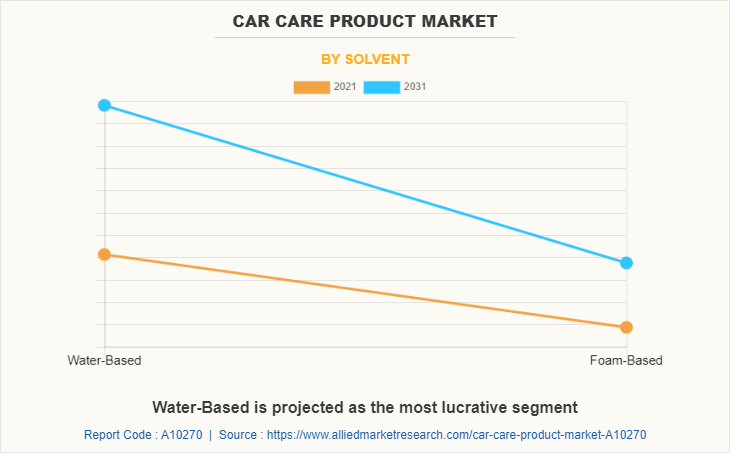
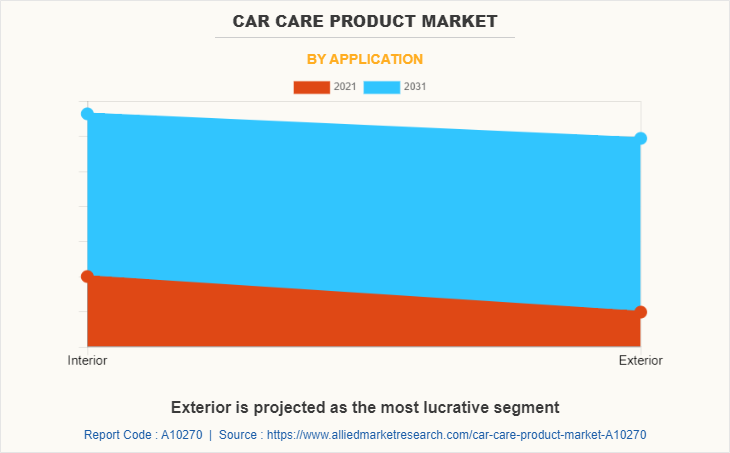
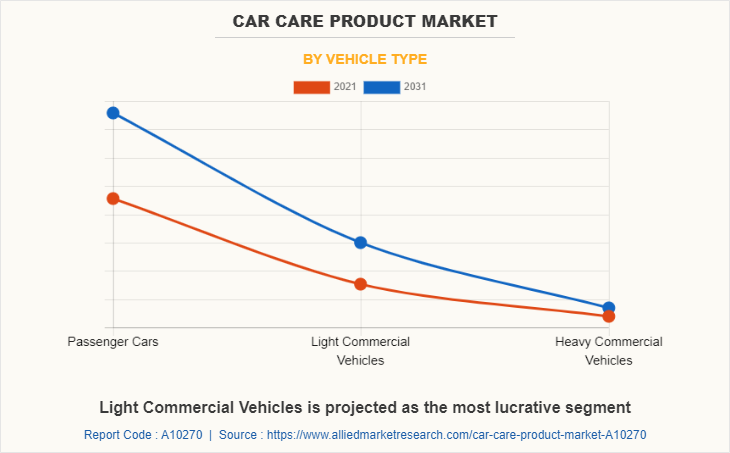
The car care product market is segmented into product type, solvent, application, vehicle type, distribution channel, sales channel, and region. By product type, the market is divided into cleaning & washing, polishing & waxing, sealing glaze & coating, and others. By solvent, it is fragmented into water-based and foam-based. By application, it is categorized into interior and exterior. By vehicle type, it is further classified into passenger cars, light commercial vehicles, and heavy commercial vehicles. By distribution channel, it is fragmented into online and offline. By sales channel, it is categorized into B2B and B2C. By region, it is analyzed across North America, Europe, Asia-Pacific, and LAMEA.
Car Care Product Market

The leading players operating in the car care product market are 3M, Adolf Würth GmbH & Co. KG, Amtra Sp. z o.o., ARMOR ALL, Auto Magic, Autoglym, Cartec BV, Chemical Guys, Illinois Tool Works Inc., Jopasu India Pvt. Ltd., Liqui Moly GmbH, MA-FRA S.p.A., Northern Car Care, Simoniz USA, SONAX GmbH, Tetrosyl Ltd., and Turtle Wax, Inc.

Stringent government regulations to replace or upgrade vehicle components

Many countries are mandating stringent rules and regulations to replace the car accessories after the expiry date. For instance, National Highway Traffic Safety Administration (NHTSA) has stated a new regulatory norm for car parts such as tires, rims, seat belts, and others to be originally manufactured and must be replaced according to the life span of the product. Consequently, there is a rise in the demand for car care products worldwide as they assist in restoring the interiors, cleaning the outer body, extending the life, and adding to the value of the vehicle. Such mandates are expected to boost the sales of the passenger car accessories; thereby, contributing toward the market growth. Moreover, the growth of aftermarket vehicle is fostered by a rise in customer awareness for adopting safe automobile car care technology. For instance, in February 2021, Chemical Guys launched the HydroInterior as its latest product in advanced ceramic protection for automotive interiors. HydroInterior is a versatile interior protectant and combined the ease of use and efficiency of a quick detailer with the long-lasting protective properties of a ceramic into one product designed to clean, protect, and maintain a vehicle's interior surfaces. Such improvements in the government regulations regarding the replacement or upgradation of vehicle components to extend the life & value of the vehicle is expected to propel the growth of the car care product market.
Car Care Product Market

Adoption of ecommerce platforms by leading players

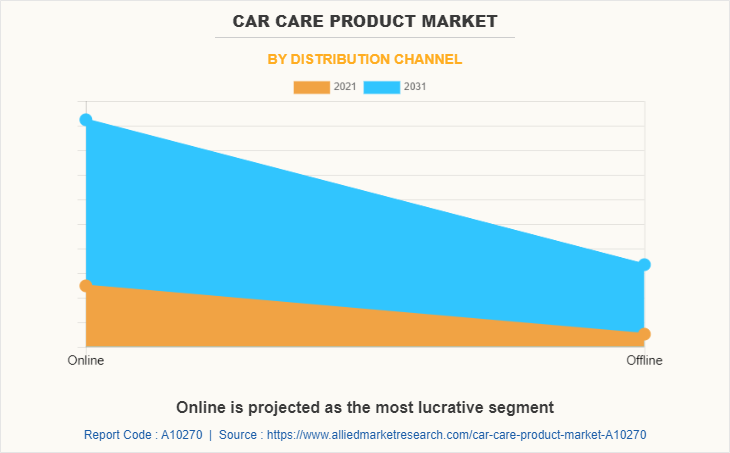
Ecommerce is one of the fastest-growing markets in the world. Ease of purchase or convenience, pricing and discounts on various products and services, and home delivery are the major reasons for increasing preference of e-commerce platforms around the world. Meanwhile, considering the success of e-commerce platforms and increasing consumer spending on car care products to maintain the aesthetics of a vehicle, many car care product manufacturers such as 3M, Illinois Tool Works, SONAX, and others have adopted this strategy to sell their car care products through online platforms and retail stores as well. These manufacturers are not only selling their products through other e-commerce sellers such as Amazon and Flipkart but also through their indigenous websites. Furthermore, e-commerce makes it extremely easy to track orders and customer information, while e-commerce software can be synced with a CRM to help manage customers to ensure they are receiving the best possible experience. Hence, owing to the rise in trend of e-commerce platforms for the selling of car care products is expected to drive the car care products market growth in forecast period.   
Car Care Product Market

Volatile prices of raw materials

Various raw materials such as leather detergent, solvents, blend of carnauba wax, special polymers and resins are used to manufacture car care products. Therefore, increase in the prices of these raw materials negatively affect the car care product vendors. Also, rubber (natural and synthetic) is the basic element required for various car care products, which witnesses high fluctuations in cost. The pricing of these raw materials has a significant impact on the overall price of the component. These materials are traded on community exchange and owing to global economic ups and downs in the market; prices of these materials fluctuate occasionally. Owing to all the aforementioned factors, the rise in prices of raw materials is expected to hamper the growth of the car care product market during the forecast period.
Car Care Product Market

Development of anti-microbial car care products

A car interior that is clean of all dirt, sand, dust, and smudges is great, but what about cleaning up all bacteria and harmful microbes. It assists the driver and occupants of a car, who typically spend 3–4 hours inside, in protecting themselves from a variety of illnesses and health problems associated with bacterial infection. Many makers of car care products as well as automobile owners and customers have come to understand the value of a germ-free surface. COVID-19 has certainly increased the demand for car care products in recent times as car owners have realized the importance of using disinfectants and antibacterial car care products for themselves and other passenger’s safety. For instance, in 2020, Adam's Polishes, a leader in auto detailing and cleaning products partnered with Microban, the industry leader in antimicrobial technology to expand its car interior cleaning antimicrobial solution portfolio. Such innovations in anti-microbial car care products is expected to create lucrative opportunity for global car care product market in the forecast period.
Car Care Product Market

Key Benefits For Stakeholders

  • This study presents analytical depiction of the global car care product market analysis along with current trends and future estimations to depict imminent investment pockets.
  • The overall car care product market opportunity is determined by understanding profitable trends to gain a stronger foothold.
  • The report presents information related to the key drivers, restraints, and opportunities of the global car care product market with a detailed impact analysis.
  • The current car care product market is quantitatively analyzed from 2022 to 2031 to benchmark the financial competency.
  • Porter’s five forces analysis illustrates the potency of the buyers and suppliers in the industry.

Car Care Product Market Report Highlights

Aspects Details
By Product Type
  • Cleaning & Washing
  • Polishing & Waxing
  • Sealing Glaze & Coating
  • Others
By Solvent
  • Water-Based
  • Foam-Based
By Application
  • Interior
  • Exterior
By Vehicle Type
  • Passenger Cars
  • Light Commercial Vehicles
  • Heavy Commercial Vehicles
By Distribution Channel
  • Online
  • Offline
By Sales Channel
  • B2B
  • B2C
By Region
  • North America  (U.S., Canada, Mexico)
  • Europe  (UK, Germany, France, Italy, Spain, Russia, Rest of Europe)
  • Asia-Pacific  (Australia, South Korea, Rest of Asia-Pacific, China, Japan, India)
  • LAMEA  (Latin America, Middle East, Africa)
Key Market Players Jopasu India Pvt. Ltd., SONAX GmbH, Armor All, Chemical Guys, Cartec BV, kdc/one, Illinois Tool Works Inc, Simoniz USA, Auto magic, Autoglym, Amtra Sp. z o.o, Turtle wax, Inc, Tetrosyl Ltd., 3M, MA-FRA S.p.A., LIQUI MOLY GmbH, Adolf Würth GmbH & Co. KG
 
  • CHAPTER 1:INTRODUCTION

    • 1.1.Report description

    • 1.2.Key market segments

    • 1.3.Key benefits to the stakeholders

    • 1.4.Research Methodology

      • 1.4.1.Secondary research

      • 1.4.2.Primary research

      • 1.4.3.Analyst tools and models

  • CHAPTER 2:EXECUTIVE SUMMARY

    • 2.1.Key findings of the study

    • 2.2.CXO Perspective

  • CHAPTER 3:MARKET OVERVIEW

    • 3.1.Market definition and scope

    • 3.2.Key findings

      • 3.2.1.Top investment pockets

    • 3.3.Porter’s five forces analysis

    • 3.4.Top player positioning

    • 3.5.Market dynamics

      • 3.5.1.Drivers

      • 3.5.2.Restraints

      • 3.5.3.Opportunities

    • 3.6.COVID-19 Impact Analysis on the market

  • CHAPTER 4: CAR CARE PRODUCT MARKET, BY PRODUCT TYPE

    • 4.1 Overview

      • 4.1.1 Market size and forecast

    • 4.2 Cleaning & Washing

      • 4.2.1 Key market trends, growth factors and opportunities

      • 4.2.2 Market size and forecast, by region

      • 4.2.3 Market analysis by country

    • 4.3 Polishing & Waxing

      • 4.3.1 Key market trends, growth factors and opportunities

      • 4.3.2 Market size and forecast, by region

      • 4.3.3 Market analysis by country

    • 4.4 Sealing Glaze & Coating

      • 4.4.1 Key market trends, growth factors and opportunities

      • 4.4.2 Market size and forecast, by region

      • 4.4.3 Market analysis by country

    • 4.5 Others

      • 4.5.1 Key market trends, growth factors and opportunities

      • 4.5.2 Market size and forecast, by region

      • 4.5.3 Market analysis by country

  • CHAPTER 5: CAR CARE PRODUCT MARKET, BY SOLVENT

    • 5.1 Overview

      • 5.1.1 Market size and forecast

    • 5.2 Water-Based

      • 5.2.1 Key market trends, growth factors and opportunities

      • 5.2.2 Market size and forecast, by region

      • 5.2.3 Market analysis by country

    • 5.3 Foam-Based

      • 5.3.1 Key market trends, growth factors and opportunities

      • 5.3.2 Market size and forecast, by region

      • 5.3.3 Market analysis by country

  • CHAPTER 6: CAR CARE PRODUCT MARKET, BY APPLICATION

    • 6.1 Overview

      • 6.1.1 Market size and forecast

    • 6.2 Interior

      • 6.2.1 Key market trends, growth factors and opportunities

      • 6.2.2 Market size and forecast, by region

      • 6.2.3 Market analysis by country

    • 6.3 Exterior

      • 6.3.1 Key market trends, growth factors and opportunities

      • 6.3.2 Market size and forecast, by region

      • 6.3.3 Market analysis by country

  • CHAPTER 7: CAR CARE PRODUCT MARKET, BY VEHICLE TYPE

    • 7.1 Overview

      • 7.1.1 Market size and forecast

    • 7.2 Passenger Cars

      • 7.2.1 Key market trends, growth factors and opportunities

      • 7.2.2 Market size and forecast, by region

      • 7.2.3 Market analysis by country

    • 7.3 Light Commercial Vehicles

      • 7.3.1 Key market trends, growth factors and opportunities

      • 7.3.2 Market size and forecast, by region

      • 7.3.3 Market analysis by country

    • 7.4 Heavy Commercial Vehicles

      • 7.4.1 Key market trends, growth factors and opportunities

      • 7.4.2 Market size and forecast, by region

      • 7.4.3 Market analysis by country

  • CHAPTER 8: CAR CARE PRODUCT MARKET, BY DISTRIBUTION CHANNEL

    • 8.1 Overview

      • 8.1.1 Market size and forecast

    • 8.2 Online

      • 8.2.1 Key market trends, growth factors and opportunities

      • 8.2.2 Market size and forecast, by region

      • 8.2.3 Market analysis by country

    • 8.3 Offline

      • 8.3.1 Key market trends, growth factors and opportunities

      • 8.3.2 Market size and forecast, by region

      • 8.3.3 Market analysis by country

  • CHAPTER 9: CAR CARE PRODUCT MARKET, BY SALES CHANNEL

    • 9.1 Overview

      • 9.1.1 Market size and forecast

    • 9.2 B2B

      • 9.2.1 Key market trends, growth factors and opportunities

      • 9.2.2 Market size and forecast, by region

      • 9.2.3 Market analysis by country

    • 9.3 B2C

      • 9.3.1 Key market trends, growth factors and opportunities

      • 9.3.2 Market size and forecast, by region

      • 9.3.3 Market analysis by country

  • CHAPTER 10: CAR CARE PRODUCT MARKET, BY REGION

    • 10.1 Overview

      • 10.1.1 Market size and forecast

    • 10.2 North America

      • 10.2.1 Key trends and opportunities

      • 10.2.2 North America Market size and forecast, by Product Type

      • 10.2.3 North America Market size and forecast, by Solvent

      • 10.2.4 North America Market size and forecast, by Application

      • 10.2.5 North America Market size and forecast, by Vehicle Type

      • 10.2.6 North America Market size and forecast, by Distribution Channel

      • 10.2.7 North America Market size and forecast, by Sales Channel

      • 10.2.8 North America Market size and forecast, by country

        • 10.2.8.1 U.S.
          • 10.2.8.1.1 Market size and forecast, by Product Type
          • 10.2.8.1.2 Market size and forecast, by Solvent
          • 10.2.8.1.3 Market size and forecast, by Application
          • 10.2.8.1.4 Market size and forecast, by Vehicle Type
          • 10.2.8.1.5 Market size and forecast, by Distribution Channel
          • 10.2.8.1.6 Market size and forecast, by Sales Channel
        • 10.2.8.2 Canada
          • 10.2.8.2.1 Market size and forecast, by Product Type
          • 10.2.8.2.2 Market size and forecast, by Solvent
          • 10.2.8.2.3 Market size and forecast, by Application
          • 10.2.8.2.4 Market size and forecast, by Vehicle Type
          • 10.2.8.2.5 Market size and forecast, by Distribution Channel
          • 10.2.8.2.6 Market size and forecast, by Sales Channel
        • 10.2.8.3 Mexico
          • 10.2.8.3.1 Market size and forecast, by Product Type
          • 10.2.8.3.2 Market size and forecast, by Solvent
          • 10.2.8.3.3 Market size and forecast, by Application
          • 10.2.8.3.4 Market size and forecast, by Vehicle Type
          • 10.2.8.3.5 Market size and forecast, by Distribution Channel
          • 10.2.8.3.6 Market size and forecast, by Sales Channel
    • 10.3 Europe

      • 10.3.1 Key trends and opportunities

      • 10.3.2 Europe Market size and forecast, by Product Type

      • 10.3.3 Europe Market size and forecast, by Solvent

      • 10.3.4 Europe Market size and forecast, by Application

      • 10.3.5 Europe Market size and forecast, by Vehicle Type

      • 10.3.6 Europe Market size and forecast, by Distribution Channel

      • 10.3.7 Europe Market size and forecast, by Sales Channel

      • 10.3.8 Europe Market size and forecast, by country

        • 10.3.8.1 UK
          • 10.3.8.1.1 Market size and forecast, by Product Type
          • 10.3.8.1.2 Market size and forecast, by Solvent
          • 10.3.8.1.3 Market size and forecast, by Application
          • 10.3.8.1.4 Market size and forecast, by Vehicle Type
          • 10.3.8.1.5 Market size and forecast, by Distribution Channel
          • 10.3.8.1.6 Market size and forecast, by Sales Channel
        • 10.3.8.2 Germany
          • 10.3.8.2.1 Market size and forecast, by Product Type
          • 10.3.8.2.2 Market size and forecast, by Solvent
          • 10.3.8.2.3 Market size and forecast, by Application
          • 10.3.8.2.4 Market size and forecast, by Vehicle Type
          • 10.3.8.2.5 Market size and forecast, by Distribution Channel
          • 10.3.8.2.6 Market size and forecast, by Sales Channel
        • 10.3.8.3 France
          • 10.3.8.3.1 Market size and forecast, by Product Type
          • 10.3.8.3.2 Market size and forecast, by Solvent
          • 10.3.8.3.3 Market size and forecast, by Application
          • 10.3.8.3.4 Market size and forecast, by Vehicle Type
          • 10.3.8.3.5 Market size and forecast, by Distribution Channel
          • 10.3.8.3.6 Market size and forecast, by Sales Channel
        • 10.3.8.4 Italy
          • 10.3.8.4.1 Market size and forecast, by Product Type
          • 10.3.8.4.2 Market size and forecast, by Solvent
          • 10.3.8.4.3 Market size and forecast, by Application
          • 10.3.8.4.4 Market size and forecast, by Vehicle Type
          • 10.3.8.4.5 Market size and forecast, by Distribution Channel
          • 10.3.8.4.6 Market size and forecast, by Sales Channel
        • 10.3.8.5 Spain
          • 10.3.8.5.1 Market size and forecast, by Product Type
          • 10.3.8.5.2 Market size and forecast, by Solvent
          • 10.3.8.5.3 Market size and forecast, by Application
          • 10.3.8.5.4 Market size and forecast, by Vehicle Type
          • 10.3.8.5.5 Market size and forecast, by Distribution Channel
          • 10.3.8.5.6 Market size and forecast, by Sales Channel
        • 10.3.8.6 Russia
          • 10.3.8.6.1 Market size and forecast, by Product Type
          • 10.3.8.6.2 Market size and forecast, by Solvent
          • 10.3.8.6.3 Market size and forecast, by Application
          • 10.3.8.6.4 Market size and forecast, by Vehicle Type
          • 10.3.8.6.5 Market size and forecast, by Distribution Channel
          • 10.3.8.6.6 Market size and forecast, by Sales Channel
        • 10.3.8.7 Rest of Europe
          • 10.3.8.7.1 Market size and forecast, by Product Type
          • 10.3.8.7.2 Market size and forecast, by Solvent
          • 10.3.8.7.3 Market size and forecast, by Application
          • 10.3.8.7.4 Market size and forecast, by Vehicle Type
          • 10.3.8.7.5 Market size and forecast, by Distribution Channel
          • 10.3.8.7.6 Market size and forecast, by Sales Channel
    • 10.4 Asia-Pacific

      • 10.4.1 Key trends and opportunities

      • 10.4.2 Asia-Pacific Market size and forecast, by Product Type

      • 10.4.3 Asia-Pacific Market size and forecast, by Solvent

      • 10.4.4 Asia-Pacific Market size and forecast, by Application

      • 10.4.5 Asia-Pacific Market size and forecast, by Vehicle Type

      • 10.4.6 Asia-Pacific Market size and forecast, by Distribution Channel

      • 10.4.7 Asia-Pacific Market size and forecast, by Sales Channel

      • 10.4.8 Asia-Pacific Market size and forecast, by country

        • 10.4.8.1 China
          • 10.4.8.1.1 Market size and forecast, by Product Type
          • 10.4.8.1.2 Market size and forecast, by Solvent
          • 10.4.8.1.3 Market size and forecast, by Application
          • 10.4.8.1.4 Market size and forecast, by Vehicle Type
          • 10.4.8.1.5 Market size and forecast, by Distribution Channel
          • 10.4.8.1.6 Market size and forecast, by Sales Channel
        • 10.4.8.2 Japan
          • 10.4.8.2.1 Market size and forecast, by Product Type
          • 10.4.8.2.2 Market size and forecast, by Solvent
          • 10.4.8.2.3 Market size and forecast, by Application
          • 10.4.8.2.4 Market size and forecast, by Vehicle Type
          • 10.4.8.2.5 Market size and forecast, by Distribution Channel
          • 10.4.8.2.6 Market size and forecast, by Sales Channel
        • 10.4.8.3 India
          • 10.4.8.3.1 Market size and forecast, by Product Type
          • 10.4.8.3.2 Market size and forecast, by Solvent
          • 10.4.8.3.3 Market size and forecast, by Application
          • 10.4.8.3.4 Market size and forecast, by Vehicle Type
          • 10.4.8.3.5 Market size and forecast, by Distribution Channel
          • 10.4.8.3.6 Market size and forecast, by Sales Channel
        • 10.4.8.4 Australia
          • 10.4.8.4.1 Market size and forecast, by Product Type
          • 10.4.8.4.2 Market size and forecast, by Solvent
          • 10.4.8.4.3 Market size and forecast, by Application
          • 10.4.8.4.4 Market size and forecast, by Vehicle Type
          • 10.4.8.4.5 Market size and forecast, by Distribution Channel
          • 10.4.8.4.6 Market size and forecast, by Sales Channel
        • 10.4.8.5 South Korea
          • 10.4.8.5.1 Market size and forecast, by Product Type
          • 10.4.8.5.2 Market size and forecast, by Solvent
          • 10.4.8.5.3 Market size and forecast, by Application
          • 10.4.8.5.4 Market size and forecast, by Vehicle Type
          • 10.4.8.5.5 Market size and forecast, by Distribution Channel
          • 10.4.8.5.6 Market size and forecast, by Sales Channel
        • 10.4.8.6 Rest of Asia-Pacific
          • 10.4.8.6.1 Market size and forecast, by Product Type
          • 10.4.8.6.2 Market size and forecast, by Solvent
          • 10.4.8.6.3 Market size and forecast, by Application
          • 10.4.8.6.4 Market size and forecast, by Vehicle Type
          • 10.4.8.6.5 Market size and forecast, by Distribution Channel
          • 10.4.8.6.6 Market size and forecast, by Sales Channel
    • 10.5 LAMEA

      • 10.5.1 Key trends and opportunities

      • 10.5.2 LAMEA Market size and forecast, by Product Type

      • 10.5.3 LAMEA Market size and forecast, by Solvent

      • 10.5.4 LAMEA Market size and forecast, by Application

      • 10.5.5 LAMEA Market size and forecast, by Vehicle Type

      • 10.5.6 LAMEA Market size and forecast, by Distribution Channel

      • 10.5.7 LAMEA Market size and forecast, by Sales Channel

      • 10.5.8 LAMEA Market size and forecast, by country

        • 10.5.8.1 Latin America
          • 10.5.8.1.1 Market size and forecast, by Product Type
          • 10.5.8.1.2 Market size and forecast, by Solvent
          • 10.5.8.1.3 Market size and forecast, by Application
          • 10.5.8.1.4 Market size and forecast, by Vehicle Type
          • 10.5.8.1.5 Market size and forecast, by Distribution Channel
          • 10.5.8.1.6 Market size and forecast, by Sales Channel
        • 10.5.8.2 Middle East
          • 10.5.8.2.1 Market size and forecast, by Product Type
          • 10.5.8.2.2 Market size and forecast, by Solvent
          • 10.5.8.2.3 Market size and forecast, by Application
          • 10.5.8.2.4 Market size and forecast, by Vehicle Type
          • 10.5.8.2.5 Market size and forecast, by Distribution Channel
          • 10.5.8.2.6 Market size and forecast, by Sales Channel
        • 10.5.8.3 Africa
          • 10.5.8.3.1 Market size and forecast, by Product Type
          • 10.5.8.3.2 Market size and forecast, by Solvent
          • 10.5.8.3.3 Market size and forecast, by Application
          • 10.5.8.3.4 Market size and forecast, by Vehicle Type
          • 10.5.8.3.5 Market size and forecast, by Distribution Channel
          • 10.5.8.3.6 Market size and forecast, by Sales Channel
  • CHAPTER 11: COMPANY LANDSCAPE

    • 11.1. Introduction

    • 11.2. Top winning strategies

    • 11.3. Product Mapping of Top 10 Player

    • 11.4. Competitive Dashboard

    • 11.5. Competitive Heatmap

    • 11.6. Key developments

  • CHAPTER 12: COMPANY PROFILES

    • 12.1 3M

      • 12.1.1 Company overview

      • 12.1.2 Company snapshot

      • 12.1.3 Operating business segments

      • 12.1.4 Product portfolio

      • 12.1.5 Business performance

      • 12.1.6 Key strategic moves and developments

    • 12.2 Adolf Würth GmbH & Co. KG

      • 12.2.1 Company overview

      • 12.2.2 Company snapshot

      • 12.2.3 Operating business segments

      • 12.2.4 Product portfolio

      • 12.2.5 Business performance

      • 12.2.6 Key strategic moves and developments

    • 12.3 Amtra Sp. z o.o

      • 12.3.1 Company overview

      • 12.3.2 Company snapshot

      • 12.3.3 Operating business segments

      • 12.3.4 Product portfolio

      • 12.3.5 Business performance

      • 12.3.6 Key strategic moves and developments

    • 12.4 Armor All

      • 12.4.1 Company overview

      • 12.4.2 Company snapshot

      • 12.4.3 Operating business segments

      • 12.4.4 Product portfolio

      • 12.4.5 Business performance

      • 12.4.6 Key strategic moves and developments

    • 12.5 Auto magic

      • 12.5.1 Company overview

      • 12.5.2 Company snapshot

      • 12.5.3 Operating business segments

      • 12.5.4 Product portfolio

      • 12.5.5 Business performance

      • 12.5.6 Key strategic moves and developments

    • 12.6 Autoglym

      • 12.6.1 Company overview

      • 12.6.2 Company snapshot

      • 12.6.3 Operating business segments

      • 12.6.4 Product portfolio

      • 12.6.5 Business performance

      • 12.6.6 Key strategic moves and developments

    • 12.7 Cartec BV

      • 12.7.1 Company overview

      • 12.7.2 Company snapshot

      • 12.7.3 Operating business segments

      • 12.7.4 Product portfolio

      • 12.7.5 Business performance

      • 12.7.6 Key strategic moves and developments

    • 12.8 Chemical Guys

      • 12.8.1 Company overview

      • 12.8.2 Company snapshot

      • 12.8.3 Operating business segments

      • 12.8.4 Product portfolio

      • 12.8.5 Business performance

      • 12.8.6 Key strategic moves and developments

    • 12.9 Illinois Tool Works Inc

      • 12.9.1 Company overview

      • 12.9.2 Company snapshot

      • 12.9.3 Operating business segments

      • 12.9.4 Product portfolio

      • 12.9.5 Business performance

      • 12.9.6 Key strategic moves and developments

    • 12.10 Jopasu India Pvt. Ltd.

      • 12.10.1 Company overview

      • 12.10.2 Company snapshot

      • 12.10.3 Operating business segments

      • 12.10.4 Product portfolio

      • 12.10.5 Business performance

      • 12.10.6 Key strategic moves and developments

    • 12.11 kdc/one

      • 12.11.1 Company overview

      • 12.11.2 Company snapshot

      • 12.11.3 Operating business segments

      • 12.11.4 Product portfolio

      • 12.11.5 Business performance

      • 12.11.6 Key strategic moves and developments

    • 12.12 LIQUI MOLY GmbH

      • 12.12.1 Company overview

      • 12.12.2 Company snapshot

      • 12.12.3 Operating business segments

      • 12.12.4 Product portfolio

      • 12.12.5 Business performance

      • 12.12.6 Key strategic moves and developments

    • 12.13 MA-FRA S.p.A.

      • 12.13.1 Company overview

      • 12.13.2 Company snapshot

      • 12.13.3 Operating business segments

      • 12.13.4 Product portfolio

      • 12.13.5 Business performance

      • 12.13.6 Key strategic moves and developments

    • 12.14 Simoniz USA

      • 12.14.1 Company overview

      • 12.14.2 Company snapshot

      • 12.14.3 Operating business segments

      • 12.14.4 Product portfolio

      • 12.14.5 Business performance

      • 12.14.6 Key strategic moves and developments

    • 12.15 SONAX GmbH

      • 12.15.1 Company overview

      • 12.15.2 Company snapshot

      • 12.15.3 Operating business segments

      • 12.15.4 Product portfolio

      • 12.15.5 Business performance

      • 12.15.6 Key strategic moves and developments

    • 12.16 Tetrosyl Ltd.

      • 12.16.1 Company overview

      • 12.16.2 Company snapshot

      • 12.16.3 Operating business segments

      • 12.16.4 Product portfolio

      • 12.16.5 Business performance

      • 12.16.6 Key strategic moves and developments

    • 12.17 Turtle wax, Inc

      • 12.17.1 Company overview

      • 12.17.2 Company snapshot

      • 12.17.3 Operating business segments

      • 12.17.4 Product portfolio

      • 12.17.5 Business performance

      • 12.17.6 Key strategic moves and developments

  • LIST OF TABLES

  • TABLE 01. CAR CARE PRODUCT MARKET, BY PRODUCT TYPE, 2021-2031 ($MILLION)
    TABLE 02. CAR CARE PRODUCT MARKET FOR CLEANING & WASHING, BY REGION, 2021-2031 ($MILLION)
    TABLE 03. CAR CARE PRODUCT MARKET FOR CLEANING & WASHING, BY VEHICLE TYPE, 2021-2031 ($MILLION)
    TABLE 04. CAR CARE PRODUCT MARKET FOR POLISHING & WAXING, BY REGION, 2021-2031 ($MILLION)
    TABLE 05. CAR CARE PRODUCT MARKET FOR POLISHING & WAXING, BY VEHICLE TYPE, 2021-2031 ($MILLION)
    TABLE 06. CAR CARE PRODUCT MARKET FOR SEALING GLAZE & COATING, BY REGION, 2021-2031 ($MILLION)
    TABLE 07. CAR CARE PRODUCT MARKET FOR SEALING GLAZE & COATING, BY VEHICLE TYPE, 2021-2031 ($MILLION)
    TABLE 08. CAR CARE PRODUCT MARKET FOR OTHERS, BY REGION, 2021-2031 ($MILLION)
    TABLE 09. CAR CARE PRODUCT MARKET FOR OTHERS, BY VEHICLE TYPE, 2021-2031 ($MILLION)
    TABLE 10. CAR CARE PRODUCT MARKET, BY SOLVENT, 2021-2031 ($MILLION)
    TABLE 11. CAR CARE PRODUCT MARKET FOR WATER-BASED, BY REGION 2021-2031 ($MILLION)
    TABLE 12. CAR CARE PRODUCT MARKET FOR FOAM-BASED, BY REGION 2021-2031 ($MILLION)
    TABLE 13. CAR CARE PRODUCT MARKET, BY APPLICATION, 2021-2031 ($MILLION)
    TABLE 14. CAR CARE PRODUCT MARKET FOR INTERIOR, BY REGION 2021-2031 ($MILLION)
    TABLE 15. CAR CARE PRODUCT MARKET FOR EXTERIOR, BY REGION 2021-2031 ($MILLION)
    TABLE 16. CAR CARE PRODUCT MARKET, BY VEHICLE TYPE, 2021-2031 ($MILLION)
    TABLE 17. CAR CARE PRODUCT MARKET FOR PASSENGER CARS, BY REGION 2021-2031 ($MILLION)
    TABLE 18. CAR CARE PRODUCT MARKET FOR LIGHT COMMERCIAL VEHICLES, BY REGION 2021-2031 ($MILLION)
    TABLE 19. CAR CARE PRODUCT MARKET FOR HEAVY COMMERCIAL VEHICLES, BY REGION 2021-2031 ($MILLION)
    TABLE 20. CAR CARE PRODUCT MARKET, BY DISTRIBUTION CHANNEL, 2021-2031 ($MILLION)
    TABLE 21. CAR CARE PRODUCT MARKET FOR ONLINE, BY REGION 2021-2031 ($MILLION)
    TABLE 22. CAR CARE PRODUCT MARKET FOR OFFLINE, BY REGION 2021-2031 ($MILLION)
    TABLE 23. CAR CARE PRODUCT MARKET, BY SALES CHANNEL, 2021-2031 ($MILLION)
    TABLE 24. CAR CARE PRODUCT MARKET FOR B2B, BY REGION 2021-2031 ($MILLION)
    TABLE 25. CAR CARE PRODUCT MARKET FOR B2C, BY REGION 2021-2031 ($MILLION)
    TABLE 26. CAR CARE PRODUCT MARKET, BY REGION, 2021-2031 ($MILLION)
    TABLE 27. NORTH AMERICA CAR CARE PRODUCT MARKET, BY COUNTRY, 2021-2031 ($MILLION)
    TABLE 28. NORTH AMERICA CAR CARE PRODUCT MARKET, BY PRODUCT TYPE, 2021-2031 ($MILLION)
    TABLE 29. NORTH AMERICA CAR CARE PRODUCT MARKET, FOR CLEANING & WASHING, BY VEHICLE TYPE, 2021-2031 ($MILLION)
    TABLE 30. NORTH AMERICA CAR CARE PRODUCT MARKET, FOR POLISHING & WAXING, BY VEHICLE TYPE, 2021-2031 ($MILLION)
    TABLE 31. NORTH AMERICA CAR CARE PRODUCT MARKET, FOR SEALING GLAZE & COATING, BY VEHICLE TYPE, 2021-2031 ($MILLION)
    TABLE 32. NORTH AMERICA CAR CARE PRODUCT MARKET, FOR OTHERS, BY VEHICLE TYPE, 2021-2031 ($MILLION)
    TABLE 33. NORTH AMERICA CAR CARE PRODUCT MARKET, BY SOLVENT, 2021-2031 ($MILLION)
    TABLE 34. NORTH AMERICA CAR CARE PRODUCT MARKET, BY APPLICATION, 2021-2031 ($MILLION)
    TABLE 35. NORTH AMERICA CAR CARE PRODUCT MARKET, BY VEHICLE TYPE, 2021-2031 ($MILLION)
    TABLE 36. NORTH AMERICA CAR CARE PRODUCT MARKET, BY DISTRIBUTION CHANNEL, 2021-2031 ($MILLION)
    TABLE 37. NORTH AMERICA CAR CARE PRODUCT MARKET, BY SALES CHANNEL, 2021-2031 ($MILLION)
    TABLE 38. U.S. CAR CARE PRODUCT MARKET, BY PRODUCT TYPE, 2021-2031 ($MILLION)
    TABLE 39. U.S. CAR CARE PRODUCT MARKET, BY SOLVENT, 2021-2031 ($MILLION)
    TABLE 40. U.S. CAR CARE PRODUCT MARKET, BY APPLICATION, 2021-2031 ($MILLION)
    TABLE 41. U.S. CAR CARE PRODUCT MARKET, BY VEHICLE TYPE, 2021-2031 ($MILLION)
    TABLE 42. U.S. CAR CARE PRODUCT MARKET, BY DISTRIBUTION CHANNEL, 2021-2031 ($MILLION)
    TABLE 43. U.S. CAR CARE PRODUCT MARKET, BY SALES CHANNEL, 2021-2031 ($MILLION)
    TABLE 44. CANADA CAR CARE PRODUCT MARKET, BY PRODUCT TYPE, 2021-2031 ($MILLION)
    TABLE 45. CANADA CAR CARE PRODUCT MARKET, BY SOLVENT, 2021-2031 ($MILLION)
    TABLE 46. CANADA CAR CARE PRODUCT MARKET, BY APPLICATION, 2021-2031 ($MILLION)
    TABLE 47. CANADA CAR CARE PRODUCT MARKET, BY VEHICLE TYPE, 2021-2031 ($MILLION)
    TABLE 48. CANADA CAR CARE PRODUCT MARKET, BY DISTRIBUTION CHANNEL, 2021-2031 ($MILLION)
    TABLE 49. CANADA CAR CARE PRODUCT MARKET, BY SALES CHANNEL, 2021-2031 ($MILLION)
    TABLE 50. MEXICO CAR CARE PRODUCT MARKET, BY PRODUCT TYPE, 2021-2031 ($MILLION)
    TABLE 51. MEXICO CAR CARE PRODUCT MARKET, BY SOLVENT, 2021-2031 ($MILLION)
    TABLE 52. MEXICO CAR CARE PRODUCT MARKET, BY APPLICATION, 2021-2031 ($MILLION)
    TABLE 53. MEXICO CAR CARE PRODUCT MARKET, BY VEHICLE TYPE, 2021-2031 ($MILLION)
    TABLE 54. MEXICO CAR CARE PRODUCT MARKET, BY DISTRIBUTION CHANNEL, 2021-2031 ($MILLION)
    TABLE 55. MEXICO CAR CARE PRODUCT MARKET, BY SALES CHANNEL, 2021-2031 ($MILLION)
    TABLE 56. EUROPE CAR CARE PRODUCT MARKET, BY COUNTRY, 2021-2031 ($MILLION)
    TABLE 57. EUROPE CAR CARE PRODUCT MARKET, BY PRODUCT TYPE, 2021-2031 ($MILLION)
    TABLE 58. EUROPE CAR CARE PRODUCT MARKET, FOR CLEANING & WASHING, BY VEHICLE TYPE, 2021-2031 ($MILLION)
    TABLE 59. EUROPE CAR CARE PRODUCT MARKET, FOR POLISHING & WAXING, BY VEHICLE TYPE, 2021-2031 ($MILLION)
    TABLE 60. EUROPE CAR CARE PRODUCT MARKET, FOR SEALING GLAZE & COATING, BY VEHICLE TYPE, 2021-2031 ($MILLION)
    TABLE 61. EUROPE CAR CARE PRODUCT MARKET, FOR OTHERS, BY VEHICLE TYPE, 2021-2031 ($MILLION)
    TABLE 62. EUROPE CAR CARE PRODUCT MARKET, BY SOLVENT, 2021-2031 ($MILLION)
    TABLE 63. EUROPE CAR CARE PRODUCT MARKET, BY APPLICATION, 2021-2031 ($MILLION)
    TABLE 64. EUROPE CAR CARE PRODUCT MARKET, BY VEHICLE TYPE, 2021-2031 ($MILLION)
    TABLE 65. EUROPE CAR CARE PRODUCT MARKET, BY DISTRIBUTION CHANNEL, 2021-2031 ($MILLION)
    TABLE 66. EUROPE CAR CARE PRODUCT MARKET, BY SALES CHANNEL, 2021-2031 ($MILLION)
    TABLE 67. UK CAR CARE PRODUCT MARKET, BY PRODUCT TYPE, 2021-2031 ($MILLION)
    TABLE 68. UK CAR CARE PRODUCT MARKET, BY SOLVENT, 2021-2031 ($MILLION)
    TABLE 69. UK CAR CARE PRODUCT MARKET, BY APPLICATION, 2021-2031 ($MILLION)
    TABLE 70. UK CAR CARE PRODUCT MARKET, BY VEHICLE TYPE, 2021-2031 ($MILLION)
    TABLE 71. UK CAR CARE PRODUCT MARKET, BY DISTRIBUTION CHANNEL, 2021-2031 ($MILLION)
    TABLE 72. UK CAR CARE PRODUCT MARKET, BY SALES CHANNEL, 2021-2031 ($MILLION)
    TABLE 73. GERMANY CAR CARE PRODUCT MARKET, BY PRODUCT TYPE, 2021-2031 ($MILLION)
    TABLE 74. GERMANY CAR CARE PRODUCT MARKET, BY SOLVENT, 2021-2031 ($MILLION)
    TABLE 75. GERMANY CAR CARE PRODUCT MARKET, BY APPLICATION, 2021-2031 ($MILLION)
    TABLE 76. GERMANY CAR CARE PRODUCT MARKET, BY VEHICLE TYPE, 2021-2031 ($MILLION)
    TABLE 77. GERMANY CAR CARE PRODUCT MARKET, BY DISTRIBUTION CHANNEL, 2021-2031 ($MILLION)
    TABLE 78. GERMANY CAR CARE PRODUCT MARKET, BY SALES CHANNEL, 2021-2031 ($MILLION)
    TABLE 79. FRANCE CAR CARE PRODUCT MARKET, BY PRODUCT TYPE, 2021-2031 ($MILLION)
    TABLE 80. FRANCE CAR CARE PRODUCT MARKET, BY SOLVENT, 2021-2031 ($MILLION)
    TABLE 81. FRANCE CAR CARE PRODUCT MARKET, BY APPLICATION, 2021-2031 ($MILLION)
    TABLE 82. FRANCE CAR CARE PRODUCT MARKET, BY VEHICLE TYPE, 2021-2031 ($MILLION)
    TABLE 83. FRANCE CAR CARE PRODUCT MARKET, BY DISTRIBUTION CHANNEL, 2021-2031 ($MILLION)
    TABLE 84. FRANCE CAR CARE PRODUCT MARKET, BY SALES CHANNEL, 2021-2031 ($MILLION)
    TABLE 85. ITALY CAR CARE PRODUCT MARKET, BY PRODUCT TYPE, 2021-2031 ($MILLION)
    TABLE 86. ITALY CAR CARE PRODUCT MARKET, BY SOLVENT, 2021-2031 ($MILLION)
    TABLE 87. ITALY CAR CARE PRODUCT MARKET, BY APPLICATION, 2021-2031 ($MILLION)
    TABLE 88. ITALY CAR CARE PRODUCT MARKET, BY VEHICLE TYPE, 2021-2031 ($MILLION)
    TABLE 89. ITALY CAR CARE PRODUCT MARKET, BY DISTRIBUTION CHANNEL, 2021-2031 ($MILLION)
    TABLE 90. ITALY CAR CARE PRODUCT MARKET, BY SALES CHANNEL, 2021-2031 ($MILLION)
    TABLE 91. SPAIN CAR CARE PRODUCT MARKET, BY PRODUCT TYPE, 2021-2031 ($MILLION)
    TABLE 92. SPAIN CAR CARE PRODUCT MARKET, BY SOLVENT, 2021-2031 ($MILLION)
    TABLE 93. SPAIN CAR CARE PRODUCT MARKET, BY APPLICATION, 2021-2031 ($MILLION)
    TABLE 94. SPAIN CAR CARE PRODUCT MARKET, BY VEHICLE TYPE, 2021-2031 ($MILLION)
    TABLE 95. SPAIN CAR CARE PRODUCT MARKET, BY DISTRIBUTION CHANNEL, 2021-2031 ($MILLION)
    TABLE 96. SPAIN CAR CARE PRODUCT MARKET, BY SALES CHANNEL, 2021-2031 ($MILLION)
    TABLE 97. RUSSIA CAR CARE PRODUCT MARKET, BY PRODUCT TYPE, 2021-2031 ($MILLION)
    TABLE 98. RUSSIA CAR CARE PRODUCT MARKET, BY SOLVENT, 2021-2031 ($MILLION)
    TABLE 99. RUSSIA CAR CARE PRODUCT MARKET, BY APPLICATION, 2021-2031 ($MILLION)
    TABLE 100. RUSSIA CAR CARE PRODUCT MARKET, BY VEHICLE TYPE, 2021-2031 ($MILLION)
    TABLE 101. RUSSIA CAR CARE PRODUCT MARKET, BY DISTRIBUTION CHANNEL, 2021-2031 ($MILLION)
    TABLE 102. RUSSIA CAR CARE PRODUCT MARKET, BY SALES CHANNEL, 2021-2031 ($MILLION)
    TABLE 103. REST OF EUROPE CAR CARE PRODUCT MARKET, BY PRODUCT TYPE, 2021-2031 ($MILLION)
    TABLE 104. REST OF EUROPE CAR CARE PRODUCT MARKET, BY SOLVENT, 2021-2031 ($MILLION)
    TABLE 105. REST OF EUROPE CAR CARE PRODUCT MARKET, BY APPLICATION, 2021-2031 ($MILLION)
    TABLE 106. REST OF EUROPE CAR CARE PRODUCT MARKET, BY VEHICLE TYPE, 2021-2031 ($MILLION)
    TABLE 107. REST OF EUROPE CAR CARE PRODUCT MARKET, BY DISTRIBUTION CHANNEL, 2021-2031 ($MILLION)
    TABLE 108. REST OF EUROPE CAR CARE PRODUCT MARKET, BY SALES CHANNEL, 2021-2031 ($MILLION)
    TABLE 109. ASIA-PACIFIC CAR CARE PRODUCT MARKET, BY COUNTRY, 2021-2031 ($MILLION)
    TABLE 110. ASIA-PACIFIC CAR CARE PRODUCT MARKET, BY PRODUCT TYPE, 2021-2031 ($MILLION)
    TABLE 111. ASIA-PACIFIC CAR CARE PRODUCT MARKET, FOR CLEANING & WASHING, BY VEHICLE TYPE, 2021-2031 ($MILLION)
    TABLE 112. ASIA-PACIFIC CAR CARE PRODUCT MARKET, FOR POLISHING & WAXING, BY VEHICLE TYPE, 2021-2031 ($MILLION)
    TABLE 113. ASIA-PACIFIC CAR CARE PRODUCT MARKET, FOR SEALING GLAZE & COATING, BY VEHICLE TYPE, 2021-2031 ($MILLION)
    TABLE 114. ASIA-PACIFIC CAR CARE PRODUCT MARKET, FOR OTHERS, BY VEHICLE TYPE, 2021-2031 ($MILLION)
    TABLE 115. ASIA-PACIFIC CAR CARE PRODUCT MARKET, BY SOLVENT, 2021-2031 ($MILLION)
    TABLE 116. ASIA-PACIFIC CAR CARE PRODUCT MARKET, BY APPLICATION, 2021-2031 ($MILLION)
    TABLE 117. ASIA-PACIFIC CAR CARE PRODUCT MARKET, BY VEHICLE TYPE, 2021-2031 ($MILLION)
    TABLE 118. ASIA-PACIFIC CAR CARE PRODUCT MARKET, BY DISTRIBUTION CHANNEL, 2021-2031 ($MILLION)
    TABLE 119. ASIA-PACIFIC CAR CARE PRODUCT MARKET, BY SALES CHANNEL, 2021-2031 ($MILLION)
    TABLE 120. CHINA CAR CARE PRODUCT MARKET, BY PRODUCT TYPE, 2021-2031 ($MILLION)
    TABLE 121. CHINA CAR CARE PRODUCT MARKET, BY SOLVENT, 2021-2031 ($MILLION)
    TABLE 122. CHINA CAR CARE PRODUCT MARKET, BY APPLICATION, 2021-2031 ($MILLION)
    TABLE 123. CHINA CAR CARE PRODUCT MARKET, BY VEHICLE TYPE, 2021-2031 ($MILLION)
    TABLE 124. CHINA CAR CARE PRODUCT MARKET, BY DISTRIBUTION CHANNEL, 2021-2031 ($MILLION)
    TABLE 125. CHINA CAR CARE PRODUCT MARKET, BY SALES CHANNEL, 2021-2031 ($MILLION)
    TABLE 126. JAPAN CAR CARE PRODUCT MARKET, BY PRODUCT TYPE, 2021-2031 ($MILLION)
    TABLE 127. JAPAN CAR CARE PRODUCT MARKET, BY SOLVENT, 2021-2031 ($MILLION)
    TABLE 128. JAPAN CAR CARE PRODUCT MARKET, BY APPLICATION, 2021-2031 ($MILLION)
    TABLE 129. JAPAN CAR CARE PRODUCT MARKET, BY VEHICLE TYPE, 2021-2031 ($MILLION)
    TABLE 130. JAPAN CAR CARE PRODUCT MARKET, BY DISTRIBUTION CHANNEL, 2021-2031 ($MILLION)
    TABLE 131. JAPAN CAR CARE PRODUCT MARKET, BY SALES CHANNEL, 2021-2031 ($MILLION)
    TABLE 132. INDIA CAR CARE PRODUCT MARKET, BY PRODUCT TYPE, 2021-2031 ($MILLION)
    TABLE 133. INDIA CAR CARE PRODUCT MARKET, BY SOLVENT, 2021-2031 ($MILLION)
    TABLE 134. INDIA CAR CARE PRODUCT MARKET, BY APPLICATION, 2021-2031 ($MILLION)
    TABLE 135. INDIA CAR CARE PRODUCT MARKET, BY VEHICLE TYPE, 2021-2031 ($MILLION)
    TABLE 136. INDIA CAR CARE PRODUCT MARKET, BY DISTRIBUTION CHANNEL, 2021-2031 ($MILLION)
    TABLE 137. INDIA CAR CARE PRODUCT MARKET, BY SALES CHANNEL, 2021-2031 ($MILLION)
    TABLE 138. AUSTRALIA CAR CARE PRODUCT MARKET, BY PRODUCT TYPE, 2021-2031 ($MILLION)
    TABLE 139. AUSTRALIA CAR CARE PRODUCT MARKET, BY SOLVENT, 2021-2031 ($MILLION)
    TABLE 140. AUSTRALIA CAR CARE PRODUCT MARKET, BY APPLICATION, 2021-2031 ($MILLION)
    TABLE 141. AUSTRALIA CAR CARE PRODUCT MARKET, BY VEHICLE TYPE, 2021-2031 ($MILLION)
    TABLE 142. AUSTRALIA CAR CARE PRODUCT MARKET, BY DISTRIBUTION CHANNEL, 2021-2031 ($MILLION)
    TABLE 143. AUSTRALIA CAR CARE PRODUCT MARKET, BY SALES CHANNEL, 2021-2031 ($MILLION)
    TABLE 144. SOUTH KOREA CAR CARE PRODUCT MARKET, BY PRODUCT TYPE, 2021-2031 ($MILLION)
    TABLE 145. SOUTH KOREA CAR CARE PRODUCT MARKET, BY SOLVENT, 2021-2031 ($MILLION)
    TABLE 146. SOUTH KOREA CAR CARE PRODUCT MARKET, BY APPLICATION, 2021-2031 ($MILLION)
    TABLE 147. SOUTH KOREA CAR CARE PRODUCT MARKET, BY VEHICLE TYPE, 2021-2031 ($MILLION)
    TABLE 148. SOUTH KOREA CAR CARE PRODUCT MARKET, BY DISTRIBUTION CHANNEL, 2021-2031 ($MILLION)
    TABLE 149. SOUTH KOREA CAR CARE PRODUCT MARKET, BY SALES CHANNEL, 2021-2031 ($MILLION)
    TABLE 150. REST OF ASIA-PACIFIC CAR CARE PRODUCT MARKET, BY PRODUCT TYPE, 2021-2031 ($MILLION)
    TABLE 151. REST OF ASIA-PACIFIC CAR CARE PRODUCT MARKET, BY SOLVENT, 2021-2031 ($MILLION)
    TABLE 152. REST OF ASIA-PACIFIC CAR CARE PRODUCT MARKET, BY APPLICATION, 2021-2031 ($MILLION)
    TABLE 153. REST OF ASIA-PACIFIC CAR CARE PRODUCT MARKET, BY VEHICLE TYPE, 2021-2031 ($MILLION)
    TABLE 154. REST OF ASIA-PACIFIC CAR CARE PRODUCT MARKET, BY DISTRIBUTION CHANNEL, 2021-2031 ($MILLION)
    TABLE 155. REST OF ASIA-PACIFIC CAR CARE PRODUCT MARKET, BY SALES CHANNEL, 2021-2031 ($MILLION)
    TABLE 156. LAMEA CAR CARE PRODUCT MARKET, BY COUNTRY, 2021-2031 ($MILLION)
    TABLE 157. LAMEA CAR CARE PRODUCT MARKET, BY PRODUCT TYPE, 2021-2031 ($MILLION)
    TABLE 158. LAMEA CAR CARE PRODUCT MARKET, FOR CLEANING & WASHING, BY VEHICLE TYPE, 2021-2031 ($MILLION)
    TABLE 159. LAMEA CAR CARE PRODUCT MARKET, FOR POLISHING & WAXING, BY VEHICLE TYPE, 2021-2031 ($MILLION)
    TABLE 160. LAMEA CAR CARE PRODUCT MARKET, FOR SEALING GLAZE & COATING, BY VEHICLE TYPE, 2021-2031 ($MILLION)
    TABLE 161. LAMEA CAR CARE PRODUCT MARKET, FOR OTHERS, BY VEHICLE TYPE, 2021-2031 ($MILLION)
    TABLE 162. LAMEA CAR CARE PRODUCT MARKET, BY SOLVENT, 2021-2031 ($MILLION)
    TABLE 163. LAMEA CAR CARE PRODUCT MARKET, BY APPLICATION, 2021-2031 ($MILLION)
    TABLE 164. LAMEA CAR CARE PRODUCT MARKET, BY VEHICLE TYPE, 2021-2031 ($MILLION)
    TABLE 165. LAMEA CAR CARE PRODUCT MARKET, BY DISTRIBUTION CHANNEL, 2021-2031 ($MILLION)
    TABLE 166. LAMEA CAR CARE PRODUCT MARKET, BY SALES CHANNEL, 2021-2031 ($MILLION)
    TABLE 167. LATIN AMERICA CAR CARE PRODUCT MARKET, BY PRODUCT TYPE, 2021-2031 ($MILLION)
    TABLE 168. LATIN AMERICA CAR CARE PRODUCT MARKET, BY SOLVENT, 2021-2031 ($MILLION)
    TABLE 169. LATIN AMERICA CAR CARE PRODUCT MARKET, BY APPLICATION, 2021-2031 ($MILLION)
    TABLE 170. LATIN AMERICA CAR CARE PRODUCT MARKET, BY VEHICLE TYPE, 2021-2031 ($MILLION)
    TABLE 171. LATIN AMERICA CAR CARE PRODUCT MARKET, BY DISTRIBUTION CHANNEL, 2021-2031 ($MILLION)
    TABLE 172. LATIN AMERICA CAR CARE PRODUCT MARKET, BY SALES CHANNEL, 2021-2031 ($MILLION)
    TABLE 173. MIDDLE EAST CAR CARE PRODUCT MARKET, BY PRODUCT TYPE, 2021-2031 ($MILLION)
    TABLE 174. MIDDLE EAST CAR CARE PRODUCT MARKET, BY SOLVENT, 2021-2031 ($MILLION)
    TABLE 175. MIDDLE EAST CAR CARE PRODUCT MARKET, BY APPLICATION, 2021-2031 ($MILLION)
    TABLE 176. MIDDLE EAST CAR CARE PRODUCT MARKET, BY VEHICLE TYPE, 2021-2031 ($MILLION)
    TABLE 177. MIDDLE EAST CAR CARE PRODUCT MARKET, BY DISTRIBUTION CHANNEL, 2021-2031 ($MILLION)
    TABLE 178. MIDDLE EAST CAR CARE PRODUCT MARKET, BY SALES CHANNEL, 2021-2031 ($MILLION)
    TABLE 179. AFRICA CAR CARE PRODUCT MARKET, BY PRODUCT TYPE, 2021-2031 ($MILLION)
    TABLE 180. AFRICA CAR CARE PRODUCT MARKET, BY SOLVENT, 2021-2031 ($MILLION)
    TABLE 181. AFRICA CAR CARE PRODUCT MARKET, BY APPLICATION, 2021-2031 ($MILLION)
    TABLE 182. AFRICA CAR CARE PRODUCT MARKET, BY VEHICLE TYPE, 2021-2031 ($MILLION)
    TABLE 183. AFRICA CAR CARE PRODUCT MARKET, BY DISTRIBUTION CHANNEL, 2021-2031 ($MILLION)
    TABLE 184. AFRICA CAR CARE PRODUCT MARKET, BY SALES CHANNEL, 2021-2031 ($MILLION)
    TABLE 185. 3M: KEY EXECUTIVES
    TABLE 186. 3M: COMPANY SNAPSHOT
    TABLE 187. 3M: OPERATING SEGMENTS
    TABLE 188. 3M: PRODUCT PORTFOLIO
    TABLE 189. 3M: R&D EXPENDITURE, 2019–2021 ($MILLION)
    TABLE 190. 3M: NET SALES, 2019–2021 ($MILLION)
    TABLE 191. 3M: KEY STRATEGIC MOVES AND DEVELOPMENTS
    TABLE 192. ADOLF WÜRTH GMBH & CO. KG: KEY EXECUTIVES
    TABLE 193. ADOLF WÜRTH GMBH & CO. KG: COMPANY SNAPSHOT
    TABLE 194. ADOLF WÜRTH GMBH & CO. KG: OPERATING SEGMENTS
    TABLE 195. ADOLF WÜRTH GMBH & CO. KG: PRODUCT PORTFOLIO
    TABLE 196. ADOLF WÜRTH GMBH & CO. KG: R&D EXPENDITURE, 2019–2021 ($MILLION)
    TABLE 197. ADOLF WÜRTH GMBH & CO. KG: NET SALES, 2019–2021 ($MILLION)
    TABLE 198. AMTRA SP. Z O.O.: KEY EXECUTIVES
    TABLE 199. AMTRA SP. Z O.O.: COMPANY SNAPSHOT
    TABLE 200. AMTRA SP. Z O. O: PRODUCT PORTFOLIO
    TABLE 201. ARMOR ALL: KEY EXECUTIVES
    TABLE 202. ARMOR ALL: COMPANY SNAPSHOT
    TABLE 203. ARMOR ALL: PRODUCT PORTFOLIO
    TABLE 204. ARMOR ALL: KEY STRATEGIC MOVES AND DEVELOPMENTS
    TABLE 205. AUTOGLYM: KEY EXECUTIVES
    TABLE 206. AUTOGLYM: COMPANY SNAPSHOT
    TABLE 207. AUTOGLYM: PRODUCT PORTFOLIO
    TABLE 208. CARTEC BV: KEY EXECUTIVES
    TABLE 209. CARTEC BV: COMPANY SNAPSHOT
    TABLE 210. CARTEC BV: PRODUCT PORTFOLIO
    TABLE 211. CHEMICAL GUYS: KEY EXECUTIVES
    TABLE 212. CHEMICAL GUYS: COMPANY SNAPSHOT
    TABLE 213. CHEMICAL GUYS: PRODUCT PORTFOLIO
    TABLE 214. CHEMICAL GUYS: KEY STRATEGIC MOVES AND DEVELOPMENTS
    TABLE 215. ILLINOIS TOOL WORKS INC: KEY EXECUTIVES
    TABLE 216. ILLINOIS TOOL WORKS INC: COMPANY SNAPSHOT
    TABLE 217. ILLINOIS TOOL WORKS INC: PRODUCT PORTFOLIO
    TABLE 218. ILLINOIS TOOL WORKS INC: R&D EXPENDITURE, 2019–2021 ($MILLION)
    TABLE 219. ILLINOIS TOOL WORKS INC: NET SALES, 2019–2021 ($MILLION)
    TABLE 220. JOPASU INDIA PVT. LTD.: KEY EXECUTIVES
    TABLE 221. JOPASU INDIA PVT. LTD.: COMPANY SNAPSHOT
    TABLE 222. JOPASU INDIA PVT. LTD.: PRODUCT PORTFOLIO
    TABLE 223. LIQUI MOLY GMBH: KEY EXECUTIVES
    TABLE 224. LIQUI MOLY GMBH: COMPANY SNAPSHOT
    TABLE 225. LIQUI MOLY GMBH: PRODUCT PORTFOLIO
    TABLE 226. MA-FRA S.P.A.: KEY EXECUTIVES
    TABLE 227. MA-FRA S.P.A.: COMPANY SNAPSHOT
    TABLE 228. MA-FRA S.P.A.: PRODUCT PORTFOLIO
    TABLE 229. NORTHERN CAR CARE: KEY EXECUTIVES
    TABLE 230. NORTHERN CAR CARE: COMPANY SNAPSHOT
    TABLE 231. NORTHERN CAR CARE: PRODUCT PORTFOLIO
    TABLE 232. SIMONIZ USA: KEY EXECUTIVES
    TABLE 233. SIMONIZ USA: COMPANY SNAPSHOT
    TABLE 234. SIMONIZ USA: PRODUCT PORTFOLIO
    TABLE 235. SONAX: KEY EXECUTIVES
    TABLE 236. SONAX: COMPANY SNAPSHOT
    TABLE 237. SONAX: PRODUCT PORTFOLIO
    TABLE 238. TETROSYL LTD: KEY EXECUTIVES
    TABLE 239. TETROSYL LTD: COMPANY SNAPSHOT
    TABLE 240. TETROSYL LTD: PRODUCT PORTFOLIO
    TABLE 241. TURTLE WAX, INC.: KEY EXECUTIVES
    TABLE 242. TURTLE WAX, INC.: COMPANY SNAPSHOT
    TABLE 243. TURTLE WAX, INC.: PRODUCT PORTFOLIO
    TABLE 244. AUTO MAGIC: KEY EXECUTIVES
    TABLE 245. AUTO MAGIC: COMPANY SNAPSHOT
    TABLE 246. AUTO MAGIC: PRODUCT PORTFOLIO
    TABLE 247. NORTHERN CAR CARE: KEY EXECUTIVES
    TABLE 248. NORTHERN CAR CARE: COMPANY SNAPSHOT
    TABLE 249. NORTHERN CAR CARE: PRODUCT PORTFOLIO
  • LIST OF FIGURES

  • FIGURE 01. KEY MARKET SEGMENTS
    FIGURE 02. CAR CARE PRODUCT MARKET SNAPSHOT, BY SEGMENTATION, 2021-2031
    FIGURE 03. CAR CARE PRODUCT MARKET SNAPSHOT, BY REGION, 2021-2031
    FIGURE 04. TOP IMPACTING FACTORS
    FIGURE 05. TOP INVESTMENT POCKETS
    FIGURE 06. TOP WINNING STRATEGIES, BY YEAR, 2019-2022*
    FIGURE 07. TOP WINNING STRATEGIES, BY DEVELOPMENT, 2019-2022*
    FIGURE 08. TOP WINNING STRATEGIES, BY COMPANY, 2019-2022*
    FIGURE 09. MODERATE-TO-HIGH BARGAINING POWER OF SUPPLIERS
    FIGURE 10. LOW-TO-HIGH THREAT OF NEW ENTRANTS
    FIGURE 11. MODERATE-TO-HIGH THREAT OF SUBSTITUTES
    FIGURE 12. MODERATE-TO-HIGH INTENSITY OF COMPETITIVE RIVALRY
    FIGURE 13. LOW-TO-HIGH BARGAINING POWER OF BUYERS
    FIGURE 14. KEY PLAYER POSITIONING (2021)
    FIGURE 15. CAR CARE PRODUCT MARKET SHARE, BY PRODUCT TYPE, 2021-2031 (%)
    FIGURE 16. COMPARATIVE SHARE ANALYSIS OF CAR CARE PRODUCT MARKET FOR CLEANING & WASHING, BY COUNTRY, 2021 & 2031 ($MILLION)
    FIGURE 17. COMPARATIVE SHARE ANALYSIS OF CAR CARE PRODUCT MARKET FOR POLISHING & WAXING, BY COUNTRY, 2021 & 2031 ($MILLION)
    FIGURE 18. COMPARATIVE SHARE ANALYSIS OF CAR CARE PRODUCT MARKET FOR SEALING GLAZE & COATING, BY COUNTRY, 2021 & 2031 ($MILLION)
    FIGURE 19. COMPARATIVE SHARE ANALYSIS OF CAR CARE PRODUCT MARKET FOR OTHERS, BY COUNTRY, 2021 & 2031 ($MILLION)
    FIGURE 20. CAR CARE PRODUCT MARKET SHARE, BY SOLVENT, 2021-2031 (%)
    FIGURE 21. COMPARATIVE SHARE ANALYSIS OF CAR CARE PRODUCT MARKET FOR WATER-BASED, BY COUNTRY, 2021 & 2031 ($MILLION)
    FIGURE 22. COMPARATIVE SHARE ANALYSIS OF CAR CARE PRODUCT MARKET FOR FOAM-BASED, BY COUNTRY, 2021 & 2031 ($MILLION)
    FIGURE 23. CAR CARE PRODUCT MARKET SHARE, BY APPLICATION, 2021-2031 (%)
    FIGURE 24. COMPARATIVE SHARE ANALYSIS OF CAR CARE PRODUCT MARKET FOR INTERIOR, BY COUNTRY, 2021 & 2031 ($MILLION)
    FIGURE 25. COMPARATIVE SHARE ANALYSIS OF CAR CARE PRODUCT MARKET FOR EXTERIOR, BY COUNTRY, 2021 & 2031 ($MILLION)
    FIGURE 26. CAR CARE PRODUCT MARKET SHARE, BY VEHICLE TYPE, 2021-2031 (%)
    FIGURE 27. COMPARATIVE SHARE ANALYSIS OF CAR CARE PRODUCT MARKET FOR PASSENGER CARS, BY COUNTRY, 2021 & 2031 ($MILLION)
    FIGURE 28. COMPARATIVE SHARE ANALYSIS OF CAR CARE PRODUCT MARKET FOR LIGHT COMMERCIAL VEHICLES, BY COUNTRY, 2021 & 2031 ($MILLION)
    FIGURE 29. COMPARATIVE SHARE ANALYSIS OF CAR CARE PRODUCT MARKET FOR HEAVY COMMERCIAL VEHICLES, BY COUNTRY, 2021 & 2031 ($MILLION)
    FIGURE 30. CAR CARE PRODUCT MARKET SHARE, BY DISTRIBUTION CHANNEL, 2021-2031 (%)
    FIGURE 31. COMPARATIVE SHARE ANALYSIS OF CAR CARE PRODUCT MARKET FOR ONLINE, BY COUNTRY, 2021 & 2031 ($MILLION)
    FIGURE 32. COMPARATIVE SHARE ANALYSIS OF CAR CARE PRODUCT MARKET FOR OFFLINE, BY COUNTRY, 2021 & 2031 ($MILLION)
    FIGURE 33. CAR CARE PRODUCT MARKET SHARE, BY SALES CHANNEL, 2021-2031 (%)
    FIGURE 34. COMPARATIVE SHARE ANALYSIS OF CAR CARE PRODUCT MARKET FOR B2B, BY COUNTRY, 2021 & 2031 ($MILLION)
    FIGURE 35. COMPARATIVE SHARE ANALYSIS OF CAR CARE PRODUCT MARKET FOR B2C, BY COUNTRY, 2021 & 2031 ($MILLION)
    FIGURE 36. CAR CARE PRODUCT MARKET, BY REGION, 2021-2031 (%)
    FIGURE 37. COMPARATIVE SHARE ANALYSIS OF CAR CARE PRODUCT MARKET, BY COUNTRY, 2021-2031 (%)
    FIGURE 38. U.S. CAR CARE PRODUCT MARKET, 2021-2031 ($MILLION)
    FIGURE 39. CANADA CAR CARE PRODUCT MARKET, 2021-2031 ($MILLION)
    FIGURE 40. MEXICO CAR CARE PRODUCT MARKET, 2021-2031 ($MILLION)
    FIGURE 41. COMPARATIVE SHARE ANALYSIS OF CAR CARE PRODUCT MARKET, BY COUNTRY, 2021-2031 (%)
    FIGURE 42. UK CAR CARE PRODUCT MARKET, 2021-2031 ($MILLION)
    FIGURE 43. GERMANY CAR CARE PRODUCT MARKET, 2021-2031 ($MILLION)
    FIGURE 44. FRANCE CAR CARE PRODUCT MARKET, 2021-2031 ($MILLION)
    FIGURE 45. ITALY CAR CARE PRODUCT MARKET, 2021-2031 ($MILLION)
    FIGURE 46. SPAIN CAR CARE PRODUCT MARKET, 2021-2031 ($MILLION)
    FIGURE 47. RUSSIA CAR CARE PRODUCT MARKET, 2021-2031 ($MILLION)
    FIGURE 48. REST OF EUROPE CAR CARE PRODUCT MARKET, 2021-2031 ($MILLION)
    FIGURE 49. COMPARATIVE SHARE ANALYSIS OF CAR CARE PRODUCT MARKET, BY COUNTRY, 2021-2031 (%)
    FIGURE 50. CHINA CAR CARE PRODUCT MARKET, 2021-2031 ($MILLION)
    FIGURE 51. JAPAN CAR CARE PRODUCT MARKET, 2021-2031 ($MILLION)
    FIGURE 52. INDIA CAR CARE PRODUCT MARKET, 2021-2031 ($MILLION)
    FIGURE 53. AUSTRALIA CAR CARE PRODUCT MARKET, 2021-2031 ($MILLION)
    FIGURE 54. SOUTH KOREA CAR CARE PRODUCT MARKET, 2021-2031 ($MILLION)
    FIGURE 55. REST OF ASIA-PACIFIC CAR CARE PRODUCT MARKET, 2021-2031 ($MILLION)
    FIGURE 56. COMPARATIVE SHARE ANALYSIS OF CAR CARE PRODUCT MARKET, BY COUNTRY, 2021-2031 (%)
    FIGURE 57. LATIN AMERICA CAR CARE PRODUCT MARKET, 2021-2031 ($MILLION)
    FIGURE 58. MIDDLE EAST CAR CARE PRODUCT MARKET, 2021-2031 ($MILLION)
    FIGURE 59. AFRICA CAR CARE PRODUCT MARKET, 2021-2031 ($MILLION)
    FIGURE 60. 3M: R&D EXPENDITURE, 2019–2021 ($MILLION)
    FIGURE 61. 3M: REVENUE SHARE BY SEGMENT, 2021 (%)
    FIGURE 62. 3M: REVENUE SHARE BY REGION, 2021 (%)
    FIGURE 63. ADOLF WÜRTH GMBH & CO. KG: R&D EXPENDITURE, 2019–2021 ($MILLION)
    FIGURE 64. ADOLF WÜRTH GMBH & CO. KG: NET SALES, 2019–2021 ($MILLION)
    FIGURE 65. ADOLF WÜRTH GMBH & CO. KG: REVENUE SHARE BY SEGMENT, 2021 (%)
    FIGURE 66. ADOLF WÜRTH GMBH & CO. KG: REVENUE SHARE BY GEOGRAPHY, 2021 (%)
    FIGURE 67. ILLINOIS TOOL WORKS INC: R&D EXPENDITURE, 2019–2021 ($MILLION)
    FIGURE 68. ILLINOIS TOOL WORKS INC: NET SALES, 2019–2021 ($MILLION)
    FIGURE 69. ILLINOIS TOOL WORKS INC: REVENUE SHARE BY SEGMENT, 2021 (%)
    FIGURE 70. ILLINOIS TOOL WORKS INC: REVENUE SHARE BY REGION, 2021 (%)


This section provides the opinions of various top-level CXOs in the global car care product market. Hence, based on the interviews of various top-level CXOs of leading companies, increasing disposable income in developing countries, rising consumer awareness regarding vehicle repair & maintenance, and the emerging suburbanization trend represent one of the main factors fueling the market growth. For instance, according to the Organization for Economic Co-operation and Development (OECD) statistics, the disposable income in OECD countries witnessed a growth of 1.7% in 2021. In addition, according to the China government, China’s per capita disposable income observed an increase of 8.1% in 2021.

Furthermore, the growing adoption of luxury cars & sports utility vehicles (SUVs) for outdoor recreational activities leads to the need for effective car care products, propelling the demand for the car care product market. In addition, increasing awareness for maintaining car aesthetics and rise in demand for car care products worldwide as they assist in restoring the interiors, cleaning the outer body, extending the life, and adding to the value of the vehicle. For instance, in February 2021, Chemical Guys launched the HydroInterior as its latest product in advanced ceramic protection for automotive interiors. HydroInterior was a versatile interior protectant and combined the ease of use and efficiency of a quick detailer with the long-lasting protective properties of ceramic into one product designed to clean, protect, and maintain a vehicle's interior surfaces

The market growth is supplemented by factors such as stringent government regulations to replace or upgrade vehicle components, growth of automotive after sale services, and adoption of ecommerce platforms by leading players supplement the growth of the car care product market. However, volatile prices of raw materials and usage of hazardous chemicals in car care products are the factors expected to hamper the growth of the car care product market. In addition, rise in trend of vehicle customization coupled with increase in disposable income and development of anti-microbial car care products creates market opportunities for the key players operating in the car care product market.

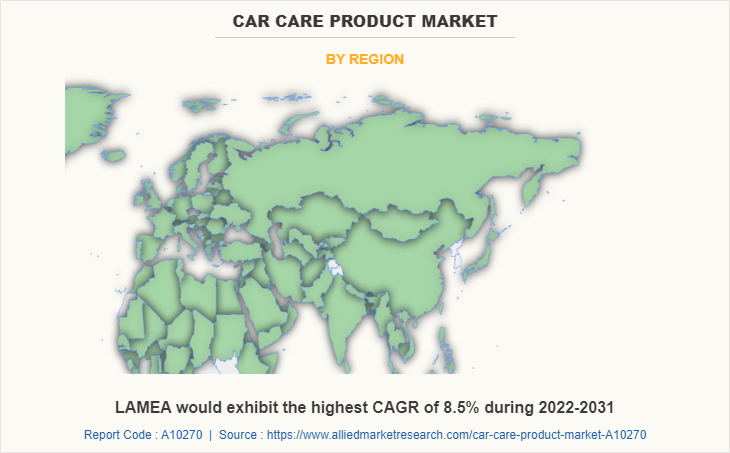
Among the analyzed regions, Asia-Pacific is the highest revenue contributor, followed by Europe, North America, and LAMEA. On the basis of forecast analysis, LAMEA is expected to lead during the forecast period, due to rising demand for private vehicles due to the increasing consumer spending and increasing consumer awareness about the maintenance of vehicles.

PURCHASE OPTIONS

Call or Email us

U.S.-Canada Toll-free: +1-800-792-5285
Int'l : +1-503-894-6022
Europe : +44-845-528-1300
Email : help@alliedmarketresearch.com
 
FREQUENTLY ASKED QUESTIONS?

A. Introduction of foam based solvents are the upcoming trends of Car Care Product Market in the world

A. Application in exterior caring are the leading application of Car Care Product Market

A. Asia-Pacific is the largest regional market for Car Care Product

A. The global car care product market was valued at $12.97 billion in 2021, and is projected to reach $22.57 billion by 2031, registering a CAGR of 5.6% from 2022 to 2031

A. The leading players operating in the car care product market are 3M, Adolf Würth GmbH & Co. KG, Amtra Sp. z o.o., ARMOR ALL, Auto Magic, Autoglym, Cartec BV, Chemical Guys, Illinois Tool Works Inc., Jopasu India Pvt. Ltd., Liqui Moly GmbH, MA-FRA S.p.A., Northern Car Care, Simoniz USA, SONAX GmbH, Tetrosyl Ltd., and Turtle Wax, Inc.

Looking for Customization?

 Customization Request

Have a Question?

 Speak with Analyst

Any Confusion?

 Inquire Before Buying

Have a glance of the Report

  Request Sample
RELATED TAGS

Purchase Full Report of
Car Care Product Market

Start reading instantly.
This Report and over 66,905+ more Reports, Available with Avenue Library. T&C*.

  • Online Only
  • $3,570
  • Online cloud access only
  • Restricted print, copy, paste & download
  • Read only
  • Free industry update
    (Within 180 days)
  • Free report update in next update cycle
    (Sep 2023 - Sep 2024)
  • Data Pack
  • $3,840
  • Restricted to one authorized user
  • One print only
  • Available in
    Excel
  • Free industry update
    (Within 180 days)
  •   Free report update in next update cycle
    (Sep 2023 - Sep 2024)
  • Single User
  • $5,730
  • Restricted to one authorized user
  • One print only
  • Available in
    PDF
  • Free industry update
    (Within 180 days)
  •   Free report update in next update cycle
    (Sep 2023 - Sep 2024)
  • Five Users
  • $6,450
  • Limited to five authorized users
  • Print upto five copies
  • Available in
    PDF
  • Free industry update
    (Within 180 days)
  •   Free report update in next update cycle
    (Sep 2023 - Sep 2024)
  • Enterprise
    License/PDF

  • $9,600
  • Unlimited
    within
    company/enterprise
  • Available in Excel & PDF
  • Free industry update
    (Within 180 days)
  •   Free report update in next update cycle
    (Sep 2023 - Sep 2024)
  • Library
    Membership

  • $999 $ 1,175
    Per User/ Per month/ Billed annually
  • Published Content
    E-access
  • Company Profiles
    E-access
  • Newly Added Content Access
  • 10 PDF
    Downloads
  • 5 Excel Data
    Pack Downloads
  • 250 Company Profiles PDF Downloads
  • Buy Now

*Taxes/Fees, if applicable will be added during checkout. All prices in USD

RELATED REPORTS
 

Why Allied Market Research?


Infallible Methodology

To ensure high-level data integrity, accurate analysis, and impeccable forecasts

Analyst Support

For complete satisfaction

Customization

On-demand customization of scope of the report to exactly meet your needs

TARGETED MARKET VIEW

Targeted market view to provide pertinent information and save time of readers

Get fresh content delivered

Get insights on topics that are crucial for your business. Stay abreast of your interest areas.

Get Industry Data Alerts

Why Allied Market Research?

Infallible Methodology

To ensure high-level data integrity, accurate analysis, and impeccable forecasts

Analyst Support

For complete satisfaction

Customization

On-demand customization of scope of the report to exactly meet your needs

TARGETED MARKET VIEW

Targeted market view to provide pertinent information and save time of readers