
Electric Bicycle Market Overview
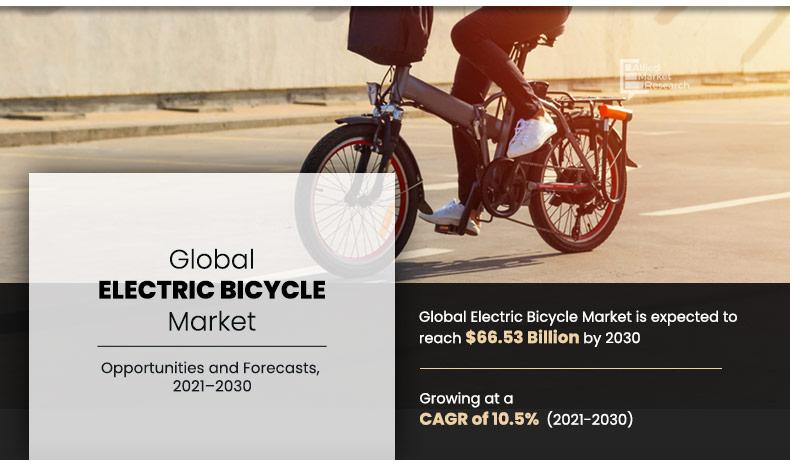
The global electric bicycle market was valued at USD 24.90 billion in 2020, and is projected to reach USD 66.53 billion by 2030, registering a CAGR of 10.5% from 2021 to 2030. Favorable policies, rising fuel prices, and growing interest in cycling for fitness are driving electric bicycle market growth. Advancements in battery tech and cycling infrastructure, along with the rise of connected e-bikes, present promising growth opportunities.
Key Market Insights
- Mid-Drive Motors Lead Market Share
Mid-drive motor systems dominated global revenue in 2020 due to better efficiency and ride quality.- Lithium-Ion Batteries to See Strong Growth
Lithium-ion battery segment is expected to grow significantly, driven by lightweight design and longer lifespan.- Fitness Applications Drive Adoption
The fitness segment contributes the most to market revenue, as electric bicycles gain popularity for health and recreational use.- Rural Consumer Segment Shows Strong Potential
Rural areas are expected to see notable growth in electric bicycle adoption, supported by affordability and last-mile utility.- High-Power E-Bicycles Gain Traction
E-bicycles with power output above 751W are anticipated to grow rapidly, catering to performance-focused and off-road users.Market Size & Forecast
- 2030 Projected Market Size: USD 66.53 billion
- 2020 Market Size: USD 24.90 billion
- Compound Annual Growth Rate (CAGR) (2021-2030): 10.5%
Introduction
An electric bicycle is integrated with an electric motor drive mechanism and battery, which produces power for causing or assisting propulsion. Moreover, it includes sensors & electric displays that provide additional assistance to riders required for a smooth ride. This helps in pedal-power of the rider. Globally, use and availability of e-bicycles are gaining a lot of momentum, owing to quickly rechargeable batteries, lightweight motors, and technological advancements of bicycle components. Presently, companies are diversifying their product portfolios through innovations & investments in connectivity applications such as V2X (vehicle-to-everything) that can protect & alert bicycle rider regarding risks & faults. For instance, Tome, a software-based company, collaborated with SAE Industry Technologies and nine other members to develop bicycle-to-vehicle (B2V) communication standard. Hence, rise in connectivity measures for bicycles are expected to positively drive the electric bicycle market.
Electric bicycles are flexible, versatile, eco-friendly, and trendy mode of transport. Consumers look up to them as an ideal substitute for scooters, smart cars, and public transportation. These bicycles help tackle traffic congestion, owing to compact size, higher speed with lesser effort, and gain from the advantages of health benefits achieved with peddling. Apart from this, adoption of e-bike applications in several sectors such as logistics and e-bike rental services, is expected to drive the market during the forecast period.
Factors such as favorable government regulations and policies to encourage electric bicycles, increased fuel costs, and rise in interest in cycling as a fitness & recreational activity is expected to drive the market growth. However, increase in purchase and maintenance cost of electric bicycles and ban on electric bikes in major cities of China hinder the market growth. Furthermore, improvements in bicycling infrastructure and battery technology and rise in trend of connected electric bicycles are expected to offer lucrative opportunities for the market growth.
Market Segmenattion
The global electric bicycle market is segmented into motor type, battery type, application, consumer segment, power output, and region. By motor type, it is fragmented into a hub motor and a mid-drive. By battery type, it is classified into lead-acid, lithium-ion (Li-ion), and others. By application, the market is divided into sports, fitness, and daily commute. By consumer segment, the market is categorized into urban and rural. By power output, it is fragmented into less than 250W, from 250W to 400W, from 401W to 750W, and above 751 W. By region, it is analyzed across North America, Europe, Asia-Pacific, and LAMEA.
By Motor Type
Mid-drive is projected as the most lucrative segments
Market Dynamics
Government authorities across the globe are actively supporting the electric bicycle industry by enacting favorable policies and providing subsidies to promote the sales of electric bicycles. It provides consumers and manufacturers with multiple benefits such as purchase incentives, zero or low registration fees, public charging benefits, and others. For instance, in 2022, the Integrated Transport Centre (ITC) of the Department of Municipalities and Transport (DMT) in Abu Dhabi, along with the Abu Dhabi Police GHQ, announced new regulations on the use of bicycles, electric bikes, and other micro-mobility devices to diversify transport means, in cooperation with relevant strategic stakeholders, and established an integrated and sustainable system that improves quality of services available to the community. Similarly, the government of Brazil also announced in its official gazette resolution RESOLU 0 GECEX N 159 to reduce current 35% import tariff of electric bicycles, starting from March 1, 2021 to 30%, starting from July 1, 2021 to 25%. On December 1, 2021, it will be reduced to 20%.
By Battery Type
Lithium Ion (Li-Ion) is projected as the most lucrative segments
Similarly, in February 2021, the Federal Legislation of U.S. introduced federal tax that offer a 30% tax credit of up to $1,500 for the purchase of electric bicycles. Similarly, in November 2020, Delhi Government (India) started providing subsidy of 25% of the cost of electric bicycles up to $75 (Rs. 5,500) and gives a fixed additional incentive of $25 (Rs. 2000). Also, there will be higher incentives for cargo electric cycles of 33% of total price. In addition, steps toward reduction of greenhouse gas emission effects such as investments & developments regarding national strategies by governments also drive growth of the electric bicycle market.
By Application
Fitness is projected as the most lucrative segments
Electric bicycles are witnessing increased popularity in Europe as they serve as the preferred mode of commute along with leisure and sports. Furthermore, increase in consumer preference toward recreational & adventure activities and rise in adoption of e-bike applications in several sectors, such as logistics and e-bike rental services, are also expected to drive the market studied during the forecast period. In addition, with growing environmental concerns, the government of Europe and environmental agencies are enacting stringent emission norms & laws that increases demand for electric bicycle in Europe.
By Consumer Segment
Rural is projected as the most lucrative segments
Furthermore, various initiatives by the government for adoption of small electric mobility in the U.S. is expected to create numerous opportunities for key players operating within the country. For instance, in October 2020, the U.S. Department for interior statement announced new rules governing electric bicycle use in the U.S. New regulations allow public land managers to provide access e-bicycles for bicycle trails.
By Power Output
Above 751W is projected as the most lucrative segments
The regulations have been agreed upon and applied by the Bureau of Land Management, National Park Service, Fish and Wildlife Service, and Bureau of Reclamation. In addition, innovations & new launches by the U.S. based companies, owing to increasing interest among youth in trekking and adventurous activities are expected to propel growth of the market during the forecast period. For instance, in September 2020, Trek Bicycle Corporation launched its latest off-road bike, E-Trek Monster. This bike is equipped with 750W snowmobile motor, which allows up to 100KM traveling range with one single charge.
By Region
LAMEA would exhibit the highest CAGR of 14.6% during 2021-2030.
Which are the Top Electric Bicycle companies
The following are the leading companies in the market. These players have adopted various strategies to increase their market penetration and strengthen their position in the electric bicycle industry.
Accell Group N.V.
CSE EV Group Co Ltd
Derby Cycle
Fuji-ta Bicycle Co Ltd
Giant Group
Merida Bikes
Royal Gazelle
Trek Bicycle Corporation
Yadea Technology Group Co., Ltd.
Yamaha Motor Corporation, USA
What are the Developments in the Electric Bicycle Market
In January 2022, Giant Group’s cycling brand Momentum launched two ultimate lightweight electric commuter bikes –Voya E+1 & Voya E+3 with 250W battery that claims to provide a range of between 40-72 km (25-45 miles) on a single charge. The company focused on its slim design, packed with the latest E-bike technology which offers hydraulic disc brakes, hidden wiring & an integrated battery, and different riding modes along with 4A fast charger that gives the battery an 80% charge in less than two hours.
In July 2021, Merida Bikes upgraded its eBIG.TOUR bicycle with more specific comfortable touring e-bike, eBIG.NINE 400 EQ, which includes powerful & super-smooth power delivery of Shimano’s EP8 motor and the overall quietness of the system.
In September 2020, Accell Group launched new e-bike, the Sparta d-burst, via live stream. With introduction of new e-bike, it is targeting commuters who use bicycles for daily commuting. Further, the new Sparta d-burst is available as an e-bike and pedelec with a total capacity of 1,125 Wh.
In July 2020, Raleigh Bicycles, the subsidiary of Derby Cycle, launched a new electric cargo bike range called Raleigh E-Cargo in the UK and Ireland. The Raleigh E-Cargo bikes are designed to carry up to 100kg weight and have a range of up to 75km (46 miles) on one single charge.
In May 2020, CSE EV Group Co., Ltd. launched 11 kinds of new e-bikes. These new e-bikes are stylish electric bicycles that come with a top design, powerful battery & motor, special details, and qualified certifications. Further, new e-bikes were launched at a competitive price in the market
What are the key top impacting factors
Key Market Driver
Favorable government regulations and policies to encourage use of electric bicycles
Governments of various countries are taking initiatives to reduce their carbon footprints by encouraging use of small electric vehicles such as electric bicycles, bikes, and scooters, owing to increase in awareness toward hazardous effects of using vehicles running on fossil fuels. Moreover, governments are constructing bicycle-friendly streets, which are encouraging individuals to opt for bicycles as a critical mode of commute.
Furthermore, to encourage the use of electric bicycles, governments worldwide are supporting the purchase of e-bicycles in terms of tax credits and incentives. For instance, in September 2020, the government of India announced a subsidy scheme in the state of Gujarat to encourage use of e-bicycles and e-rickshaws.
In addition, in October 2020, the U.S. Department of Interior statement announced new rules governing electric bicycle use in the U.S. The regulations have been agreed upon and applied by the Bureau of Land Management, National Park Service, Fish and Wildlife Service, and Bureau of Reclamation. The new regulations allow public land managers to provide e-bicycles access to bicycle trails. Furthermore, infrastructure facilities such as guarded bicycle parking facilities, construction of more bicycle (express) routes, and establishment of battery charging stations in many countries by governments significantly boost adoption of electric bicycles by users, thereby propelling the market growth.
Increase in fuel costs
Increase in fuel prices results from a surge in crude oil costs, which are majorly controlled by the Organization of the Petroleum Exporting (OPEC) countries. According to the Bicycle Industries Association (BIA) Australia, as of 2019, the number of electric bicycles imported to Australia has tripled over the past three years, owing to rise in fuel prices. Sales are growing faster than any other segment in the Australia bicycle market. Thus, increase in fuel costs over the past decade has led to a rise in adoption of electric bicycles as a mode of daily commute in several countries.
Moreover, prices are expected to increase with limited sources of crude oil in the future. Although electricity costs compared to gasoline prices have been low in many countries such as China, Germany, and Denmark, which fuels demand for electric bicycles in such countries. Furthermore, bicycles equipped with electric motors help in maintaining higher speed more effectively as well as to make rides more comfortable on rough roads. Therefore, increase in fuel cost is expected to fuel consumer inclination toward e-bicycles, thereby boosting growth of the electric bicycle market.
Restraints
High purchase and maintenance cost of electric bicycles
High cost of e-bicycles is a significant factor that restrains growth of the electric bicycle market. The cost of the battery and technology makes e-bicycles costlier compared to traditional bicycles or conventional scooters. Moreover, use of lithium-ion batteries or motor incurs maximum cost, thereby restraining the market growth. Hence, consumers find conventional bicycles superior in performance at the same or less price.
Furthermore, charging and maintenance of the battery is one of the major concerns for adopting electric bicycles. High battery pack replacement cost, owing to short life of batteries and high electric component maintenance cost, which increases the overall maintenance cost of these bicycles. Hence, surge in adoption of e-bicycles in developed countries such as China and the U.S. is limited by high prices. Therefore, high maintenance, as well as purchase cost is a significant factor that restrains growth of the market.
Opportunity
Improvement in bicycling infrastructure & battery technology
E-bicycles are less expensive when compared to motorcycles and cars, do not require a license, and can be used on existing bicycling infrastructure. Rapid urbanization and less preference of consumers to use cars, owing to increased traffic congestion are anticipated to offer lucrative opportunities for the market expansion. Across developed regions such as North America and Europe, where bicycles have dedicated lanes in cities and suburbs, several drug stores and other emergency-related services are employing e-bikes on these lanes to deliver essential services and items over short distances. For instance, Paris added 50 kilometers of bicycle lanes to cater to increase in cycle traffic and e-mobility startups, such as Bolt, further propel the market growth. In addition, governments of various countries focus on developing infrastructure for e-bicycles, including bicycle tracks and public charging stations on encouraging commuters to adopt electric bicycles. Moreover, consistent technological innovations by market players in e-bicycles propel the market growth.
For instance, in September 2020, Trek Bicycle Corporation launched its latest off-road bike, E-Trek Monster. This bike is equipped with a 750W snowmobile motor, allowing up to a 100KM traveling range with one charge. Thus, all these factors collectively are expected to offer remunerative opportunities to expand the global market during the forecast period.
Key Benefits for Stakeholders
This study presents analytical depiction of the global electric bicycle market analysis along with current trends and future estimations to depict imminent investment pockets.
The overall electric bicycle market opportunity is determined by understanding profitable trends to gain a stronger foothold.
The report presents information related to the key drivers, restraints, and opportunities of the global electric bicycle market with a detailed impact analysis.
The current electric bicycle market is quantitatively analyzed from 2020 to 2030 to benchmark the financial competency.
Porter’s five forces analysis illustrates the potency of the buyers and suppliers in the industry.
Electric Bicycle Market Report Highlights
| Aspects | Details |
| By Motor Type |
|
| By Battery Type |
|
| By Application |
|
| By Consumer Segment |
|
| By Power Output |
|
| By Region |
|
| By Key Market Players |
|
Analyst Review
Based on interviews of various top-level CXOs of leading companies, increase in government support for electric bicycles, and implementation of stringent laws toward CO2 emission drive growth of the global electric bicycle market. For instance, the government of Canada implemented the 2030 Emissions Reduction Plan with $9.1 billion in new investments to reach emissions reduction target of 40 to 45 % below 2005 levels by 2030 and put on a path to achieve net-zero emissions by 2050. Moreover, consumer inclination toward using e-bicycle as an eco-friendly and efficient solution for commute and increase in fuel costs supplement the market growth. In addition, rise in interest in cycling as a fitness and recreational activity and improvement in cycling infrastructure & battery technology fuel the market growth. Moreover, the flourishing tourism industry has prompted rise in number of tourists to opt for e-bikes as a self-driving alternative to commute due to their effortless riding experience. These bikes are also extensively used for various adventure sports, increasing their popularity among younger generation. In July 2020, Yamaha Motor Corporation, USA, revealed the all-new YDX-MORO and YDX-MORO Pro all-mountain e-bikes with a new motor and quad sensor system. The YDX-MORO and YDX-MORO Pro models deliver a new balanced power, performance, and handling for riders on all types of e-mountain bike (e-MTB) trails.
According to Paul Lee, Mark Casey, and Craig Wigginton (Global Head of Research for the technology, media, and telecommunications (TMT) industry at Deloitte), around 130 million e-bikes & e-bicycle are projected to be sold globally between 2020 and 2023. This is attributed to technological innovations in electric bicycles, making them more attractive for commuters. In addition, Ryan Citron, an analyst for Guidehouse (formerly Navigant), said he expects 113 million e-bikes and e-bicycles to be sold between 2020 and 2023.
Factors such as implementation of government regulations to encourage use of electric bicycles, consumer inclination toward use of e-bicycle as an eco-friendly & efficient solution for commute, increase in fuel costs, and rise in interest in cycling as fitness & recreational activity are expected to drive the market growth. However, high purchase & maintenance cost of electric bicycles and ban on e-bicycles in major cities of China hinder the market growth. Furthermore, improvement in bicycling infrastructure & battery technology is expected to offer lucrative opportunities for the market growth.
However, high purchase & maintenance cost of electric bicycles and ban on use of e-bicycles in major cities of China hinder the market growth. Furthermore, improvement in bicycling infrastructure & battery technology is expected to offer lucrative opportunities for the market growth.
For instance, the government of announced in the official gazette resolution RESOLU 0 GECEX N 159 to reduce the current 35% import tariff of electric bicycles, starting from March 1, 2021, to 30%, beginning on July 1, 2021, to 25%. On December 1, 2021, it will be reduced to 20%. Although, technological advancements and lightweight materials are helping the e-bike market to grow at a rapid pace.
Among the analyzed regions, Asia-Pacific is the highest revenue contributor, followed by Europe, North America, and LAMEA. By forecast analysis, LAMEA is expected to lead during the forecast period, owing to increased concerns related to the emission of hazardous pollutants, which fuels the adoption of e-bicycles in developing countries across the LAMEA.
There are certain upcoming trands in electric bicycle such as improvement in bicycling infrastructure, battery technology and ongoing R&D in the field of electric motors.
Due to the COVID-19 pandemic, commuters are mostly avoiding public transportation. E-bicycles are considered a safe, convenient, and affordable alternative to public transportation. Thus, coronavirus pandemic has changed the way people commute, and bicycling has become even more popular around the world. As a major bicycle manufacturer and with the largest market for e-bicycles, China has witnessed a growing demand in this field. Therefore, the electric bicycle industry is one of those industries that is poised for better growth post-Covid-19.
The sample for global electric bicycle market report can be obtained on demand from the AMR website. Also, the 24*7 chat support and direct call services are provided to procure the sample report.
The global electric bicycle market was valued at $24.90 billion in 2020, and is projected to reach $66.53 billion by 2030, registering a CAGR of 10.5% from 2021 to 2030
The key growth strategies adopted by the electric bicycle industry players includes collaboration, product launch, agreement and partnership. These strategies opted by various industry players is leading to the growth of the electric bicycle market as well as the players.
The company profiles of the top market players of electric bicycle industry can be obtained from the company profile section mentioned in the report. This section includes analysis of top ten player’s operating in the electric bicycle market.
Asia-PAcific region is leading the market presently in terms of revenue. However, LAMEA and Europe region is expected to provide more business opportunities for the key players operating in the global electric bicycle market.
By Battery type, others segment is expacted to gain traction over the forecast period as well as domainate the market share in the global electric bicycle market
Mexico, Vietnam, UK and Africa has wirnessed as a key matured markets growing in the global electric bicycle market
The adjacencies such as high cost of electric bicycles and ban on the use of electric bicycles in major cities of China has impacting the electric bicycle market.
Loading Table Of Content...

