0
2022
Geothermal Heat Pump Market

Geothermal Heat Pump Market

by Technology (Open Loop Systems, Closed Loop Systems), by End Use (Residential, Commercial, Industrial): Global Opportunity Analysis and Industry Forecast, 2021-2031

Report Code: A10486
Jul 2022 | Pages: 400
Tables: 348
Charts: 62
  • Formats*:

  • pdf

    Single User License, Five User
    License & Enterprise User License

  • xls

    Data Pack Excel License

  • ppt

    It comes with the additional cost
    of $2500.00 contact sales.


Geothermal Heat Pump Market Research, 2031

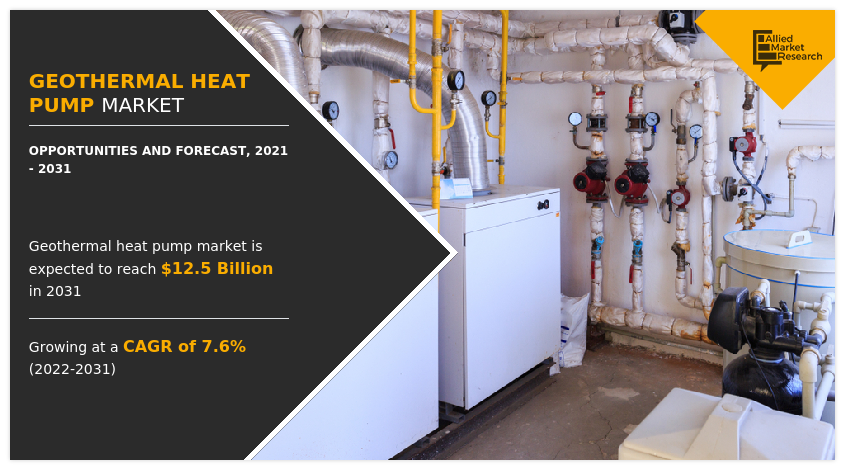
The global geothermal heat pump market size was valued at $6.0 billion in 2021, and geothermal heat pump industry is projected to reach $12.5 billion by 2031, growing at a CAGR of 7.6% from 2022 to 2031.
The COVID-19 pandemic's global crises and commercial uncertainties have had a substantial impact on the operations of many firms and their sales. The implementation of lockdown restrictions in various nations along with the closure of heat pump manufacturing operations had a detrimental effect on the expansion of the domestic heat pump market. The supply of raw materials including iron castings, stainless steel components, and aluminum tubing was further impeded by travel restrictions, a closed border, and an import-export prohibition.

Geothermal Heat Pump Market, Geothermal Heat Pump Industry, Geothermal Heat Pump Market Size, Geothermal Heat Pump Market Share, Geothermal Heat Pump Market Forecast, Geothermal Heat Pump Market Analysis, Geothermal Heat Pump Market Trends, Geothermal Heat Pump Market Growth

A geothermal heat pump is a building heating/cooling system that adopts a heat pump to transfer heat from or to the ground, taking advantage of the earth's relatively constant temperatures throughout the seasons. Additionally, geothermal heat pumps reduce energy usage and aid in reducing greenhouse gas (GHG) emissions, which benefits the market even more. In addition, a geothermal water pump has lower long-term costs than a conventional water heater system. A major obstacle to the widespread adoption of this technology in the world's major developing nations is the high installation cost of geothermal heat pump systems as well as the lack of public understanding or confidence in the benefits of geothermal heat pump systems. Geothermal heat pumps have the advantage of concentrating natural heat rather than creating heat through the burning of fossil fuels. Some of the other popular name of geothermal heat pump in various part of the world includes geoexchange, earth energy systems and earth-coupled heat pumps.

The U.S. government has favorable policies encouraging the installation of heat pumps, such as personal tax credits and direct incentives on the product installation. One of the top priorities of governments all over the world is to increase energy efficiency in all sectors of the economy. The market is expected to be driven by rise in demand for renewable energy sources and considerable government assistance in the form of subsidies, incentives, and other financial benefits during the forecast period. Global energy consumption has increased dramatically as a result of rising population and fast industrialization.

Growing use of fossil fuels for heating, such as coal, oil, and natural gas, has a detrimental effect on the environment. The demand for energy-efficient goods and solutions is anticipated to increase with growing awareness about climate change and greenhouse gas emissions. Moreover, government regulations and emission standards are projected to increase the demand for energy-saving products, such as geothermal heat pumps, in the industrial and residential sectors, thereby supporting geothermal heat pump market growth.

The geothermal heat pump market forecast is segmented on the basis of technology, end use, and region. Depending on technology, the market is categorized into open loop systems and closed loop systems (vertical loops and horizontal loops). On the basis of end use, the market is categorized into residential (new building systems and retrofit systems), commercial, and industrial. On the basis of region, the market is studied across North America, Europe, Asia-Pacific, and LAMEA.

The major players operating in the industry include, Bosch Terotechnology Ltd, Bostech Mechanical Ltd., Carrier global Corporation, Climate Master, Inc., Daikin Industries, Ltd., Danfoss Technologies, Dandelion Energy, De Dietrich Process Systems, Ecoforest S.A, Energy Smart Alternatives, GeoComfort Geothermal systems, GeoSmart Energy Inc., Maritime Geothermal Ltd., Mitsubishi Electric Corporation, Pfister’s Energy, Viessmann, and Wolf GmbH. These players have adopted product launch, acquisition, and business expansion as their key strategies to increase their market shares.
Geothermal Heat Pump Market

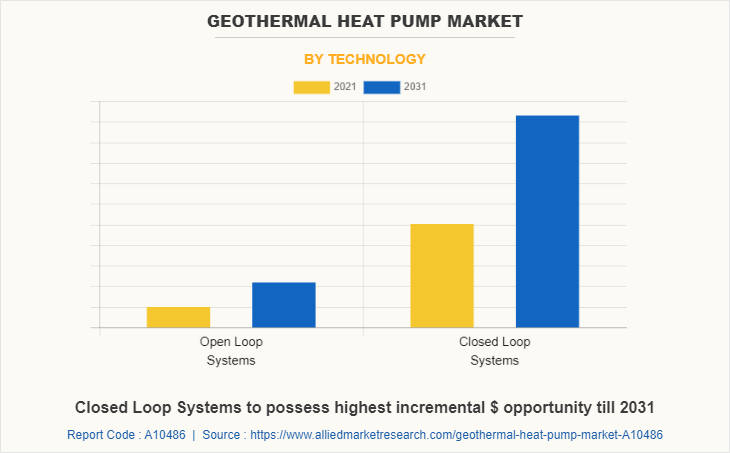
By type, the closed loop systems segment dominated the global geothermal heat pump market in 2021, and is projected to remain the fastest-growing segment during the forecast period. The closed-loop circulates water and antifreeze solution through a system of plastic pipe, which makes it of less maintenance and offer high equipment life than compared to an open loop.
Geothermal Heat Pump Market

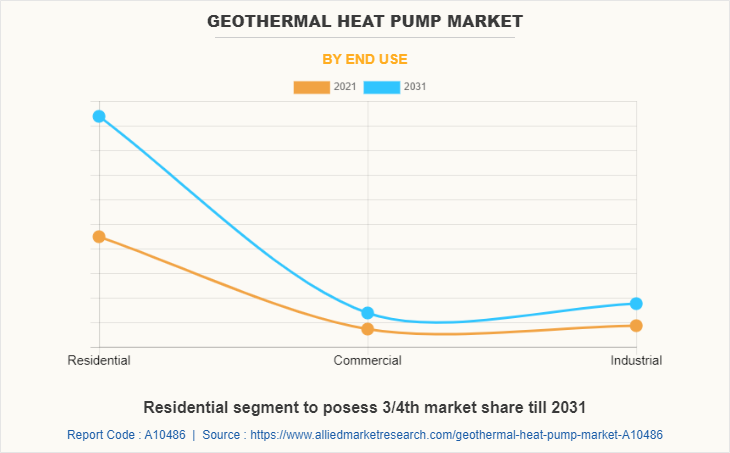
By end use, the residential segment accounted for the highest geothermal heat pump market share of around 74.3% in 2021, and is projected to maintain the same during the forecast period. The residential sector is one of the booming sectors, which is expected to propel the demand for GHP. Favorable government initiatives and tax rebates offered on the installation of energy-saving products are projected to augment the demand for GHP in the residential sector.
Geothermal Heat Pump Market

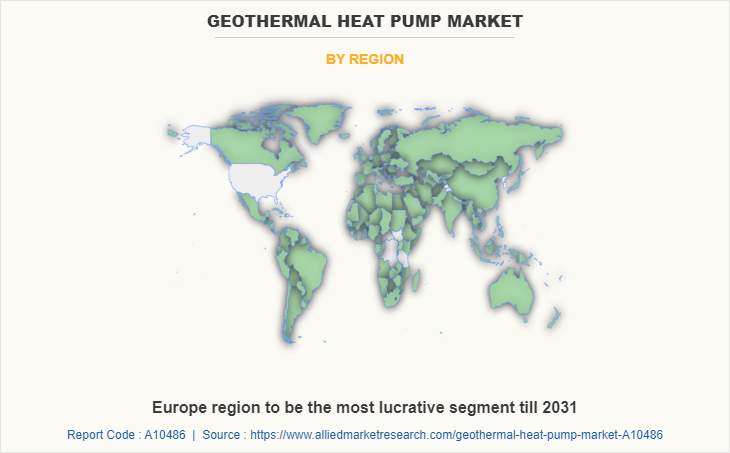
By region, Europe is projected to be the fastest growing market. Rise in expenditure toward ecological construction coupled with surging demand for heating & cooling system, are observed as the key regional drivers. Further, governments across the region are focusing on energy efficiency and reducing carbon footprints, thus further pushing the geothermal heat pump market.

IMPACT OF COVID-19 ON GEOTHERMAL HEAT PUMP MARKET

  • The outbreak of COVID-19 in China and its spread across numerous countries globally, halted the manufacturing activities of industrial sectors, which correspondingly hampered geothermal heat pump manufacturing as well. The raw material procurement was also challenged owing to the outbreak of COVID-19.
  • The COVID-19 pandemic's global crises and commercial uncertainties have had a substantial impact on the operations of many firms and their sales. The implementation of lockdown restrictions in various nations along with the closure of heat pump manufacturing operations had a detrimental effect on the expansion of the domestic heat pump market. The supply of raw materials including iron castings, stainless steel components, and aluminum tubing was further impeded by travel restrictions, a closed border, and an import-export prohibition.
  • Governments in several nations have taken steps to restart the economy and achieve the net zero carbon emission goal in the upcoming years in order to cope with the slowing business growth caused by the COVID-19 epidemic. For example, as per the news published in Electrical Times, an online news publishing platform, in 2020, the UK government issued a 10-point plan in 2020, to meet its net-zero carbon objective by 2050. The government has planned to install nearly 600,000 heat pumps by the end of 2028, along with investment in renewable energy and other low-carbon technology.

Key Benefits For Stakeholders

  • This report provides a quantitative analysis of the market segments, current trends, estimations, and dynamics of the geothermal heat pump market analysis from 2021 to 2031 to identify the prevailing geothermal heat pump market opportunities.
  • The market research is offered along with information related to key drivers, restraints, and opportunities.
  • Porter's five forces analysis highlights the potency of buyers and suppliers to enable stakeholders make profit-oriented business decisions and strengthen their supplier-buyer network.
  • In-depth analysis of the geothermal heat pump market segmentation assists to determine the prevailing market opportunities.
  • Major countries in each region are mapped according to their revenue contribution to the global market.
  • Market player positioning facilitates benchmarking and provides a clear understanding of the present position of the market players.
  • The report includes the analysis of the regional as well as global geothermal heat pump market trends, key players, market segments, application areas, and market growth strategies.

Geothermal Heat Pump Market Report Highlights

Aspects Details
By Technology
  • Open Loop Systems
  • Closed Loop Systems
    • Design
      • Vertical Loops
      • Horizontal Loops
By End Use
  • Residential
    • Installation Type
      • New Building Systems
      • Retrofit Systems
  • Commercial
  • Industrial
By Region
  • North America  (U.S., Canada, Mexico)
  • Europe  (France, Italy, Sweden, Finland, Germany, Norway, Spain, Denmark, Rest of Europe)
  • Asia-Pacific  (China, Japan, India, South Korea, Australia, Rest Of Asia Pacific)
  • LAMEA  (Saudi Arabia, South Africa, Rest of LAMEA, Brazil)
Key Market Players GeoSmart Energy, De Dietrich S.A.S., Daikin Industries Ltd., Free Energy Innovations, Bosch Thermotechnology, Wolf GmbH, ClimateMaster, Inc., GeoComfort, Maritime Geothermal Ltd, Bostech Mechanical Ltd, Sauer-Danfoss Inc., EnergySmart Alternatives, Mitsubishi Electric Corporation, Pfister Energy, Carrier Corporation, Dandelion, Ecoforest S.A.
 

CHAPTER 1:INTRODUCTION

1.1.Report description
1.2.Key benefits for stakeholders
1.3.Key market segments
1.4.Research methodology

1.4.1.Secondary research
1.4.2.Primary research
1.4.3.Analyst tools & models

CHAPTER 2:EXECUTIVE SUMMARY

2.1.Key findings

2.1.1.Top investment pockets

2.2.CXO perspective

CHAPTER 3:MARKET OVERVIEW

3.1.Market definition and scope
3.2.Key forces shaping the geothermal heat pump market
3.3.Market dynamics

3.3.1.Drivers

3.3.1.1.High adoption in the residential sector
3.3.1.2.Contribution of heat pump technology in reducing CO2 emission
3.3.1.3.Increase in demand for energy-efficient solutions
3.3.1.4.The rise in construction activity

3.3.2.Restraints

3.3.2.1.High initial costs

3.3.3.Opportunities

3.3.3.1.Increase in Integration of Internet of Things (IoT)
3.3.3.2.Increase in popularity of geothermal heat pump technology

3.4.Parent peer market overview
3.5.Patent analysis

3.5.1.Patent analysis by countries (2015-2022)

3.6.Government regulation

3.6.1.Global Warming Solutions Act -2008

3.7.COVID-19 impact analysis on the global geothermal heat pump market
3.8.Pricing analysis

CHAPTER 4:GEOTHERMAL HEAT PUMP MARKET, BY TECHNOLOGY

4.1.Overview

4.1.1.Market size and forecast

4.2.Open loop systems

4.2.1.Key market trends, growth factors, and opportunities
4.2.2.Market size and forecast, by region
4.2.3.Market analysis, by country

4.3.Closed loop systems

4.3.1.Key market trends, growth factors, and opportunities

4.3.1.1.Vertical Loops
4.3.1.2.Horizontal Loops

4.3.2.Market size and forecast, by region
4.3.3.Market analysis, by country
4.3.4.Market size and forecast, by design
4.3.5.Market size and forecast, by vertical loops systems
4.3.6.Market size and forecast, by horizontal loops

CHAPTER 5:GEOTHERMAL HEAT PUMP MARKET, BY END-USE

5.1.Overview

5.1.1.Market size and forecast

5.2.Residential

5.2.1.Key market trends, growth factors, and opportunities

5.2.1.1.New Building Systems
5.2.1.2.Retrofit Systems

5.2.2.Market size and forecast, by region
5.2.3.Market analysis, by country
5.2.4.Market size and forecast, by installation type
5.2.5.Market size and forecast, by new building systems
5.2.6.Market size and forecast, by retrofit systems

5.3.Commercial

5.3.1.Key market trends, growth factors, and opportunities
5.3.2.Market size and forecast, by region
5.3.3.Market analysis, by country

5.4.Industrial

5.4.1.Key market trends, growth factors, and opportunities
5.4.2.Market size and forecast, by region
5.4.3.Market analysis, by country

CHAPTER 6:GEOTHERMAL HEAT PUMP MARKET, BY REGION

6.1.Overview

6.1.1.Market size and forecast

6.2.North America

6.2.1.Key market trends, growth factors, and opportunities
6.2.2.Market size and forecast, by technology
6.2.3.Market size and forecast, by design
6.2.4.Market size and forecast, by end-use
6.2.5.Market size and forecast, by installation type
6.2.6.Market share analysis, by country

6.2.6.1.U.S.

6.2.6.1.1.Market size and forecast, by technology
6.2.6.1.2.Market size and forecast, by design
6.2.6.1.3.Market size and forecast, by end-use
6.2.6.1.4.Market size and forecast, by installation type

6.2.6.2.Canada

6.2.6.2.1.Market size and forecast, by technology
6.2.6.2.2.Market size and forecast, by design
6.2.6.2.3.Market size and forecast, by end-use
6.2.6.2.4.Market size and forecast, by installation type

6.2.6.3.Mexico

6.2.6.3.1.Market size and forecast, by technology
6.2.6.3.2.Market size and forecast, by design
6.2.6.3.3.Market size and forecast, by end-use
6.2.6.3.4.Market size and forecast, by installation type

6.3.Europe

6.3.1.Key market trends, growth factors, and opportunities
6.3.2.Market size and forecast, by technology
6.3.3.Market size and forecast, by design
6.3.4.Market size and forecast, by end-use
6.3.5.Market size and forecast, by installation type
6.3.6.Market share analysis, by country

6.3.6.1.Germany

6.3.6.1.1.Market size and forecast, by technology
6.3.6.1.2.Market size and forecast, by design
6.3.6.1.3.Market size and forecast, by end-use
6.3.6.1.4.Market size and forecast, by installation type

6.3.6.2.France

6.3.6.2.1.Market size and forecast, by technology
6.3.6.2.2.Market size and forecast, by design
6.3.6.2.3.Market size and forecast, by end-use
6.3.6.2.4.Market size and forecast, by installation type

6.3.6.3.Sweden

6.3.6.3.1.Market size and forecast, by technology
6.3.6.3.2.Market size and forecast, by design
6.3.6.3.3.Market size and forecast, by end-use
6.3.6.3.4.Market size and forecast, by installation type

6.3.6.4.Italy

6.3.6.4.1.Market size and forecast, by technology
6.3.6.4.2.Market size and forecast, by design
6.3.6.4.3.Market size and forecast, by end-use
6.3.6.4.4.Market size and forecast, by installation type

6.3.6.5.Spain

6.3.6.5.1.Market size and forecast, by technology
6.3.6.5.2.Market size and forecast, by design
6.3.6.5.3.Market size and forecast, by end-use
6.3.6.5.4.Market size and forecast, by installation type

6.3.6.6.Finland

6.3.6.6.1.Market size and forecast, by technology
6.3.6.6.2.Market size and forecast, by design
6.3.6.6.3.Market size and forecast, by end-use
6.3.6.6.4.Market size and forecast, by installation type

6.3.6.7.Norway

6.3.6.7.1.Market size and forecast, by technology
6.3.6.7.2.Market size and forecast, by design
6.3.6.7.3.Market size and forecast, by end-use
6.3.6.7.4.Market size and forecast, by installation type

6.3.6.8.Denmark

6.3.6.8.1.Market size and forecast, by technology
6.3.6.8.2.Market size and forecast, by design
6.3.6.8.3.Market size and forecast, by end-use
6.3.6.8.4.Market size and forecast, by installation type

6.3.6.9.Rest of Europe

6.3.6.9.1.Market size and forecast, by technology
6.3.6.9.2.Market size and forecast, by design
6.3.6.9.3.Market size and forecast, by end-use
6.3.6.9.4.Market size and forecast, by installation type

6.4.Asia-Pacific

6.4.1.Key market trends, growth factors, and opportunities
6.4.2.Market size and forecast, by technology
6.4.3.Market size and forecast, by design
6.4.4.Market size and forecast, by end-use
6.4.5.Market size and forecast, by installation type
6.4.6.Market share analysis, by country

6.4.6.1.China

6.4.6.1.1.Market size and forecast, by technology
6.4.6.1.2.Market size and forecast, by design
6.4.6.1.3.Market size and forecast, by end-use
6.4.6.1.4.Market size and forecast, by installation type

6.4.6.2.Japan

6.4.6.2.1.Market size and forecast, by technology
6.4.6.2.2.Market size and forecast, by design
6.4.6.2.3.Market size and forecast, by end-use
6.4.6.2.4.Market size and forecast, by installation type

6.4.6.3.India

6.4.6.3.1.Market size and forecast, by technology
6.4.6.3.2.Market size and forecast, by design
6.4.6.3.3.Market size and forecast, by end-use
6.4.6.3.4.Market size and forecast, by installation type

6.4.6.4.South Korea

6.4.6.4.1.Market size and forecast, by technology
6.4.6.4.2.Market size and forecast, by design
6.4.6.4.3.Market size and forecast, by end-use
6.4.6.4.4.Market size and forecast, by installation type

6.4.6.5.Australia

6.4.6.5.1.Market size and forecast, by technology
6.4.6.5.2.Market size and forecast, by design
6.4.6.5.3.Market size and forecast, by end-use
6.4.6.5.4.Market size and forecast, by installation type

6.4.6.6.Rest of Asia-Pacific

6.4.6.6.1.Market size and forecast, by technology
6.4.6.6.2.Market size and forecast, by design
6.4.6.6.3.Market size and forecast, by end-use
6.4.6.6.4.Market size and forecast, by installation type

6.5.LAMEA

6.5.1.Key market trends, growth factors, and opportunities
6.5.2.Market size and forecast, by technology
6.5.3.Market size and forecast, by design
6.5.4.Market size and forecast, by end-use
6.5.5.Market size and forecast, by installation type
6.5.6.Market share analysis, by country

6.5.6.1.Brazil

6.5.6.1.1.Market size and forecast, by technology
6.5.6.1.2.Market size and forecast, by design
6.5.6.1.3.Market size and forecast, by end-use
6.5.6.1.4.Market size and forecast, by installation type

6.5.6.2.Saudi Arabia

6.5.6.2.1.Market size and forecast, by technology
6.5.6.2.2.Market size and forecast, by design
6.5.6.2.3.Market size and forecast, by end-use
6.5.6.2.4.Market size and forecast, by installation type

6.5.6.3.South Africa

6.5.6.3.1.Market size and forecast, by technology
6.5.6.3.2.Market size and forecast, by design
6.5.6.3.3.Market size and forecast, by end-use
6.5.6.3.4.Market size and forecast, by installation type

6.5.6.4.Rest of LAMEA

6.5.6.4.1.Market size and forecast, by technology
6.5.6.4.2.Market size and forecast, by design
6.5.6.4.3.Market size and forecast, by end-use
6.5.6.4.4.Market size and forecast, by installation type

CHAPTER 7:COMPETITIVE LANDSCAPE

7.1.Introduction

7.1.1.Market player positioning, 2022

7.2.Top winning strategies

7.2.1.Top winning strategies, by year
7.2.2.Top winning strategies, by development
7.2.3.Top winning strategies, by company

7.3.Product mapping of top 10 player
7.4.Competitive heatmap
7.5.Key developments
7.5.1.New partnerships

CHAPTER 8:COMPANY PROFILES:

8.1.BOSCH THERMOTECHNOLOGY LTD

8.1.1.Company overview
8.1.2.Company snapshot
8.1.3.Product portfolio

8.2.BOSTECH MECHANICAL LTD.

8.2.1.Company overview
8.2.2.Company snapshot
8.2.3.Product portfolio

8.3.CARRIER GLOBAL CORPORATION

8.3.1.Company overview
8.3.2.Company snapshot
8.3.3.Operating business segments
8.3.4.Product portfolio
8.3.5.Business performance

8.4.DAIKIN INDUSTRIES LTD

8.4.1.Company overview
8.4.2.Company snapshot
8.4.3.Operating business segments
8.4.4.Product portfolio
8.4.5.Business performance

8.5.DANFOSS TECHNOLOGIES

8.5.1.Company overview
8.5.2.Company snapshot
8.5.3.Operating business segments
8.5.4.Product portfolio
8.5.5.Business performance

8.6.DE DIETRICH PROCESS SYSTEMS

8.6.1.Company overview
8.6.2.Company snapshot
8.6.3.Product portfolio

8.7.ECOFOREST S.A.

8.7.1.Company overview
8.7.2.Company snapshot
8.7.3.Product portfolio

8.8.ENERGY SMART ALTERNATIVES LLC

8.8.1.Company overview
8.8.2.Company snapshot
8.8.3.Product portfolio

8.9.GEOCOMFORT GEOTHERMAL SYSTEMS

8.9.1.Company overview
8.9.2.Company snapshot
8.9.3.Product portfolio

8.10.GEOSMART ENERGY INC.

8.10.1.Company overview
8.10.2.Company snapshot
8.10.3.Product portfolio

8.11.MARITIME GEOTHERMAL LTD

8.11.1.Company overview
8.11.2.Company snapshot
8.11.3.Product portfolio

8.12.MITSUBISHI ELECTRIC CORPORATION

8.12.1.Company overview
8.12.2.Company snapshot
8.12.3.Operating business segments
8.12.4.Product portfolio
8.12.5.Business performance

8.13.PFISTER ENERGY’S

8.13.1.Company overview
8.13.2.Company snapshot
8.13.3.Product portfolio

8.14.VIESSMANN

8.14.1.Company overview
8.14.2.Company snapshot
8.14.3.Product portfolio

8.15.WOLF GmbH

8.15.1.Company overview
8.15.2.Company snapshot
8.15.3.Product portfolio

CHAPTER 9:KEY INNOVATOR PROFILES

9.1.CLIMATEMASTER INC.

9.1.1.Company overview
9.1.2.Company snapshot
9.1.3.Product portfolio
9.1.4.AMR Perspective- ClimateMaster Inc. Innovation and Its Impact on the Market

9.2.DANDELION ENERGY

9.2.1.Company overview
9.2.2.Company snapshot
9.2.3.Product portfolio
9.2.4.Key strategic moves and developments
9.2.5.AMR Perspective- Dandelion Energy Innovation and Its Impact on the Market

LIST OF TABLES

  • TABLE 01. GEOTHERMAL HEAT PUMP MARKET, BY TECHNOLOGY, 2021-2031 (THOUSAND UNITS)
    TABLE 02. GEOTHERMAL HEAT PUMP MARKET, BY TECHNOLOGY, 2021-2031 ($MILLION)
    TABLE 03. GEOTHERMAL HEAT PUMP MARKET FOR OPEN LOOP SYSTEMS, BY REGION, 2021-2031 (THOUSAND UNITS)
    TABLE 04. GEOTHERMAL HEAT PUMP MARKET FOR OPEN LOOP SYSTEMS, BY REGION, 2021–2031 ($MILLION)
    TABLE 05. GEOTHERMAL HEAT PUMP MARKET FOR CLOSED LOOP SYSTEMS, BY REGION, 2021-2031 (THOUSAND UNITS)
    TABLE 06. GEOTHERMAL HEAT PUMP MARKET FOR CLOSED LOOP SYSTEMS, BY REGION, 2021-2031 ($MILLION)
    TABLE 07. CLOSED LOOP SYSTEMS GEOTHERMAL HEAT PUMP MARKET, BY DESIGN, 2021-2031 (THOUSAND UNITS)
    TABLE 08. CLOSED LOOP SYSTEMS GEOTHERMAL HEAT PUMP MARKET, BY DESIGN, 2021-2031 ($MILLION)
    TABLE 09. GEOTHERMAL HEAT PUMP MARKET FOR VERTICAL LOOPS SYSTEMS, BY REGION, 2021-2031 (THOUSAND UNITS)
    TABLE 10. GEOTHERMAL HEAT PUMP MARKET FOR VERTICAL LOOPS SYSTEMS, BY REGION, 2021-2031 ($MILLION)
    TABLE 11. GEOTHERMAL HEAT PUMP MARKET FOR HORIZONTAL LOOPS, BY REGION, 2021-2031 (THOUSAND UNITS)
    TABLE 12. GEOTHERMAL HEAT PUMP MARKET FOR HORIZONTAL LOOPS, BY REGION, 2021-2031 ($MILLION)
    TABLE 13. GEOTHERMAL HEAT PUMP MARKET, BY END-USE, 2021–2031 (THOUSAND UNITS)
    TABLE 14. GEOTHERMAL HEAT PUMP MARKET, BY END-USE, 2021–2031 ($MILLION)
    TABLE 15. GEOTHERMAL HEAT PUMP MARKET FOR RESIDENTIAL, BY REGION, 2021–2031 (THOUSAND UNITS)
    TABLE 16. GEOTHERMAL HEAT PUMP MARKET FOR RESIDENTIAL, BY REGION, 2021–2031 ($MILLION)
    TABLE 17. RESIDENTIAL GEOTHERMAL HEAT PUMP MARKET, BY INSTALLATION TYPE, 2021–2031 (THOUSAND UNITS)
    TABLE 18. RESIDENTIAL GEOTHERMAL HEAT PUMP MARKET, BY INSTALLATION TYPE, 2021–2031 ($MILLION)
    TABLE 19. RESIDENTIAL GEOTHERMAL HEAT PUMP MARKET FOR NEW BUILDING SYSTEMS, BY REGION, 2021–2031 (THOUSAND UNITS)
    TABLE 20. RESIDENTIAL GEOTHERMAL HEAT PUMP MARKET FOR NEW BUILDING SYSTEMS, BY REGION, 2021–2031 ($MILLION)
    TABLE 21. RESIDENTIAL GEOTHERMAL HEAT PUMP MARKET FOR RETROFIT SYSTEMS, BY REGION, 2021–2031 (THOUSAND UNITS)
    TABLE 22. RESIDENTIAL GEOTHERMAL HEAT PUMP MARKET FOR RETROFIT SYSTEMS, BY REGION, 2021–2031 ($MILLION)
    TABLE 23. GEOTHERMAL HEAT PUMP MARKET, FOR COMMERCIAL END-USE, BY REGION, 2021–2031 (THOUSAND UNITS)
    TABLE 24. GEOTHERMAL HEAT PUMP MARKET, FOR COMMERCIAL END-USE, BY REGION, 2021–2031 ($MILLION)
    TABLE 25. GEOTHERMAL HEAT PUMP MARKET FOR INDUSTRIAL END-USE, BY REGION, 2021–2031 (THOUSAND UNITS)
    TABLE 26. GEOTHERMAL HEAT PUMP MARKET FOR INDUSTRIAL END-USE, BY REGION, 2021–2031 ($MILLION)
    TABLE 27. GEOTHERMAL HEAT PUMP MARKET, BY REGION, 2021-2031(THOUSAND UNITS)
    TABLE 28. GEOTHERMAL HEAT PUMP MARKET, BY REGION, 2021-2031($MILLION)
    TABLE 29. NORTH AMERICA GEOTHERMAL HEAT PUMP MARKET, BY TECHNOLOGY, 2021-2031(THOUSAND UNITS)
    TABLE 30. NORTH AMERICA GEOTHERMAL HEAT PUMP MARKET, BY TECHNOLOGY, 2021-2031($MILLION)
    TABLE 31. NORTH AMERICA CLOSED LOOP SYSTEMS GEOTHERMAL HEAT PUMP MARKET, BY DESIGN, 2021-2031(THOUSAND UNITS)
    TABLE 32. NORTH AMERICA CLOSED LOOP SYSTEMS GEOTHERMAL HEAT PUMP MARKET, BY DESIGN, 2021-2031($MILLION)
    TABLE 33. NORTH AMERICA GEOTHERMAL HEAT PUMP MARKET, BY END-USE, 2021-2031(THOUSAND UNITS)
    TABLE 34. NORTH AMERICA GEOTHERMAL HEAT PUMP MARKET, BY END-USE, 2021-2031($MILLION)
    TABLE 35. NORTH AMERICA RESIDENTIAL GEOTHERMAL HEAT PUMP MARKET, BY INSTALLATION TYPE, 2021-2031(THOUSAND UNITS)
    TABLE 36. NORTH AMERICA RESIDENTIAL GEOTHERMAL HEAT PUMP MARKET, BY INSTALLATION TYPE, 2021-2031($MILLION)
    TABLE 37. NORTH AMERICA GEOTHERMAL HEAT PUMP MARKET, BY COUNTRY, 2021-2031(THOUSAND UNITS)
    TABLE 38. NORTH AMERICA GEOTHERMAL HEAT PUMP MARKET, BY COUNTRY, 2021-2031($MILLION)
    TABLE 39. U.S. GEOTHERMAL HEAT PUMP MARKET, BY TECHNOLOGY, 2021-2031(THOUSAND UNITS)
    TABLE 40. U.S. GEOTHERMAL HEAT PUMP MARKET, TECHNOLOGY, 2021-2031($MILLION)
    TABLE 41. U.S. CLOSED LOOP SYSTEMS GEOTHERMAL HEAT PUMP MARKET, BY DESIGN, 2021-2031(THOUSAND UNITS)
    TABLE 42. U.S. CLOSED LOOP SYSTEMS GEOTHERMAL HEAT PUMP MARKET, BY DESIGN, 2021-2031($MILLION)
    TABLE 43. U.S. GEOTHERMAL HEAT PUMP MARKET, BY END-USE, 2021-2031(THOUSAND UNITS)
    TABLE 44. U.S. GEOTHERMAL HEAT PUMP MARKET, BY END-USE, 2021-2031($MILLION)
    TABLE 45. U.S. RESIDENTIAL GEOTHERMAL HEAT PUMP MARKET, BY INSTALLATION TYPE, 2021-2031(THOUSAND UNITS)
    TABLE 46. U.S. RESIDENTIAL GEOTHERMAL HEAT PUMP MARKET, BY INSTALLATION TYPE, 2021-2031($MILLION)
    TABLE 47. CANADA GEOTHERMAL HEAT PUMP MARKET, BY TECHNOLOGY, 2021-2031(THOUSAND UNITS)
    TABLE 48. CANADA GEOTHERMAL HEAT PUMP MARKET, TECHNOLOGY, 2021-2031($MILLION)
    TABLE 49. CANADA CLOSED LOOP SYSTEMS GEOTHERMAL HEAT PUMP MARKET, BY DESIGN, 2021-2031(THOUSAND UNITS)
    TABLE 50. CANADA CLOSED LOOP SYSTEMS GEOTHERMAL HEAT PUMP MARKET, BY DESIGN, 2021-2031($MILLION)
    TABLE 51. CANADA GEOTHERMAL HEAT PUMP MARKET, BY END-USE, 2021-2031(THOUSAND UNITS)
    TABLE 52. CANADA GEOTHERMAL HEAT PUMP MARKET, BY END-USE, 2021-2031($MILLION)
    TABLE 53. CANADA RESIDENTIAL GEOTHERMAL HEAT PUMP MARKET, BY INSTALLATION TYPE, 2021-2031(THOUSAND UNITS)
    TABLE 54. CANADA RESIDENTIAL GEOTHERMAL HEAT PUMP MARKET, BY INSTALLATION TYPE, 2021-2031($MILLION)
    TABLE 55. MEXICO GEOTHERMAL HEAT PUMP MARKET, BY TECHNOLOGY, 2021-2031(THOUSAND UNITS)
    TABLE 56. MEXICO GEOTHERMAL HEAT PUMP MARKET, TECHNOLOGY, 2021-2031($MILLION)
    TABLE 57. MEXICO CLOSED LOOP SYSTEMS GEOTHERMAL HEAT PUMP MARKET, BY DESIGN, 2021-2031(THOUSAND UNITS)
    TABLE 58. MEXICO CLOSED LOOP SYSTEMS GEOTHERMAL HEAT PUMP MARKET, BY DESIGN, 2021-2031($MILLION)
    TABLE 59. MEXICO GEOTHERMAL HEAT PUMP MARKET, BY END-USE, 2021-2031(THOUSAND UNITS)
    TABLE 60. MEXICO GEOTHERMAL HEAT PUMP MARKET, BY END-USE, 2021-2031($MILLION)
    TABLE 61. MEXICO RESIDENTIAL GEOTHERMAL HEAT PUMP MARKET, BY INSTALLATION TYPE, 2021-2031(THOUSAND UNITS)
    TABLE 62. MEXICO RESIDENTIAL GEOTHERMAL HEAT PUMP MARKET, BY INSTALLATION TYPE, 2021-2031($MILLION)
    TABLE 63. EUROPE GEOTHERMAL HEAT PUMP MARKET, BY TECHNOLOGY, 2021-2031(THOUSAND UNITS)
    TABLE 64. EUROPE GEOTHERMAL HEAT PUMP MARKET, BY TECHNOLOGY, 2021-2031($MILLION)
    TABLE 65. EUROPE CLOSED LOOP SYSTEMS GEOTHERMAL HEAT PUMP MARKET, BY DESIGN, 2021-2031(THOUSAND UNITS)
    TABLE 66. EUROPE CLOSED LOOP SYSTEMS GEOTHERMAL HEAT PUMP MARKET, BY DESIGN, 2021-2031($MILLION)
    TABLE 67. EUROPE GEOTHERMAL HEAT PUMP MARKET, BY END-USE, 2021-2031(THOUSAND UNITS)
    TABLE 68. EUROPE GEOTHERMAL HEAT PUMP MARKET, BY END-USE, 2021-2031($MILLION)
    TABLE 69. EUROPE RESIDENTIAL GEOTHERMAL HEAT PUMP MARKET, BY INSTALLATION TYPE, 2021-2031(THOUSAND UNITS)
    TABLE 70. EUROPE RESIDENTIAL GEOTHERMAL HEAT PUMP MARKET, BY INSTALLATION TYPE, 2021-2031($MILLION)
    TABLE 71. EUROPE GEOTHERMAL HEAT PUMP MARKET, BY COUNTRY, 2021-2031(THOUSAND UNITS)
    TABLE 72. EUROPE GEOTHERMAL HEAT PUMP MARKET, BY COUNTRY, 2021-2031($MILLION)
    TABLE 73. GERMANY GEOTHERMAL HEAT PUMP MARKET, BY TECHNOLOGY, 2021-2031(THOUSAND UNITS)
    TABLE 74. GERMANY GEOTHERMAL HEAT PUMP MARKET, TECHNOLOGY, 2021-2031($MILLION)
    TABLE 75. GERMANY CLOSED LOOP SYSTEMS GEOTHERMAL HEAT PUMP MARKET, BY DESIGN, 2021-2031(THOUSAND UNITS)
    TABLE 76. GERMANY CLOSED LOOP SYSTEMS GEOTHERMAL HEAT PUMP MARKET, BY DESIGN, 2021-2031($MILLION)
    TABLE 77. GERMANY GEOTHERMAL HEAT PUMP MARKET, BY END-USE, 2021-2031(THOUSAND UNITS)
    TABLE 78. GERMANY GEOTHERMAL HEAT PUMP MARKET, BY END-USE, 2021-2031($MILLION)
    TABLE 79. GERMANY RESIDENTIAL GEOTHERMAL HEAT PUMP MARKET, BY INSTALLATION TYPE, 2021-2031(THOUSAND UNITS)
    TABLE 80. GERMANY RESIDENTIAL GEOTHERMAL HEAT PUMP MARKET, BY INSTALLATION TYPE, 2021-2031($MILLION)
    TABLE 81. FRANCE GEOTHERMAL HEAT PUMP MARKET, BY TECHNOLOGY, 2021-2031(THOUSAND UNITS)
    TABLE 82. FRANCE GEOTHERMAL HEAT PUMP MARKET, TECHNOLOGY, 2021-2031($MILLION)
    TABLE 83. FRANCE CLOSED LOOP SYSTEMS GEOTHERMAL HEAT PUMP MARKET, BY DESIGN, 2021-2031(THOUSAND UNITS)
    TABLE 84. FRANCE CLOSED LOOP SYSTEMS GEOTHERMAL HEAT PUMP MARKET, BY DESIGN, 2021-2031($MILLION)
    TABLE 85. FRANCE GEOTHERMAL HEAT PUMP MARKET, BY END-USE, 2021-2031(THOUSAND UNITS)
    TABLE 86. FRANCE GEOTHERMAL HEAT PUMP MARKET, BY END-USE, 2021-2031($MILLION)
    TABLE 87. FRANCE RESIDENTIAL GEOTHERMAL HEAT PUMP MARKET, BY INSTALLATION TYPE, 2021-2031(THOUSAND UNITS)
    TABLE 88. FRANCE RESIDENTIAL GEOTHERMAL HEAT PUMP MARKET, BY INSTALLATION TYPE, 2021-2031($MILLION)
    TABLE 89. SWEDEN GEOTHERMAL HEAT PUMP MARKET, BY TECHNOLOGY, 2021-2031(THOUSAND UNITS)
    TABLE 90. SWEDEN GEOTHERMAL HEAT PUMP MARKET, TECHNOLOGY, 2021-2031($MILLION)
    TABLE 91. SWEDEN CLOSED LOOP SYSTEMS GEOTHERMAL HEAT PUMP MARKET, BY DESIGN, 2021-2031(THOUSAND UNITS)
    TABLE 92. SWEDEN CLOSED LOOP SYSTEMS GEOTHERMAL HEAT PUMP MARKET, BY DESIGN, 2021-2031($MILLION)
    TABLE 93. SWEDEN GEOTHERMAL HEAT PUMP MARKET, BY END-USE, 2021-2031(THOUSAND UNITS)
    TABLE 94. SWEDEN GEOTHERMAL HEAT PUMP MARKET, BY END-USE, 2021-2031($MILLION)
    TABLE 95. SWEDEN RESIDENTIAL GEOTHERMAL HEAT PUMP MARKET, BY INSTALLATION TYPE, 2021-2031(THOUSAND UNITS)
    TABLE 96. SWEDEN RESIDENTIAL GEOTHERMAL HEAT PUMP MARKET, BY INSTALLATION TYPE, 2021-2031($MILLION)
    TABLE 97. ITALY GEOTHERMAL HEAT PUMP MARKET, BY TECHNOLOGY, 2021-2031(THOUSAND UNITS)
    TABLE 98. ITALY GEOTHERMAL HEAT PUMP MARKET, TECHNOLOGY, 2021-2031($MILLION)
    TABLE 99. ITALY CLOSED LOOP SYSTEMS GEOTHERMAL HEAT PUMP MARKET, BY DESIGN, 2021-2031(THOUSAND UNITS)
    TABLE 100. ITALY CLOSED LOOP SYSTEMS GEOTHERMAL HEAT PUMP MARKET, BY DESIGN, 2021-2031($MILLION)
    TABLE 101. ITALY GEOTHERMAL HEAT PUMP MARKET, BY END-USE, 2021-2031(THOUSAND UNITS)
    TABLE 102. ITALY GEOTHERMAL HEAT PUMP MARKET, BY END-USE, 2021-2031($MILLION)
    TABLE 103. ITALY RESIDENTIAL GEOTHERMAL HEAT PUMP MARKET, BY INSTALLATION TYPE, 2021-2031(THOUSAND UNITS)
    TABLE 104. ITALY RESIDENTIAL GEOTHERMAL HEAT PUMP MARKET, BY INSTALLATION TYPE, 2021-2031($MILLION)
    TABLE 105. SPAIN GEOTHERMAL HEAT PUMP MARKET, BY TECHNOLOGY, 2021-2031(THOUSAND UNITS)
    TABLE 106. SPAIN GEOTHERMAL HEAT PUMP MARKET, TECHNOLOGY, 2021-2031($MILLION)
    TABLE 107. SPAIN CLOSED LOOP SYSTEMS GEOTHERMAL HEAT PUMP MARKET, BY DESIGN, 2021-2031(THOUSAND UNITS)
    TABLE 108. SPAIN CLOSED LOOP SYSTEMS GEOTHERMAL HEAT PUMP MARKET, BY DESIGN, 2021-2031($MILLION)
    TABLE 109. SPAIN GEOTHERMAL HEAT PUMP MARKET, BY END-USE, 2021-2031(THOUSAND UNITS)
    TABLE 110. SPAIN GEOTHERMAL HEAT PUMP MARKET, BY END-USE, 2021-2031($MILLION)
    TABLE 111. SPAIN RESIDENTIAL GEOTHERMAL HEAT PUMP MARKET, BY INSTALLATION TYPE, 2021-2031(THOUSAND UNITS)
    TABLE 112. SPAIN RESIDENTIAL GEOTHERMAL HEAT PUMP MARKET, BY INSTALLATION TYPE, 2021-2031($MILLION)
    TABLE 113. FINLAND GEOTHERMAL HEAT PUMP MARKET, BY TECHNOLOGY, 2021-2031(THOUSAND UNITS)
    TABLE 114. FINLAND GEOTHERMAL HEAT PUMP MARKET, TECHNOLOGY, 2021-2031($MILLION)
    TABLE 115. FINLAND CLOSED LOOP SYSTEMS GEOTHERMAL HEAT PUMP MARKET, BY DESIGN, 2021-2031(THOUSAND UNITS)
    TABLE 116. FINLAND CLOSED LOOP SYSTEMS GEOTHERMAL HEAT PUMP MARKET, BY DESIGN, 2021-2031($MILLION)
    TABLE 117. FINLAND GEOTHERMAL HEAT PUMP MARKET, BY END-USE, 2021-2031(THOUSAND UNITS)
    TABLE 118. FINLAND GEOTHERMAL HEAT PUMP MARKET, BY END-USE, 2021-2031($MILLION)
    TABLE 119. FINLAND RESIDENTIAL GEOTHERMAL HEAT PUMP MARKET, BY INSTALLATION TYPE, 2021-2031(THOUSAND UNITS)
    TABLE 120. FINLAND RESIDENTIAL GEOTHERMAL HEAT PUMP MARKET, BY INSTALLATION TYPE, 2021-2031($MILLION)
    TABLE 121. NORWAY GEOTHERMAL HEAT PUMP MARKET, BY TECHNOLOGY, 2021-2031(THOUSAND UNITS)
    TABLE 122. NORWAY GEOTHERMAL HEAT PUMP MARKET, TECHNOLOGY, 2021-2031($MILLION)
    TABLE 123. NORWAY CLOSED LOOP SYSTEMS GEOTHERMAL HEAT PUMP MARKET, BY DESIGN, 2021-2031(THOUSAND UNITS)
    TABLE 124. NORWAY CLOSED LOOP SYSTEMS GEOTHERMAL HEAT PUMP MARKET, BY DESIGN, 2021-2031($MILLION)
    TABLE 125. NORWAY GEOTHERMAL HEAT PUMP MARKET, BY END-USE, 2021-2031(THOUSAND UNITS)
    TABLE 126. NORWAY GEOTHERMAL HEAT PUMP MARKET, BY END-USE, 2021-2031($MILLION)
    TABLE 127. NORWAY RESIDENTIAL GEOTHERMAL HEAT PUMP MARKET, BY INSTALLATION TYPE, 2021-2031(THOUSAND UNITS)
    TABLE 128. NORWAY RESIDENTIAL GEOTHERMAL HEAT PUMP MARKET, BY INSTALLATION TYPE, 2021-2031($MILLION)
    TABLE 129. DENMARK GEOTHERMAL HEAT PUMP MARKET, BY TECHNOLOGY, 2021-2031(THOUSAND UNITS)
    TABLE 130. DENMARK GEOTHERMAL HEAT PUMP MARKET, TECHNOLOGY, 2021-2031($MILLION)
    TABLE 131. DENMARK CLOSED LOOP SYSTEMS GEOTHERMAL HEAT PUMP MARKET, BY DESIGN, 2021-2031(THOUSAND UNITS)
    TABLE 132. DENMARK CLOSED LOOP SYSTEMS GEOTHERMAL HEAT PUMP MARKET, BY DESIGN, 2021-2031($MILLION)
    TABLE 133. DENMARK GEOTHERMAL HEAT PUMP MARKET, BY END-USE, 2021-2031(THOUSAND UNITS)
    TABLE 134. DENMARK GEOTHERMAL HEAT PUMP MARKET, BY END-USE, 2021-2031($MILLION)
    TABLE 135. DENMARK RESIDENTIAL GEOTHERMAL HEAT PUMP MARKET, BY INSTALLATION TYPE, 2021-2031(THOUSAND UNITS)
    TABLE 136. DENMARK RESIDENTIAL GEOTHERMAL HEAT PUMP MARKET, BY INSTALLATION TYPE, 2021-2031($MILLION)
    TABLE 137. REST OF EUROPE GEOTHERMAL HEAT PUMP MARKET, BY TECHNOLOGY, 2021-2031(THOUSAND UNITS)
    TABLE 138. REST OF EUROPE GEOTHERMAL HEAT PUMP MARKET, TECHNOLOGY, 2021-2031($MILLION)
    TABLE 139. REST OF EUROPE CLOSED LOOP SYSTEMS GEOTHERMAL HEAT PUMP MARKET, BY DESIGN, 2021-2031(THOUSAND UNITS)
    TABLE 140. REST OF EUROPE CLOSED LOOP SYSTEMS GEOTHERMAL HEAT PUMP MARKET, BY DESIGN, 2021-2031($MILLION)
    TABLE 141. REST OF EUROPE GEOTHERMAL HEAT PUMP MARKET, BY END-USE, 2021-2031(THOUSAND UNITS)
    TABLE 142. REST OF EUROPE GEOTHERMAL HEAT PUMP MARKET, BY END-USE, 2021-2031($MILLION)
    TABLE 143. REST OF EUROPE RESIDENTIAL GEOTHERMAL HEAT PUMP MARKET, BY INSTALLATION TYPE, 2021-2031(THOUSAND UNITS)
    TABLE 144. REST OF EUROPE RESIDENTIAL GEOTHERMAL HEAT PUMP MARKET, BY INSTALLATION TYPE, 2021-2031($MILLION)
    TABLE 145. ASIA-PACIFIC GEOTHERMAL HEAT PUMP MARKET, BY TECHNOLOGY, 2021-2031(THOUSAND UNITS)
    TABLE 146. ASIA-PACIFIC GEOTHERMAL HEAT PUMP MARKET, BY TECHNOLOGY, 2021-2031($MILLION)
    TABLE 147. ASIA-PACIFIC CLOSED LOOP SYSTEMS GEOTHERMAL HEAT PUMP MARKET, BY DESIGN, 2021-2031(THOUSAND UNITS)
    TABLE 148. ASIA-PACIFIC CLOSED LOOP SYSTEMS GEOTHERMAL HEAT PUMP MARKET, BY DESIGN, 2021-2031($MILLION)
    TABLE 149. ASIA-PACIFIC GEOTHERMAL HEAT PUMP MARKET, BY END-USE, 2021-2031(THOUSAND UNITS)
    TABLE 150. ASIA-PACIFIC GEOTHERMAL HEAT PUMP MARKET, BY END-USE, 2021-2031($MILLION)
    TABLE 151. ASIA-PACIFIC RESIDENTIAL GEOTHERMAL HEAT PUMP MARKET, BY INSTALLATION TYPE, 2021-2031(THOUSAND UNITS)
    TABLE 152. ASIA-PACIFIC RESIDENTIAL GEOTHERMAL HEAT PUMP MARKET, BY INSTALLATION TYPE, 2021-2031($MILLION)
    TABLE 153. ASIA-PACIFIC GEOTHERMAL HEAT PUMP MARKET, BY COUNTRY, 2021-2031(THOUSAND UNITS)
    TABLE 154. ASIA-PACIFIC GEOTHERMAL HEAT PUMP MARKET, BY COUNTRY, 2021-2031($MILLION)
    TABLE 155. CHINA GEOTHERMAL HEAT PUMP MARKET, BY TECHNOLOGY, 2021-2031(THOUSAND UNITS)
    TABLE 156. CHINA GEOTHERMAL HEAT PUMP MARKET, TECHNOLOGY, 2021-2031($MILLION)
    TABLE 157. CHINA CLOSED LOOP SYSTEMS GEOTHERMAL HEAT PUMP MARKET, BY DESIGN, 2021-2031(THOUSAND UNITS)
    TABLE 158. CHINA CLOSED LOOP SYSTEMS GEOTHERMAL HEAT PUMP MARKET, BY DESIGN, 2021-2031($MILLION)
    TABLE 159. CHINA GEOTHERMAL HEAT PUMP MARKET, BY END-USE, 2021-2031(THOUSAND UNITS)
    TABLE 160. CHINA GEOTHERMAL HEAT PUMP MARKET, BY END-USE, 2021-2031($MILLION)
    TABLE 161. CHINA RESIDENTIAL GEOTHERMAL HEAT PUMP MARKET, BY INSTALLATION TYPE, 2021-2031(THOUSAND UNITS)
    TABLE 162. CHINA RESIDENTIAL GEOTHERMAL HEAT PUMP MARKET, BY INSTALLATION TYPE, 2021-2031($MILLION)
    TABLE 163. JAPAN GEOTHERMAL HEAT PUMP MARKET, BY TECHNOLOGY, 2021-2031(THOUSAND UNITS)
    TABLE 164. JAPAN GEOTHERMAL HEAT PUMP MARKET, TECHNOLOGY, 2021-2031($MILLION)
    TABLE 165. JAPAN CLOSED LOOP SYSTEMS GEOTHERMAL HEAT PUMP MARKET, BY DESIGN, 2021-2031(THOUSAND UNITS)
    TABLE 166. JAPAN CLOSED LOOP SYSTEMS GEOTHERMAL HEAT PUMP MARKET, BY DESIGN, 2021-2031($MILLION)
    TABLE 167. JAPAN GEOTHERMAL HEAT PUMP MARKET, BY END-USE, 2021-2031(THOUSAND UNITS)
    TABLE 168. JAPAN GEOTHERMAL HEAT PUMP MARKET, BY END-USE, 2021-2031($MILLION)
    TABLE 169. JAPAN RESIDENTIAL GEOTHERMAL HEAT PUMP MARKET, BY INSTALLATION TYPE, 2021-2031(THOUSAND UNITS)
    TABLE 170. JAPAN RESIDENTIAL GEOTHERMAL HEAT PUMP MARKET, BY INSTALLATION TYPE, 2021-2031($MILLION)
    TABLE 171. INDIA GEOTHERMAL HEAT PUMP MARKET, BY TECHNOLOGY, 2021-2031(THOUSAND UNITS)
    TABLE 172. INDIA GEOTHERMAL HEAT PUMP MARKET, TECHNOLOGY, 2021-2031($MILLION)
    TABLE 173. INDIA CLOSED LOOP SYSTEMS GEOTHERMAL HEAT PUMP MARKET, BY DESIGN, 2021-2031(THOUSAND UNITS)
    TABLE 174. INDIA CLOSED LOOP SYSTEMS GEOTHERMAL HEAT PUMP MARKET, BY DESIGN, 2021-2031($MILLION)
    TABLE 175. INDIA GEOTHERMAL HEAT PUMP MARKET, BY END-USE, 2021-2031(THOUSAND UNITS)
    TABLE 176. INDIA GEOTHERMAL HEAT PUMP MARKET, BY END-USE, 2021-2031($MILLION)
    TABLE 177. INDIA RESIDENTIAL GEOTHERMAL HEAT PUMP MARKET, BY INSTALLATION TYPE, 2021-2031(THOUSAND UNITS)
    TABLE 178. INDIA RESIDENTIAL GEOTHERMAL HEAT PUMP MARKET, BY INSTALLATION TYPE, 2021-2031($MILLION)
    TABLE 179. SOUTH KOREA GEOTHERMAL HEAT PUMP MARKET, BY TECHNOLOGY, 2021-2031(THOUSAND UNITS)
    TABLE 180. SOUTH KOREA GEOTHERMAL HEAT PUMP MARKET, TECHNOLOGY, 2021-2031($MILLION)
    TABLE 181. SOUTH KOREA CLOSED LOOP SYSTEMS GEOTHERMAL HEAT PUMP MARKET, BY DESIGN, 2021-2031(THOUSAND UNITS)
    TABLE 182. SOUTH KOREA CLOSED LOOP SYSTEMS GEOTHERMAL HEAT PUMP MARKET, BY DESIGN, 2021-2031($MILLION)
    TABLE 183. SOUTH KOREA GEOTHERMAL HEAT PUMP MARKET, BY END-USE, 2021-2031(THOUSAND UNITS)
    TABLE 184. SOUTH KOREA GEOTHERMAL HEAT PUMP MARKET, BY END-USE, 2021-2031($MILLION)
    TABLE 185. SOUTH KOREA RESIDENTIAL GEOTHERMAL HEAT PUMP MARKET, BY INSTALLATION TYPE, 2021-2031(THOUSAND UNITS)
    TABLE 186. SOUTH KOREA RESIDENTIAL GEOTHERMAL HEAT PUMP MARKET, BY INSTALLATION TYPE, 2021-2031($MILLION)
    TABLE 187. AUSTRALIA GEOTHERMAL HEAT PUMP MARKET, BY TECHNOLOGY, 2021-2031(THOUSAND UNITS)
    TABLE 188. AUSTRALIA GEOTHERMAL HEAT PUMP MARKET, TECHNOLOGY, 2021-2031($MILLION)
    TABLE 189. AUSTRALIA CLOSED LOOP SYSTEMS GEOTHERMAL HEAT PUMP MARKET, BY DESIGN, 2021-2031(THOUSAND UNITS)
    TABLE 190. AUSTRALIA CLOSED LOOP SYSTEMS GEOTHERMAL HEAT PUMP MARKET, BY DESIGN, 2021-2031($MILLION)
    TABLE 191. AUSTRALIA GEOTHERMAL HEAT PUMP MARKET, BY END-USE, 2021-2031(THOUSAND UNITS)
    TABLE 192. AUSTRALIA GEOTHERMAL HEAT PUMP MARKET, BY END-USE, 2021-2031($MILLION)
    TABLE 193. AUSTRALIA RESIDENTIAL GEOTHERMAL HEAT PUMP MARKET, BY INSTALLATION TYPE, 2021-2031(THOUSAND UNITS)
    TABLE 194. AUSTRALIA RESIDENTIAL GEOTHERMAL HEAT PUMP MARKET, BY INSTALLATION TYPE, 2021-2031($MILLION)
    TABLE 195. REST OF ASIA-PACIFIC GEOTHERMAL HEAT PUMP MARKET, BY TECHNOLOGY, 2021-2031(THOUSAND UNITS)
    TABLE 196. REST OF ASIA-PACIFIC GEOTHERMAL HEAT PUMP MARKET, TECHNOLOGY, 2021-2031($MILLION)
    TABLE 197. REST OF ASIA-PACIFIC CLOSED LOOP SYSTEMS GEOTHERMAL HEAT PUMP MARKET, BY DESIGN, 2021-2031(THOUSAND UNITS)
    TABLE 198. REST OF ASIA-PACIFIC CLOSED LOOP SYSTEMS GEOTHERMAL HEAT PUMP MARKET, BY DESIGN, 2021-2031($MILLION)
    TABLE 199. REST OF ASIA-PACIFIC GEOTHERMAL HEAT PUMP MARKET, BY END-USE, 2021-2031(THOUSAND UNITS)
    TABLE 200. REST OF ASIA-PACIFIC GEOTHERMAL HEAT PUMP MARKET, BY END-USE, 2021-2031($MILLION)
    TABLE 201. REST OF ASIA-PACIFIC RESIDENTIAL GEOTHERMAL HEAT PUMP MARKET, BY INSTALLATION TYPE, 2021-2031(THOUSAND UNITS)
    TABLE 202. REST OF ASIA-PACIFIC RESIDENTIAL GEOTHERMAL HEAT PUMP MARKET, BY INSTALLATION TYPE, 2021-2031($MILLION)
    TABLE 203. LAMEA GEOTHERMAL HEAT PUMP MARKET, BY TECHNOLOGY, 2021-2031(THOUSAND UNITS)
    TABLE 204. LAMEA GEOTHERMAL HEAT PUMP MARKET, BY TECHNOLOGY, 2021-2031($MILLION)
    TABLE 205. LAMEA CLOSED LOOP SYSTEMS GEOTHERMAL HEAT PUMP MARKET, BY DESIGN, 2021-2031(THOUSAND UNITS)
    TABLE 206. LAMEA CLOSED LOOP SYSTEMS GEOTHERMAL HEAT PUMP MARKET, BY DESIGN, 2021-2031($MILLION)
    TABLE 207. LAMEA GEOTHERMAL HEAT PUMP MARKET, BY END-USE, 2021-2031(THOUSAND UNITS)
    TABLE 208. LAMEA GEOTHERMAL HEAT PUMP MARKET, BY END-USE, 2021-2031($MILLION)
    TABLE 209. LAMEA RESIDENTIAL GEOTHERMAL HEAT PUMP MARKET, BY INSTALLATION TYPE, 2021-2031(THOUSAND UNITS)
    TABLE 210. LAMEA RESIDENTIAL GEOTHERMAL HEAT PUMP MARKET, BY INSTALLATION TYPE, 2021-2031($MILLION)
    TABLE 211. LAMEA GEOTHERMAL HEAT PUMP MARKET, BY COUNTRY, 2021-2031(THOUSAND UNITS)
    TABLE 212. LAMEA GEOTHERMAL HEAT PUMP MARKET, BY COUNTRY, 2021-2031($MILLION)
    TABLE 213. BRAZIL GEOTHERMAL HEAT PUMP MARKET, BY TECHNOLOGY, 2021-2031(THOUSAND UNITS)
    TABLE 214. BRAZIL GEOTHERMAL HEAT PUMP MARKET, TECHNOLOGY, 2021-2031($MILLION)
    TABLE 215. BRAZIL CLOSED LOOP SYSTEMS GEOTHERMAL HEAT PUMP MARKET, BY DESIGN, 2021-2031(THOUSAND UNITS)
    TABLE 216. BRAZIL CLOSED LOOP SYSTEMS GEOTHERMAL HEAT PUMP MARKET, BY DESIGN, 2021-2031($MILLION)
    TABLE 217. BRAZIL GEOTHERMAL HEAT PUMP MARKET, BY END-USE, 2021-2031(THOUSAND UNITS)
    TABLE 218. BRAZIL GEOTHERMAL HEAT PUMP MARKET, BY END-USE, 2021-2031($MILLION)
    TABLE 219. BRAZIL RESIDENTIAL GEOTHERMAL HEAT PUMP MARKET, BY INSTALLATION TYPE, 2021-2031(THOUSAND UNITS)
    TABLE 220. BRAZIL RESIDENTIAL GEOTHERMAL HEAT PUMP MARKET, BY INSTALLATION TYPE, 2021-2031($MILLION)
    TABLE 221. SAUDI ARABIA GEOTHERMAL HEAT PUMP MARKET, BY TECHNOLOGY, 2021-2031(THOUSAND UNITS)
    TABLE 222. SAUDI ARABIA GEOTHERMAL HEAT PUMP MARKET, TECHNOLOGY, 2021-2031($MILLION)
    TABLE 223. SAUDI ARABIA CLOSED LOOP SYSTEMS GEOTHERMAL HEAT PUMP MARKET, BY DESIGN, 2021-2031(THOUSAND UNITS)
    TABLE 224. SAUDI ARABIA CLOSED LOOP SYSTEMS GEOTHERMAL HEAT PUMP MARKET, BY DESIGN, 2021-2031($MILLION)
    TABLE 225. SAUDI ARABIA GEOTHERMAL HEAT PUMP MARKET, BY END-USE, 2021-2031(THOUSAND UNITS)
    TABLE 226. SAUDI ARABIA GEOTHERMAL HEAT PUMP MARKET, BY END-USE, 2021-2031($MILLION)
    TABLE 227. SAUDI ARABIA RESIDENTIAL GEOTHERMAL HEAT PUMP MARKET, BY INSTALLATION TYPE, 2021-2031(THOUSAND UNITS)
    TABLE 228. SAUDI ARABIA RESIDENTIAL GEOTHERMAL HEAT PUMP MARKET, BY INSTALLATION TYPE, 2021-2031($MILLION)
    TABLE 229. SOUTH AFRICA GEOTHERMAL HEAT PUMP MARKET, BY TECHNOLOGY, 2021-2031(THOUSAND UNITS)
    TABLE 230. SOUTH AFRICA GEOTHERMAL HEAT PUMP MARKET, TECHNOLOGY, 2021-2031($MILLION)
    TABLE 231. SOUTH AFRICA CLOSED LOOP SYSTEMS GEOTHERMAL HEAT PUMP MARKET, BY DESIGN, 2021-2031(THOUSAND UNITS)
    TABLE 232. SOUTH AFRICA CLOSED LOOP SYSTEMS GEOTHERMAL HEAT PUMP MARKET, BY DESIGN, 2021-2031($MILLION)
    TABLE 233. SOUTH AFRICA GEOTHERMAL HEAT PUMP MARKET, BY END-USE, 2021-2031(THOUSAND UNITS)
    TABLE 234. SOUTH AFRICA GEOTHERMAL HEAT PUMP MARKET, BY END-USE, 2021-2031($MILLION)
    TABLE 235. SOUTH AFRICA RESIDENTIAL GEOTHERMAL HEAT PUMP MARKET, BY INSTALLATION TYPE, 2021-2031(THOUSAND UNITS)
    TABLE 236. SOUTH AFRICA RESIDENTIAL GEOTHERMAL HEAT PUMP MARKET, BY INSTALLATION TYPE, 2021-2031($MILLION)
    TABLE 237. REST OF LAMEA GEOTHERMAL HEAT PUMP MARKET, BY TECHNOLOGY, 2021-2031(THOUSAND UNITS)
    TABLE 238. REST OF LAMEA GEOTHERMAL HEAT PUMP MARKET, TECHNOLOGY, 2021-2031($MILLION)
    TABLE 239. REST OF LAMEA CLOSED LOOP SYSTEMS GEOTHERMAL HEAT PUMP MARKET, BY DESIGN, 2021-2031(THOUSAND UNITS)
    TABLE 240. REST OF LAMEA CLOSED LOOP SYSTEMS GEOTHERMAL HEAT PUMP MARKET, BY DESIGN, 2021-2031($MILLION)
    TABLE 241. REST OF LAMEA GEOTHERMAL HEAT PUMP MARKET, BY END-USE, 2021-2031(THOUSAND UNITS)
    TABLE 242. REST OF LAMEA GEOTHERMAL HEAT PUMP MARKET, BY END-USE, 2021-2031($MILLION)
    TABLE 243. REST OF LAMEA RESIDENTIAL GEOTHERMAL HEAT PUMP MARKET, BY INSTALLATION TYPE, 2021-2031(THOUSAND UNITS)
    TABLE 244. REST OF LAMEA RESIDENTIAL GEOTHERMAL HEAT PUMP MARKET, BY INSTALLATION TYPE, 2021-2031($MILLION)
    TABLE 245. KEY NEW PARTNERSHIPS (2020-2022)
    TABLE 246. BOSCH TEROTECHNOLOGY LTD: COMPANY SNAPSHOT
    TABLE 247. BOSCH TEROTECHNOLOGY LTD: PRODUCT PORTFOLIO
    TABLE 248. BOSTECH MECHANICAL LTD: COMPANY SNAPSHOT
    TABLE 249. BOSTECH MECHANICAL LTD: PRODUCT PORTFOLIO
    TABLE 250. CARRIER GLOBAL CORP: COMPANY SNAPSHOT
    TABLE 251. CARRIER GLOBAL CORP: OPERATING SEGMENTS
    TABLE 252. CARRIER GLOBAL CORP: PRODUCT PORTFOLIO
    TABLE 253. OVERALL FINANCIAL STATUS ($MILLION)
    TABLE 254. DAIKIN INDUSTRIES, LTD: COMPANY SNAPSHOT
    TABLE 255. DAIKIN INDUSTRIES, LTD: OPERATING SEGMENTS
    TABLE 256. DAIKIN INDUSTRIES, LTD: PRODUCT PORTFOLIO
    TABLE 257. OVERALL FINANCIAL STATUS ($MILLION)
    TABLE 258. DANFOSS TECHNOLOGIES: COMPANY SNAPSHOT
    TABLE 259. DANFOSS TECHNOLOGIES: OPERATING SEGMENTS
    TABLE 260. DANFOSS TECHNOLOGIES: PRODUCT PORTFOLIO
    TABLE 261. OVERALL FINANCIAL STATUS ($MILLION)
    TABLE 262. DE DIETRICH PROCESS SYSTEMS: COMPANY SNAPSHOT
    TABLE 263. DE DIETRICH PROCESS SYSTEMS: PRODUCT PORTFOLIO
    TABLE 264. ECOFOREST S.A.: COMPANY SNAPSHOT
    TABLE 265. ECOFOREST S.A.: PRODUCT PORTFOLIO
    TABLE 266. ENERGY SMART ALTERNATIVES: COMPANY SNAPSHOT
    TABLE 267. ENERGY SMART ALTERNATIVES: PRODUCT PORTFOLIO
    TABLE 268. GEOCOMFORT: COMPANY SNAPSHOT
    TABLE 269. GEOCOMFORT: PRODUCT PORTFOLIO
    TABLE 270. GEOSMART ENERGY INC.: COMPANY SNAPSHOT
    TABLE 271. GEOSMART ENERGY INC.: PRODUCT PORTFOLIO
    TABLE 272. MARITIME GEOTHERMAL LTD: COMPANY SNAPSHOT
    TABLE 273. MARITIME GEOTHERMAL LTD: PRODUCT PORTFOLIO
    TABLE 274. MITSUBISHI ELECTRIC CORP: COMPANY SNAPSHOT
    TABLE 275. MITSUBISHI ELECTRIC CORP: OPERATING SEGMENTS
    TABLE 276. MITSUBISHI ELECTRIC CORP: PRODUCT PORTFOLIO
    TABLE 277. OVERALL FINANCIAL STATUS ($MILLION)
    TABLE 278. PFISTER’S ENERGY: COMPANY SNAPSHOT
    TABLE 279. PFISTER’S ENERGY: PRODUCT PORTFOLIO
    TABLE 280. VIESSMANN: COMPANY SNAPSHOT
    TABLE 281. VIESSMANN: PRODUCT PORTFOLIO
    TABLE 282. WOLF GMBH: COMPANY SNAPSHOT
    TABLE 283. WOLF GMBH: PRODUCT PORTFOLIO
    TABLE 284. CLIMATEMASTER INC.: COMPANY SNAPSHOT
    TABLE 285. CLIMATEMASTER INC: PRODUCT PORTFOLIO
    TABLE 286. DANDELION ENERGY: COMPANY SNAPSHOT
    TABLE 287. DANDELION ENERGY
    TABLE 288. DANDELION ENERGY: KEY STRATEGIC MOVES AND DEVELOPMENTS
  • LIST OF FIGURES

  • FIGURE 01. KEY MARKET SEGMENTS
    FIGURE 02. GEOTHERMAL HEAT PUMP MARKET, BY SEGMENT, 2021-2031
    FIGURE 03. GEOTHERMAL HEAT PUMP MARKET, BY COUNTRY, 2021-2031
    FIGURE 04. TOP INVESTMENT POCKETS
    FIGURE 05. MODERATE- HIGH BARGAINING POWER OF SUPPLIERS
    FIGURE 06. HIGH BARGAINING POWER OF BUYERS
    FIGURE 07. MODERATE THREAT OF SUBSTITUTES
    FIGURE 08. MODERATE THREAT OF NEW ENTRANTS
    FIGURE 09. MODERATE COMPETITIVE RIVALRY
    FIGURE 10. MARKET DYNAMICS: GLOBAL GEOTHERMAL HEAT PUMP MARKET
    FIGURE 11. PARENT PEER MARKET
    FIGURE 12. GEOTHERMAL HEAT PUMP MARKET: PATENT ANALYSIS BY COUNTRIES
    FIGURE 13. GEOTHERMAL HEAT PUMP MARKET: PRICING ANALYSIS
    FIGURE 14. GEOTHERMAL HEAT PUMP MARKET, BY TECHNOLOGY, 2021-2031 ($MILLION)
    FIGURE 15. COMPARATIVE ANALYSIS OF GEOTHERMAL HEAT PUMP MARKET FOR OPEN LOOP SYSTEMS, BY COUNTRY, 2021 & 2031 ($MILLION)
    FIGURE 16. COMPARATIVE ANALYSIS OF GEOTHERMAL HEAT PUMP MARKET FOR CLOSED LOOP SYSTEMS, BY COUNTRY, 2021 & 2031 ($MILLION)
    FIGURE 17. GEOTHERMAL HEAT PUMP MARKET, BY END-USE, 2021-2031 ($MILLION)
    FIGURE 18. COMPARATIVE ANALYSIS OF GEOTHERMAL HEAT PUMP MARKET, FOR RESIDENTIAL, BY COUNTRY, 2021 & 2031 ($MILLION)
    FIGURE 19. COMPARATIVE ANALYSIS OF GEOTHERMAL HEAT PUMP MARKET, FOR COMMERCIAL END-USE BY COUNTRY, 2021 & 2031 ($MILLION)
    FIGURE 20. COMPARATIVE ANALYSIS OF GEOTHERMAL HEAT PUMP MARKET, FOR INDUSTRIAL END-USE, BY COUNTRY, 2021 & 2031 ($MILLION)
    FIGURE 21. GEOTHERMAL HEAT PUMP MARKET, BY REGION, 2022–2031 ($MILLION)
    FIGURE 22. U.S. GEOTHERMAL HEAT PUMP MARKET REVENUE, 2021-2031($MILLION)
    FIGURE 23. CANADA GEOTHERMAL HEAT PUMP MARKET REVENUE, 2021-2031($MILLION)
    FIGURE 24. MEXICO GEOTHERMAL HEAT PUMP MARKET REVENUE, 2021-2031($MILLION)
    FIGURE 25. COUNTRY WISE SALES OF HEAT PUMPS IN EUROPE (2016) (‘000 UNITS)
    FIGURE 26. GERMANY GEOTHERMAL HEAT PUMP MARKET REVENUE, 2021-2031($MILLION)
    FIGURE 27. FRANCE GEOTHERMAL HEAT PUMP MARKET REVENUE, 2021-2031($MILLION)
    FIGURE 28. SWEDEN GEOTHERMAL HEAT PUMP MARKET REVENUE, 2021-2031($MILLION)
    FIGURE 29. ITALY GEOTHERMAL HEAT PUMP MARKET REVENUE, 2021-2031($MILLION)
    FIGURE 30. SPAIN GEOTHERMAL HEAT PUMP MARKET REVENUE, 2021-2031($MILLION)
    FIGURE 31. FINLAND GEOTHERMAL HEAT PUMP MARKET REVENUE, 2021-2031($MILLION)
    FIGURE 32. NORWAY GEOTHERMAL HEAT PUMP MARKET REVENUE, 2021-2031($MILLION)
    FIGURE 33. DENMARK GEOTHERMAL HEAT PUMP MARKET REVENUE, 2021-2031($MILLION)
    FIGURE 34. REST OF EUROPE GEOTHERMAL HEAT PUMP MARKET REVENUE, 2021-2031($MILLION)
    FIGURE 35. CHINA GEOTHERMAL HEAT PUMP MARKET REVENUE, 2021-2031($MILLION)
    FIGURE 36. JAPAN GEOTHERMAL HEAT PUMP MARKET REVENUE, 2021-2031($MILLION)
    FIGURE 37. INDIA GEOTHERMAL HEAT PUMP MARKET REVENUE, 2021-2031($MILLION)
    FIGURE 38. SOUTH KOREA GEOTHERMAL HEAT PUMP MARKET REVENUE, 2021-2031($MILLION)
    FIGURE 39. AUSTRALIA GEOTHERMAL HEAT PUMP MARKET REVENUE, 2021-2031($MILLION)
    FIGURE 40. REST OF ASIA-PACIFIC GEOTHERMAL HEAT PUMP MARKET REVENUE, 2021-2031($MILLION)
    FIGURE 41. BRAZIL GEOTHERMAL HEAT PUMP MARKET REVENUE, 2021-2031($MILLION)
    FIGURE 42. SAUDI ARABIA GEOTHERMAL HEAT PUMP MARKET REVENUE, 2021-2031($MILLION)
    FIGURE 43. SOUTH AFRICA GEOTHERMAL HEAT PUMP MARKET REVENUE, 2021-2031($MILLION)
    FIGURE 44. REST OF LAMEA GEOTHERMAL HEAT PUMP MARKET REVENUE, 2021-2031($MILLION)
    FIGURE 45. MARKET PLAYER POSITIONING, 2022
    FIGURE 46. TOP WINNING STRATEGIES, BY YEAR, 2020–2022
    FIGURE 47. TOP WINNING STRATEGIES, BY DEVELOPMENT, 2020–2022 (%)
    FIGURE 48. TOP WINNING STRATEGIES, BY COMPANY, 2020–2022
    FIGURE 49. PRODUCT MAPPING OF TOP 10 PLAYERS
    FIGURE 50. COMPETITIVE HEATMAP OF KEY PLAYERS
    FIGURE 51. CARRIER GLOBAL CORP: NET SALES, 2019–2021($MILLION)
    FIGURE 52. CARRIER GLOBAL CORP: REVENUE SHARE BY SEGMENT, 2021(%)
    FIGURE 53. CARRIER GLOBAL CORP: REVENUE SHARE BY REGION, 2021(%)
    FIGURE 54. DAIKIN INDUSTRIES, LTD: REVENUE, 2018–2020 ($MILLION)
    FIGURE 55. DAIKIN INDUSTRIES, LTD: REVENUE SHARE BY SEGMENT, 2020(%)
    FIGURE 56. DAIKIN INDUSTRIES, LTD: REVENUE SHARE BY REGION, 2020(%)
    FIGURE 57. DANFOSS TECHNOLOGIES: REVENUE, 2019–2021 ($MILLION)
    FIGURE 58. DANFOSS TECHNOLOGIES: REVENUE SHARE BY SEGMENT, 2021 (%)
    FIGURE 59. DANFOSS TECHNOLOGIES: REVENUE SHARE BY REGION, 2021 (%)
    FIGURE 60. MITSUBISHI ELECTRIC CORP: REVENUE, 2019–2021 ($MILLION)
    FIGURE 61. MITSUBISHI ELECTRIC CORP: REVENUE SHARE BY SEGMENT, 2021 (%)
    FIGURE 62. MITSUBISHI ELECTRIC CORP: REVENUE SHARE BY REGION, 2021(%)


Growing demand for reliable, cost-effective, and energy-efficient solutions are projected to drive market growth over the forecast period. The geothermal heat pump (GHP) extracts heat from the ground for space heating, cooling, and hot water generation. Such a pump extracts heat by the horizontal or vertical collector. The extracted heat is commonly distributed through a hydronic distribution system. A GHP offers higher efficiency than air-source owing to the advantage of the stable temperature of its geothermal subsoil heat source. The U.S. is one of the prominent markets for a geothermal heat pump. Increasing carbon emission and fluctuating energy prices led the consumers to use renewable heat sources, which is expected to drive the product demand in the country.

PURCHASE OPTIONS

Call or Email us

U.S.-Canada Toll-free: +1-800-792-5285
Int'l : +1-503-894-6022
Europe : +44-845-528-1300
Email : help@alliedmarketresearch.com
 
FREQUENTLY ASKED QUESTIONS?

A. High adoption in the residential sector and contribution of heat pump technology in reducing CO2 emission are the key factors boosting the Geothermal heat pump market growth.

A. Residential application is projected to increase the demand for Geothermal heat pump Market

A. Bosch Terotechnology Ltd, Bostech Mechanical Ltd., Carrier global Corporation, Climate Master, Inc., Daikin Industries, Ltd., Danfoss Technologies, Dandelion Energy, De Dietrich Process Systems, Ecoforest S.A, Energy Smart Alternatives, GeoComfort Geothermal systems, GeoSmart Energy Inc., Maritime Geothermal Ltd., Mitsubishi Electric Corporation, Pfister’s Energy, Viessmann, and Wolf GmbH.

A. Increase in demand for energy-efficient solutions is the Main Driver of Geothermal heat pump Market.

A. The geothermal heat pump market is segmented on the basis of technology, end use, and region. Depending on technology, the market is categorized into open loop systems and closed loop systems (vertical loops and horizontal loops). On the basis of end use, the market is categorized into residential (new building systems and retrofit systems), commercial, and industrial. On the basis of region, the market is studied across North America, Europe, Asia-Pacific, and LAMEA.

A. The market value of Geothermal heat pump in 2031 is expected to be $12.5 billion

A. The COVID-19 pandemic's global crises and commercial uncertainties have had a substantial impact on the operations of many firms and their sales. The implementation of lockdown restrictions in various nations along with the closure of heat pump manufacturing operations had a detrimental effect on the expansion of the domestic heat pump market.

Looking for Customization?

 Customization Request

Have a Question?

 Speak with Analyst

Any Confusion?

 Inquire Before Buying

Have a glance of the Report

  Request Sample
RELATED TAGS

Purchase Full Report of
Geothermal Heat Pump Market

Start reading instantly.
This Report and over 67,404+ more Reports, Available with Avenue Library. T&C*.

  • Online Only
  • $3,690
  • Online cloud access only
  • Restricted print, copy, paste & download
  • Read only
  • Free industry update
    (Within 180 days)
  • Free report update in next update cycle
    (Jul 2023 - Jul 2024)
  • Data Pack
  • $3,930
  • Restricted to one authorized user
  • One print only
  • Available in
    Excel
  • Free industry update
    (Within 180 days)
  •   Free report update in next update cycle
    (Jul 2023 - Jul 2024)
  • Single User
  • $5,820
  • Restricted to one authorized user
  • One print only
  • Available in
    PDF
  • Free industry update
    (Within 180 days)
  •   Free report update in next update cycle
    (Jul 2023 - Jul 2024)
  • Five Users
  • $6,540
  • Limited to five authorized users
  • Print upto five copies
  • Available in
    PDF
  • Free industry update
    (Within 180 days)
  •   Free report update in next update cycle
    (Jul 2023 - Jul 2024)
  • Enterprise
    License/PDF

  • $9,870
  • Unlimited
    within
    company/enterprise
  • Available in Excel & PDF
  • Free industry update
    (Within 180 days)
  •   Free report update in next update cycle
    (Jul 2023 - Jul 2024)
  • Library
    Membership

  • $999 $ 1,175
    Per User/ Per month/ Billed annually
  • Published Content
    E-access
  • Company Profiles
    E-access
  • Newly Added Content Access
  • 10 PDF
    Downloads
  • 5 Excel Data
    Pack Downloads
  • 250 Company Profiles PDF Downloads
  • Buy Now

*Taxes/Fees, if applicable will be added during checkout. All prices in USD

RELATED REPORTS
 

Why Allied Market Research?


Infallible Methodology

To ensure high-level data integrity, accurate analysis, and impeccable forecasts

Analyst Support

For complete satisfaction

Customization

On-demand customization of scope of the report to exactly meet your needs

TARGETED MARKET VIEW

Targeted market view to provide pertinent information and save time of readers

Get fresh content delivered

Get insights on topics that are crucial for your business. Stay abreast of your interest areas.

Get Industry Data Alerts

Why Allied Market Research?

Infallible Methodology

To ensure high-level data integrity, accurate analysis, and impeccable forecasts

Analyst Support

For complete satisfaction

Customization

On-demand customization of scope of the report to exactly meet your needs

TARGETED MARKET VIEW

Targeted market view to provide pertinent information and save time of readers