0
2022
Green Polyols Market

Green Polyols Market

by Type (Polyether Polyols ,  Polyester Polyols), by Application (Polyurethane Foam, Adhesives and Sealants, Coatings, Others), by End-use Industry (Furniture and Bedding, Construction, Packaging, Automotive, Others): Global Opportunity Analysis and Industry Forecast, 2021-2031

Report Code: A11898
Nov 2022 | Pages: 250
Tables: 248
Charts: 65
  • Formats*:

  • pdf

    Single User License, Five User
    License & Enterprise User License

  • xls

    Data Pack Excel License

  • ppt

    It comes with the additional cost
    of $2500.00 contact sales.


Green Polyols Market Research, 2031

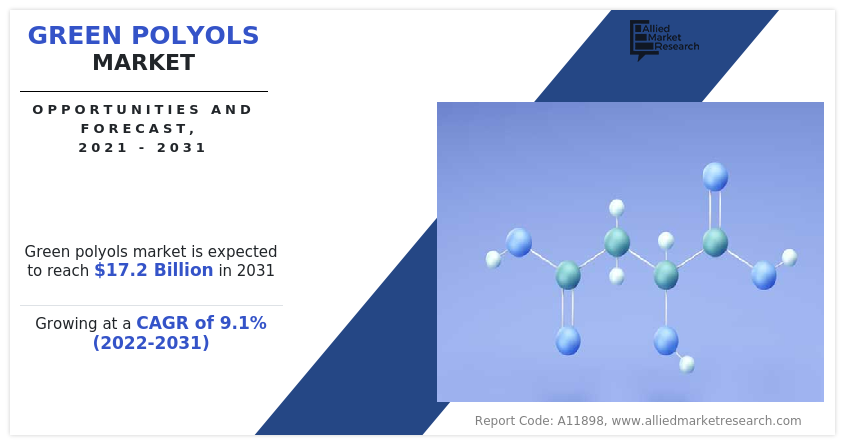
The global green polyols market was valued at $7.3 billion in 2021, and is projected to reach $17.2 billion by 2031, growing at a CAGR of 9.1% from 2022 to 2031.
Report Key Highlighters:

  • The study combines high-quality data, professional opinions and analysis, and valuable independent viewpoints. The research method is intended to provide a balanced picture of global markets and to enable stakeholders to make educated decisions in order to achieve their greatest growth targets.
  • 20 countries are covered in the green polyols market report. The segment analysis of each country in both value ($million) and volume (kilotons) during the forecast period 2021-2031 is covered in the report. Historical data and regulations are also covered in the report.
  • In order to have a deeper knowledge of the market, over 3,700 product literatures, annual reports, industry statements, and other similar materials from major industry participants were reviewed.
  • The green polyols market is highly fragmented, with several players such as Synthesia Technology Group, UniSol, BASF SE, Cargill Incorporated, Arkema, Covestro AG, IQS Global, BioBased Technologies, Emery Oleochemicals LLC, and Roquette. Also tracked key strategies such as acquisitions, product launches, mergers, expansion, etc. of the players operating in the green polyols market.

The COVID-19 pandemic had a vital impact on green polyol industries such as automotive and construction. However, the COVID-19 pandemic increased the demand for green polyols for food packaging as it provides protection from bacteria and increases the life span of the food product stored.

Green Polyols Market

Growth in demand from furniture & bedding, construction, packaging, automotive industries is predicted to propel the green polyols market growth during the forecast period

Green polyol is a vital raw ingredient in the manufacturing of thermoplastics, elastomers, adhesives, synthetic leather, and coatings. Green polyols are soy-based chemicals used in the production of flexible foam for upholstered furniture, mattresses, mattress toppers, pillows, carpet cushions, and vehicle seats. Traditional foam and carpet cushion materials are derived from petroleum. Green polyols used in the production of polyurethane foams which are initiated by natural goods products like insulation, bedding, footwear and even biomedical devices as the initiator is propoxylated and ethoxylated with petrochemical epoxides. Sucrose and sorbitol-initiated Polyether Polyols which is high-functionality polyols.

Green polyols offer durability, abrasion, chemical, & oil resistance capabilities and are utilized in rollers, belts for hauling operations, rollerblade wheels, hospital trolleys, printing rollers, and under-the-hood automobile applications. The polyester polyols range offers a variety of properties, including contemporary coatings comprising polyurethane for durability and a glossy appearance. It may be utilized in a water dispersion coating system as well as a 2K system for wood and metal applications. Green polyols can be used to make a variety of finished products such as sports shoe soles, eyeglasses, auto parts, cell and phone casings, while carbon-neutral oleochemicals which is a polyester polyol are widely used in the synthesis of high-performance lubricants, bio-based plasticizers, pharmaceuticals & agrochemicals, fragrances & flavors and natural cosmetic ingredients.

Green polyols are used in various end-use industries such as furniture & bedding, construction, packaging, automotive, and others. Green polyols are used in furniture and bedding to manufacture numerous varieties of flexible foam used in mattresses, pillows, couches, chairs, and other home or office furniture cushioning. According to IBIS World, there are 50,630 retail market for home furniture & bedding enterprises in the U.S. in 2022, up 0.1% from 2021. Green polyol polyurethane foams are used as exceptionally efficient insulation materials, resulting in increased energy savings. Increased building material effectiveness has resulted in a greater requirement for efficient insulating materials to control heating, ventilation, and air conditioning (HVAC) and offset the amount of energy lost owing to ineffective insulation.

Insulation materials range from bulky fiber materials like fiberglass, rock and slag wool, cellulose, and natural fibers to stiff foam boards and elegant foils. Green polyols are used to make rigid and flexible polyurethane foams, as well as adhesives for packaging and furniture that have great adhesion and bonding to a broad range of surfaces and are utilized in applications ranging from folding cartons to food and beverage packaging. However, availability of alternative use of green polyols as sugar is predicted to hinder the market growth of green polyols. On contrary, rising demand for bio-based polyols in car manufacturing is predicted to offer ample growth opportunities for the market growth.

The green polyols market is segmented into type, application, end-use industry, and region. On the basis of type, the market is bifurcated into polyether polyols and polyester polyols. On the basis of application, the market is categorized into polyurethane foam, adhesives & sealants, coatings, and others. On the basis of the end-use industry, the market is classified into furniture & bedding, construction, packaging, automotive, and others. Region-wise, the green polyols market share is studied across North America, Europe, Asia-Pacific, and LAMEA.
Green Polyols Market

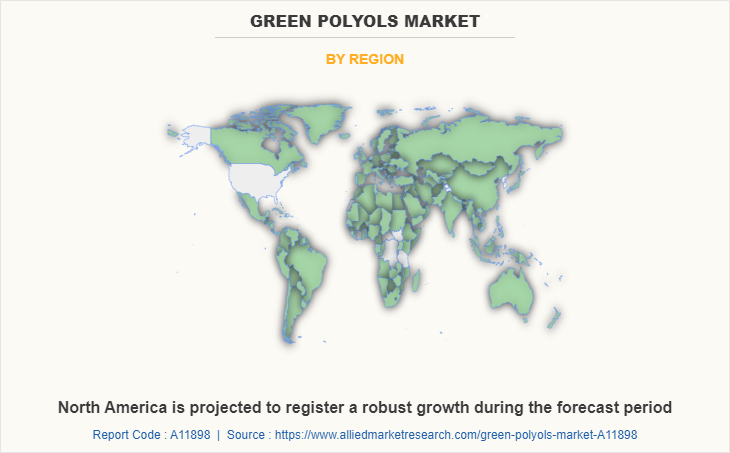
North America is projected to register a robust growth during the forecast period. In North America, green polyols are mostly utilized in the construction and automobile industries. It is a very strong material with excellent cut and tear resistance, and it will make the flooring water resistant, as the coating repels water and helps prevent water absorption. Foams are most typically utilized in commercial and residential seating applications in automotive green polyols. The growing commercial and residential sectors, the expanding regional construction industry, and the emerging renovation trend among urban and suburban residents in the U.S. are driving growth in North America spray polyurethane foam for the building & construction market. Green polyols polyurethane foam (SPF) is extensively used in building roof and wall sealing and insulation, and it may reduce building energy requirements for heating and cooling.
Green Polyols Market

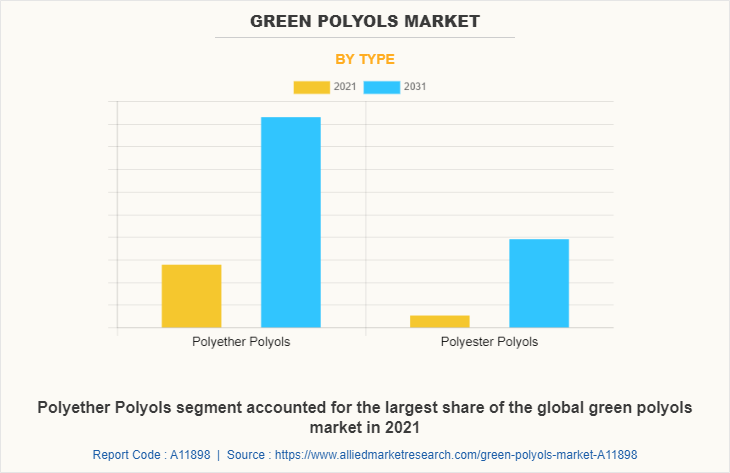
The polyether polyols segment accounted for the largest share of the global green polyols market in terms of revenue, in 2021. Polyether polyols are mostly used to make polyurethane (PU) stiff foam, soft foam, and moulding foam. Polyether Polyols polyol compounds are generally used to manufacture hard polyurethane foaming polymers, which are widely utilized in refrigerators, freezers, refrigerated vehicles, thermal baffles, pipe insulation, and other industries. Polyether polyols in green polyols are derived from natural oil and used to make coatings, inks, castings, and deformers. The increasing use of Polyether polyols in the production of adhesives, lubricants, elastomers, sealants, surface active agents, and other products is projected to drive market growth. The development of bio-based polyether polyols, which are made from natural oils and hence environmentally benign, is intended to alleviate the issue and open up new business potential.
Green Polyols Market

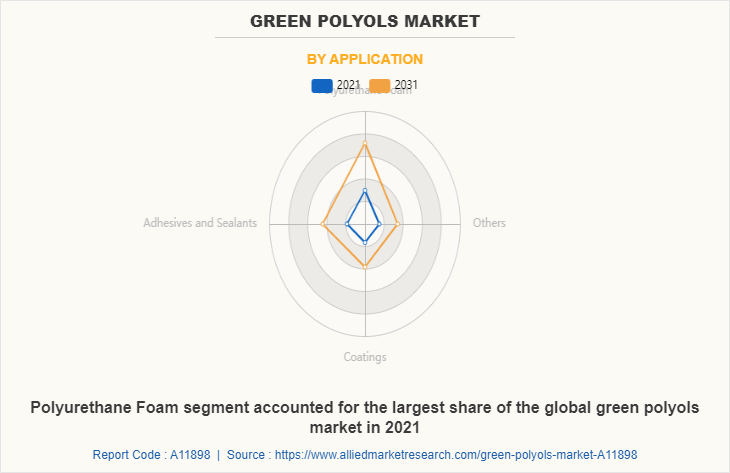
The polyurethane foam segment accounted for the largest share of the global green polyols market in terms of revenue, in 2021. Polyurethane foam is formed from polyether polyols, which are commonly used in the building and construction industry. It is capable of managing temperature effectively. As a result, it is employed in the insulation of walls, doors, panels, and roofs. Polyurethane is used in construction projects like the South San Francisco Civic Center campus, the LaGuardia Airport Construction Project, the O'Hare Airport Construction Project, and the Second Avenue Subway Construction Project, which are expected to drive polyurethane demand in the construction industry. According to the US Department of Energy, commercial and residential buildings utilize 40% of all energy, and builders and architects utilize rigid polyurethane, which reduces energy consumption and carbon emissions, which is great for the environment.
Green Polyols Market

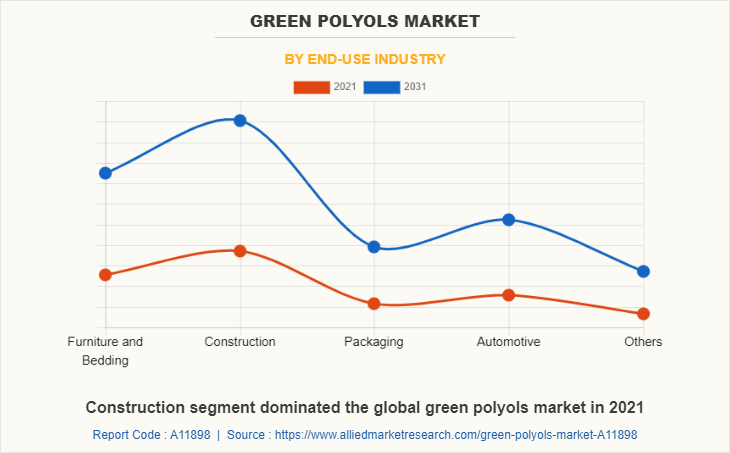
The construction segment dominated the global green polyols market in 2021. Green polyols polyurethanes are used in building and construction to create high-performance, lightweight goods that are both resilient and versatile. Polyurethane materials can also help in the aesthetics of homes and structures. Polyester polyols, which are used in residential construction, have properties like as abrasion resistance, heat resistance, hardness, solvent resistance, and shock absorption.

Key Players and Strategies:

The major players operating in the global green polyols industry include Synthesia Technology Group, UniSol, BASF SE, Cargill Incorporated, Arkema, Covestro AG, IQS Global, BioBased Technologies, Emery Oleochemicals LLC, and Roquette. These players have been adopting various strategies to gain higher share or to retain leading positions in the market. For instance:

  • In September 2022, Covestro AG expanded its business by introducing bio-circular Polyether Polyols based on sustainable Polyether Polyols. The introduced mass balance approach allows for the gradual substitution of fossil-based raw materials with bio-circular alternatives, improving the sustainability of these applications even further.
  • In June 2021 BASF SE introduced VALERAS, a new brand for its plastic additives portfolio that helps customers meet their sustainability targets. VALERAS includes BASF's existing plastic additives, which improve durability, save energy, reduce emissions, and promote biodiversity in plastic applications.

Key Regulations:

On July 19, 2021, the European Commission published the Regulation (EU) 2021/1175 of 16 July 2021 amending Annex II to Regulation (EC) No 1333/2008 on “The use of polyols in certain energy-reduced confectionery products.” Labelling of foods containing more than 10 % added polyols must include the mandatory statement ‘excessive consumption may produce laxative effects.

COVID-19 Analysis:

  • The COVID-19 pandemic had a vital impact on green polyol end-use industries such as automotive and construction. Lockdowns and societal estrangement have resulted in the closure of many manufacturing plants of green polyols.
  • Furthermore, during the COVID-19, there was increasing demand for flexible foam as food packaging provides protection from bacteria and increases the life span of the product stored. Pandemic-related lockdown measures had a significant impact on several green polyol's segments, including packaging. The COVID-19 pandemic increased demand for green polyols packaging owing to an increase in takeaway orders that employ single-use packaging.

Key Benefits For Stakeholders

  • This report provides a quantitative analysis of the market segments, current trends, estimations, and dynamics of the green polyols market analysis from 2021 to 2031 to identify the prevailing green polyols market opportunities.
  • The market research is offered along with information related to key drivers, restraints, and opportunities.
  • Porter's five forces analysis highlights the potency of buyers and suppliers to enable stakeholders make profit-oriented business decisions and strengthen their supplier-buyer network.
  • In-depth analysis of the green polyols market segmentation assists to determine the prevailing market opportunities.
  • Major countries in each region are mapped according to their revenue contribution to the global market.
  • Market player positioning facilitates benchmarking and provides a clear understanding of the present position of the market players.
  • The report includes the analysis of the regional as well as global green polyols market trends, key players, market segments, application areas, and market growth strategies.

Green Polyols Market Report Highlights

Aspects Details
Market Size By 2031 USD 17.2 billion
Growth Rate CAGR of 9.1%
Forecast period 2021 - 2031
Report Pages 250
By Type
  • Polyether Polyols 
  •  Polyester Polyols
By Application
  • Polyurethane Foam
  • Adhesives and Sealants
  • Coatings
  • Others
By End-use Industry
  • Construction
  • Packaging
  • Automotive
  • Others
  • Furniture and Bedding
By Region
  • North America  (U.S., Canada, Mexico)
  • Europe  (Germany, UK, France, Italy, Spain, Rest of Europe)
  • Asia-Pacific  (China, India, Japan, South Korea, Australia, Rest of Asia-Pacific)
  • LAMEA  (Brazil, South Africa,, Saudi Arabia, Rest of LAMEA)
Key Market Players IQS Global, BASF SE, Emery Oleochemicals LLC, Roquette, BioBased Technologies, Arkema, Cargill Incorporated, Covestro AG, Synthesia Technology Group, UniSol
 
  • CHAPTER 1:INTRODUCTION

    • 1.1.Report description

    • 1.2.Key market segments

    • 1.3.Key benefits to the stakeholders

    • 1.4.Research Methodology

      • 1.4.1.Secondary research

      • 1.4.2.Primary research

      • 1.4.3.Analyst tools and models

  • CHAPTER 2:EXECUTIVE SUMMARY

    • 2.1.Key findings of the study

    • 2.2.CXO Perspective

  • CHAPTER 3:MARKET OVERVIEW

    • 3.1.Market definition and scope

    • 3.2.Key findings

      • 3.2.1.Top investment pockets

    • 3.3.Porter’s five forces analysis

    • 3.4.Top player positioning

    • 3.5.Market dynamics

      • 3.5.1.Drivers

      • 3.5.2.Restraints

      • 3.5.3.Opportunities

    • 3.6.COVID-19 Impact Analysis on the market

    • 3.7.Pricing Analysis

    • 3.8.Value Chain Analysis

    • 3.9.Patent Landscape

  • CHAPTER 4: GREEN POLYOLS MARKET, BY TYPE

    • 4.1 Overview

      • 4.1.1 Market size and forecast

    • 4.2 Polyether Polyols 

      • 4.2.1 Key market trends, growth factors and opportunities

      • 4.2.2 Market size and forecast, by region

      • 4.2.3 Market share analysis by country

    • 4.3  Polyester Polyols

      • 4.3.1 Key market trends, growth factors and opportunities

      • 4.3.2 Market size and forecast, by region

      • 4.3.3 Market share analysis by country

  • CHAPTER 5: GREEN POLYOLS MARKET, BY APPLICATION

    • 5.1 Overview

      • 5.1.1 Market size and forecast

    • 5.2 Polyurethane Foam

      • 5.2.1 Key market trends, growth factors and opportunities

      • 5.2.2 Market size and forecast, by region

      • 5.2.3 Market share analysis by country

    • 5.3 Adhesives and Sealants

      • 5.3.1 Key market trends, growth factors and opportunities

      • 5.3.2 Market size and forecast, by region

      • 5.3.3 Market share analysis by country

    • 5.4 Coatings

      • 5.4.1 Key market trends, growth factors and opportunities

      • 5.4.2 Market size and forecast, by region

      • 5.4.3 Market share analysis by country

    • 5.5 Others

      • 5.5.1 Key market trends, growth factors and opportunities

      • 5.5.2 Market size and forecast, by region

      • 5.5.3 Market share analysis by country

  • CHAPTER 6: GREEN POLYOLS MARKET, BY END-USE INDUSTRY

    • 6.1 Overview

      • 6.1.1 Market size and forecast

    • 6.2 Furniture and Bedding

      • 6.2.1 Key market trends, growth factors and opportunities

      • 6.2.2 Market size and forecast, by region

      • 6.2.3 Market share analysis by country

    • 6.3 Construction

      • 6.3.1 Key market trends, growth factors and opportunities

      • 6.3.2 Market size and forecast, by region

      • 6.3.3 Market share analysis by country

    • 6.4 Packaging

      • 6.4.1 Key market trends, growth factors and opportunities

      • 6.4.2 Market size and forecast, by region

      • 6.4.3 Market share analysis by country

    • 6.5 Automotive

      • 6.5.1 Key market trends, growth factors and opportunities

      • 6.5.2 Market size and forecast, by region

      • 6.5.3 Market share analysis by country

    • 6.6 Others

      • 6.6.1 Key market trends, growth factors and opportunities

      • 6.6.2 Market size and forecast, by region

      • 6.6.3 Market share analysis by country

  • CHAPTER 7: GREEN POLYOLS MARKET, BY REGION

    • 7.1 Overview

      • 7.1.1 Market size and forecast

    • 7.2 North America

      • 7.2.1 Key trends and opportunities

      • 7.2.2 North America Market size and forecast, by Type

      • 7.2.3 North America Market size and forecast, by Application

      • 7.2.4 North America Market size and forecast, by End-use Industry

      • 7.2.5 North America Market size and forecast, by country

        • 7.2.5.1 U.S.
          • 7.2.5.1.1 Key market trends, growth factors and opportunities
          • 7.2.5.1.2 Market size and forecast, by Type
          • 7.2.5.1.3 Market size and forecast, by Application
          • 7.2.5.1.4 Market size and forecast, by End-use Industry
        • 7.2.5.2 Canada
          • 7.2.5.2.1 Key market trends, growth factors and opportunities
          • 7.2.5.2.2 Market size and forecast, by Type
          • 7.2.5.2.3 Market size and forecast, by Application
          • 7.2.5.2.4 Market size and forecast, by End-use Industry
        • 7.2.5.3 Mexico
          • 7.2.5.3.1 Key market trends, growth factors and opportunities
          • 7.2.5.3.2 Market size and forecast, by Type
          • 7.2.5.3.3 Market size and forecast, by Application
          • 7.2.5.3.4 Market size and forecast, by End-use Industry
    • 7.3 Europe

      • 7.3.1 Key trends and opportunities

      • 7.3.2 Europe Market size and forecast, by Type

      • 7.3.3 Europe Market size and forecast, by Application

      • 7.3.4 Europe Market size and forecast, by End-use Industry

      • 7.3.5 Europe Market size and forecast, by country

        • 7.3.5.1 Germany
          • 7.3.5.1.1 Key market trends, growth factors and opportunities
          • 7.3.5.1.2 Market size and forecast, by Type
          • 7.3.5.1.3 Market size and forecast, by Application
          • 7.3.5.1.4 Market size and forecast, by End-use Industry
        • 7.3.5.2 UK
          • 7.3.5.2.1 Key market trends, growth factors and opportunities
          • 7.3.5.2.2 Market size and forecast, by Type
          • 7.3.5.2.3 Market size and forecast, by Application
          • 7.3.5.2.4 Market size and forecast, by End-use Industry
        • 7.3.5.3 France
          • 7.3.5.3.1 Key market trends, growth factors and opportunities
          • 7.3.5.3.2 Market size and forecast, by Type
          • 7.3.5.3.3 Market size and forecast, by Application
          • 7.3.5.3.4 Market size and forecast, by End-use Industry
        • 7.3.5.4 Italy
          • 7.3.5.4.1 Key market trends, growth factors and opportunities
          • 7.3.5.4.2 Market size and forecast, by Type
          • 7.3.5.4.3 Market size and forecast, by Application
          • 7.3.5.4.4 Market size and forecast, by End-use Industry
        • 7.3.5.5 Spain
          • 7.3.5.5.1 Key market trends, growth factors and opportunities
          • 7.3.5.5.2 Market size and forecast, by Type
          • 7.3.5.5.3 Market size and forecast, by Application
          • 7.3.5.5.4 Market size and forecast, by End-use Industry
        • 7.3.5.6 Rest of Europe
          • 7.3.5.6.1 Key market trends, growth factors and opportunities
          • 7.3.5.6.2 Market size and forecast, by Type
          • 7.3.5.6.3 Market size and forecast, by Application
          • 7.3.5.6.4 Market size and forecast, by End-use Industry
    • 7.4 Asia-Pacific

      • 7.4.1 Key trends and opportunities

      • 7.4.2 Asia-Pacific Market size and forecast, by Type

      • 7.4.3 Asia-Pacific Market size and forecast, by Application

      • 7.4.4 Asia-Pacific Market size and forecast, by End-use Industry

      • 7.4.5 Asia-Pacific Market size and forecast, by country

        • 7.4.5.1 China
          • 7.4.5.1.1 Key market trends, growth factors and opportunities
          • 7.4.5.1.2 Market size and forecast, by Type
          • 7.4.5.1.3 Market size and forecast, by Application
          • 7.4.5.1.4 Market size and forecast, by End-use Industry
        • 7.4.5.2 India
          • 7.4.5.2.1 Key market trends, growth factors and opportunities
          • 7.4.5.2.2 Market size and forecast, by Type
          • 7.4.5.2.3 Market size and forecast, by Application
          • 7.4.5.2.4 Market size and forecast, by End-use Industry
        • 7.4.5.3 Japan
          • 7.4.5.3.1 Key market trends, growth factors and opportunities
          • 7.4.5.3.2 Market size and forecast, by Type
          • 7.4.5.3.3 Market size and forecast, by Application
          • 7.4.5.3.4 Market size and forecast, by End-use Industry
        • 7.4.5.4 South Korea
          • 7.4.5.4.1 Key market trends, growth factors and opportunities
          • 7.4.5.4.2 Market size and forecast, by Type
          • 7.4.5.4.3 Market size and forecast, by Application
          • 7.4.5.4.4 Market size and forecast, by End-use Industry
        • 7.4.5.5 Australia
          • 7.4.5.5.1 Key market trends, growth factors and opportunities
          • 7.4.5.5.2 Market size and forecast, by Type
          • 7.4.5.5.3 Market size and forecast, by Application
          • 7.4.5.5.4 Market size and forecast, by End-use Industry
        • 7.4.5.6 Rest of Asia-Pacific
          • 7.4.5.6.1 Key market trends, growth factors and opportunities
          • 7.4.5.6.2 Market size and forecast, by Type
          • 7.4.5.6.3 Market size and forecast, by Application
          • 7.4.5.6.4 Market size and forecast, by End-use Industry
    • 7.5 LAMEA

      • 7.5.1 Key trends and opportunities

      • 7.5.2 LAMEA Market size and forecast, by Type

      • 7.5.3 LAMEA Market size and forecast, by Application

      • 7.5.4 LAMEA Market size and forecast, by End-use Industry

      • 7.5.5 LAMEA Market size and forecast, by country

        • 7.5.5.1 Brazil
          • 7.5.5.1.1 Key market trends, growth factors and opportunities
          • 7.5.5.1.2 Market size and forecast, by Type
          • 7.5.5.1.3 Market size and forecast, by Application
          • 7.5.5.1.4 Market size and forecast, by End-use Industry
        • 7.5.5.2 South Africa,
          • 7.5.5.2.1 Key market trends, growth factors and opportunities
          • 7.5.5.2.2 Market size and forecast, by Type
          • 7.5.5.2.3 Market size and forecast, by Application
          • 7.5.5.2.4 Market size and forecast, by End-use Industry
        • 7.5.5.3 Saudi Arabia
          • 7.5.5.3.1 Key market trends, growth factors and opportunities
          • 7.5.5.3.2 Market size and forecast, by Type
          • 7.5.5.3.3 Market size and forecast, by Application
          • 7.5.5.3.4 Market size and forecast, by End-use Industry
        • 7.5.5.4 Rest of LAMEA
          • 7.5.5.4.1 Key market trends, growth factors and opportunities
          • 7.5.5.4.2 Market size and forecast, by Type
          • 7.5.5.4.3 Market size and forecast, by Application
          • 7.5.5.4.4 Market size and forecast, by End-use Industry
  • CHAPTER 8: COMPANY LANDSCAPE

    • 8.1. Introduction

    • 8.2. Top winning strategies

    • 8.3. Product Mapping of Top 10 Player

    • 8.4. Competitive Dashboard

    • 8.5. Competitive Heatmap

    • 8.6. Key developments

  • CHAPTER 9: COMPANY PROFILES

    • 9.1 Synthesia Technology Group

      • 9.1.1 Company overview

      • 9.1.2 Company snapshot

      • 9.1.3 Operating business segments

      • 9.1.4 Product portfolio

      • 9.1.5 Business performance

      • 9.1.6 Key strategic moves and developments

    • 9.2 UniSol

      • 9.2.1 Company overview

      • 9.2.2 Company snapshot

      • 9.2.3 Operating business segments

      • 9.2.4 Product portfolio

      • 9.2.5 Business performance

      • 9.2.6 Key strategic moves and developments

    • 9.3 BASF SE

      • 9.3.1 Company overview

      • 9.3.2 Company snapshot

      • 9.3.3 Operating business segments

      • 9.3.4 Product portfolio

      • 9.3.5 Business performance

      • 9.3.6 Key strategic moves and developments

    • 9.4 Cargill Incorporated

      • 9.4.1 Company overview

      • 9.4.2 Company snapshot

      • 9.4.3 Operating business segments

      • 9.4.4 Product portfolio

      • 9.4.5 Business performance

      • 9.4.6 Key strategic moves and developments

    • 9.5 Arkema

      • 9.5.1 Company overview

      • 9.5.2 Company snapshot

      • 9.5.3 Operating business segments

      • 9.5.4 Product portfolio

      • 9.5.5 Business performance

      • 9.5.6 Key strategic moves and developments

    • 9.6 Covestro AG

      • 9.6.1 Company overview

      • 9.6.2 Company snapshot

      • 9.6.3 Operating business segments

      • 9.6.4 Product portfolio

      • 9.6.5 Business performance

      • 9.6.6 Key strategic moves and developments

    • 9.7 IQS Global

      • 9.7.1 Company overview

      • 9.7.2 Company snapshot

      • 9.7.3 Operating business segments

      • 9.7.4 Product portfolio

      • 9.7.5 Business performance

      • 9.7.6 Key strategic moves and developments

    • 9.8 BioBased Technologies

      • 9.8.1 Company overview

      • 9.8.2 Company snapshot

      • 9.8.3 Operating business segments

      • 9.8.4 Product portfolio

      • 9.8.5 Business performance

      • 9.8.6 Key strategic moves and developments

    • 9.9 Emery Oleochemicals LLC

      • 9.9.1 Company overview

      • 9.9.2 Company snapshot

      • 9.9.3 Operating business segments

      • 9.9.4 Product portfolio

      • 9.9.5 Business performance

      • 9.9.6 Key strategic moves and developments

    • 9.10 Roquette

      • 9.10.1 Company overview

      • 9.10.2 Company snapshot

      • 9.10.3 Operating business segments

      • 9.10.4 Product portfolio

      • 9.10.5 Business performance

      • 9.10.6 Key strategic moves and developments

  • LIST OF TABLES

  • TABLE 1. GLOBAL GREEN POLYOLS MARKET, BY TYPE, 2021-2031 (REVENUE, $MILLION)
    TABLE 2. GLOBAL GREEN POLYOLS MARKET, BY TYPE, 2021-2031 (VOLUME, KILOTON)
    TABLE 3. GREEN POLYOLS MARKET FOR POLYETHER POLYOLS , BY REGION, 2021-2031 (REVENUE, $MILLION)
    TABLE 4. GREEN POLYOLS MARKET FOR POLYETHER POLYOLS , BY REGION, 2021-2031 (VOLUME, KILOTON)
    TABLE 5. GREEN POLYOLS MARKET FOR POLYETHER POLYOLS , BY COUNTRY, 2021-2031 (REVENUE, $MILLION)
    TABLE 6. GREEN POLYOLS MARKET FOR POLYETHER POLYOLS , BY COUNTRY, 2021-2031 (VOLUME, KILOTON)
    TABLE 7. GREEN POLYOLS MARKET FOR  POLYESTER POLYOLS, BY REGION, 2021-2031 (REVENUE, $MILLION)
    TABLE 8. GREEN POLYOLS MARKET FOR  POLYESTER POLYOLS, BY REGION, 2021-2031 (VOLUME, KILOTON)
    TABLE 9. GREEN POLYOLS MARKET FOR  POLYESTER POLYOLS, BY COUNTRY, 2021-2031 (REVENUE, $MILLION)
    TABLE 10. GREEN POLYOLS MARKET FOR  POLYESTER POLYOLS, BY COUNTRY, 2021-2031 (VOLUME, KILOTON)
    TABLE 11. GLOBAL GREEN POLYOLS MARKET, BY APPLICATION, 2021-2031 (REVENUE, $MILLION)
    TABLE 12. GLOBAL GREEN POLYOLS MARKET, BY APPLICATION, 2021-2031 (VOLUME, KILOTON)
    TABLE 13. GREEN POLYOLS MARKET FOR POLYURETHANE FOAM, BY REGION, 2021-2031 (REVENUE, $MILLION)
    TABLE 14. GREEN POLYOLS MARKET FOR POLYURETHANE FOAM, BY REGION, 2021-2031 (VOLUME, KILOTON)
    TABLE 15. GREEN POLYOLS MARKET FOR POLYURETHANE FOAM, BY COUNTRY, 2021-2031 (REVENUE, $MILLION)
    TABLE 16. GREEN POLYOLS MARKET FOR POLYURETHANE FOAM, BY COUNTRY, 2021-2031 (VOLUME, KILOTON)
    TABLE 17. GREEN POLYOLS MARKET FOR ADHESIVES AND SEALANTS, BY REGION, 2021-2031 (REVENUE, $MILLION)
    TABLE 18. GREEN POLYOLS MARKET FOR ADHESIVES AND SEALANTS, BY REGION, 2021-2031 (VOLUME, KILOTON)
    TABLE 19. GREEN POLYOLS MARKET FOR ADHESIVES AND SEALANTS, BY COUNTRY, 2021-2031 (REVENUE, $MILLION)
    TABLE 20. GREEN POLYOLS MARKET FOR ADHESIVES AND SEALANTS, BY COUNTRY, 2021-2031 (VOLUME, KILOTON)
    TABLE 21. GREEN POLYOLS MARKET FOR COATINGS, BY REGION, 2021-2031 (REVENUE, $MILLION)
    TABLE 22. GREEN POLYOLS MARKET FOR COATINGS, BY REGION, 2021-2031 (VOLUME, KILOTON)
    TABLE 23. GREEN POLYOLS MARKET FOR COATINGS, BY COUNTRY, 2021-2031 (REVENUE, $MILLION)
    TABLE 24. GREEN POLYOLS MARKET FOR COATINGS, BY COUNTRY, 2021-2031 (VOLUME, KILOTON)
    TABLE 25. GREEN POLYOLS MARKET FOR OTHERS, BY REGION, 2021-2031 (REVENUE, $MILLION)
    TABLE 26. GREEN POLYOLS MARKET FOR OTHERS, BY REGION, 2021-2031 (VOLUME, KILOTON)
    TABLE 27. GREEN POLYOLS MARKET FOR OTHERS, BY COUNTRY, 2021-2031 (REVENUE, $MILLION)
    TABLE 28. GREEN POLYOLS MARKET FOR OTHERS, BY COUNTRY, 2021-2031 (VOLUME, KILOTON)
    TABLE 29. GLOBAL GREEN POLYOLS MARKET, BY END-USE INDUSTRY, 2021-2031 (REVENUE, $MILLION)
    TABLE 30. GLOBAL GREEN POLYOLS MARKET, BY END-USE INDUSTRY, 2021-2031 (VOLUME, KILOTON)
    TABLE 31. GREEN POLYOLS MARKET FOR FURNITURE AND BEDDING, BY REGION, 2021-2031 (REVENUE, $MILLION)
    TABLE 32. GREEN POLYOLS MARKET FOR FURNITURE AND BEDDING, BY REGION, 2021-2031 (VOLUME, KILOTON)
    TABLE 33. GREEN POLYOLS MARKET FOR FURNITURE AND BEDDING, BY COUNTRY, 2021-2031 (REVENUE, $MILLION)
    TABLE 34. GREEN POLYOLS MARKET FOR FURNITURE AND BEDDING, BY COUNTRY, 2021-2031 (VOLUME, KILOTON)
    TABLE 35. GREEN POLYOLS MARKET FOR CONSTRUCTION, BY REGION, 2021-2031 (REVENUE, $MILLION)
    TABLE 36. GREEN POLYOLS MARKET FOR CONSTRUCTION, BY REGION, 2021-2031 (VOLUME, KILOTON)
    TABLE 37. GREEN POLYOLS MARKET FOR CONSTRUCTION, BY COUNTRY, 2021-2031 (REVENUE, $MILLION)
    TABLE 38. GREEN POLYOLS MARKET FOR CONSTRUCTION, BY COUNTRY, 2021-2031 (VOLUME, KILOTON)
    TABLE 39. GREEN POLYOLS MARKET FOR PACKAGING, BY REGION, 2021-2031 (REVENUE, $MILLION)
    TABLE 40. GREEN POLYOLS MARKET FOR PACKAGING, BY REGION, 2021-2031 (VOLUME, KILOTON)
    TABLE 41. GREEN POLYOLS MARKET FOR PACKAGING, BY COUNTRY, 2021-2031 (REVENUE, $MILLION)
    TABLE 42. GREEN POLYOLS MARKET FOR PACKAGING, BY COUNTRY, 2021-2031 (VOLUME, KILOTON)
    TABLE 43. GREEN POLYOLS MARKET FOR AUTOMOTIVE, BY REGION, 2021-2031 (REVENUE, $MILLION)
    TABLE 44. GREEN POLYOLS MARKET FOR AUTOMOTIVE, BY REGION, 2021-2031 (VOLUME, KILOTON)
    TABLE 45. GREEN POLYOLS MARKET FOR AUTOMOTIVE, BY COUNTRY, 2021-2031 (REVENUE, $MILLION)
    TABLE 46. GREEN POLYOLS MARKET FOR AUTOMOTIVE, BY COUNTRY, 2021-2031 (VOLUME, KILOTON)
    TABLE 47. GREEN POLYOLS MARKET FOR OTHERS, BY REGION, 2021-2031 (REVENUE, $MILLION)
    TABLE 48. GREEN POLYOLS MARKET FOR OTHERS, BY REGION, 2021-2031 (VOLUME, KILOTON)
    TABLE 49. GREEN POLYOLS MARKET FOR OTHERS, BY COUNTRY, 2021-2031 (REVENUE, $MILLION)
    TABLE 50. GREEN POLYOLS MARKET FOR OTHERS, BY COUNTRY, 2021-2031 (VOLUME, KILOTON)
    TABLE 51. GREEN POLYOLS MARKET, BY REGION, 2021-2031 (REVENUE, $MILLION)
    TABLE 52. GREEN POLYOLS MARKET, BY REGION, 2021-2031 (VOLUME, KILOTON)
    TABLE 53. NORTH AMERICA GREEN POLYOLS MARKET, BY TYPE, 2021-2031 (REVENUE, $MILLION)
    TABLE 54. NORTH AMERICA GREEN POLYOLS MARKET, BY TYPE, 2021-2031 (VOLUME, KILOTON)
    TABLE 55. NORTH AMERICA GREEN POLYOLS MARKET, BY APPLICATION, 2021-2031 (REVENUE, $MILLION)
    TABLE 56. NORTH AMERICA GREEN POLYOLS MARKET, BY APPLICATION, 2021-2031 (VOLUME, KILOTON)
    TABLE 57. NORTH AMERICA GREEN POLYOLS MARKET, BY END-USE INDUSTRY, 2021-2031 (REVENUE, $MILLION)
    TABLE 58. NORTH AMERICA GREEN POLYOLS MARKET, BY END-USE INDUSTRY, 2021-2031 (VOLUME, KILOTON)
    TABLE 59. NORTH AMERICA GREEN POLYOLS MARKET, BY COUNTRY, 2021-2031 (REVENUE, $MILLION)
    TABLE 60. NORTH AMERICA GREEN POLYOLS MARKET, BY COUNTRY, 2021-2031 (VOLUME, KILOTON)
    TABLE 61. U.S. GREEN POLYOLS MARKET, BY TYPE, 2021-2031 (REVENUE, $MILLION)
    TABLE 62. U.S. GREEN POLYOLS MARKET, BY TYPE, 2021-2031 (VOLUME, KILOTON)
    TABLE 63. U.S. GREEN POLYOLS MARKET, BY APPLICATION, 2021-2031 (REVENUE, $MILLION)
    TABLE 64. U.S. GREEN POLYOLS MARKET, BY APPLICATION, 2021-2031 (VOLUME, KILOTON)
    TABLE 65. U.S. GREEN POLYOLS MARKET, BY END-USE INDUSTRY, 2021-2031 (REVENUE, $MILLION)
    TABLE 66. U.S. GREEN POLYOLS MARKET, BY END-USE INDUSTRY, 2021-2031 (VOLUME, KILOTON)
    TABLE 67. CANADA GREEN POLYOLS MARKET, BY TYPE, 2021-2031 (REVENUE, $MILLION)
    TABLE 68. CANADA GREEN POLYOLS MARKET, BY TYPE, 2021-2031 (VOLUME, KILOTON)
    TABLE 69. CANADA GREEN POLYOLS MARKET, BY APPLICATION, 2021-2031 (REVENUE, $MILLION)
    TABLE 70. CANADA GREEN POLYOLS MARKET, BY APPLICATION, 2021-2031 (VOLUME, KILOTON)
    TABLE 71. CANADA GREEN POLYOLS MARKET, BY END-USE INDUSTRY, 2021-2031 (REVENUE, $MILLION)
    TABLE 72. CANADA GREEN POLYOLS MARKET, BY END-USE INDUSTRY, 2021-2031 (VOLUME, KILOTON)
    TABLE 73. MEXICO GREEN POLYOLS MARKET, BY TYPE, 2021-2031 (REVENUE, $MILLION)
    TABLE 74. MEXICO GREEN POLYOLS MARKET, BY TYPE, 2021-2031 (VOLUME, KILOTON)
    TABLE 75. MEXICO GREEN POLYOLS MARKET, BY APPLICATION, 2021-2031 (REVENUE, $MILLION)
    TABLE 76. MEXICO GREEN POLYOLS MARKET, BY APPLICATION, 2021-2031 (VOLUME, KILOTON)
    TABLE 77. MEXICO GREEN POLYOLS MARKET, BY END-USE INDUSTRY, 2021-2031 (REVENUE, $MILLION)
    TABLE 78. MEXICO GREEN POLYOLS MARKET, BY END-USE INDUSTRY, 2021-2031 (VOLUME, KILOTON)
    TABLE 79. EUROPE GREEN POLYOLS MARKET, BY TYPE, 2021-2031 (REVENUE, $MILLION)
    TABLE 80. EUROPE GREEN POLYOLS MARKET, BY TYPE, 2021-2031 (VOLUME, KILOTON)
    TABLE 81. EUROPE GREEN POLYOLS MARKET, BY APPLICATION, 2021-2031 (REVENUE, $MILLION)
    TABLE 82. EUROPE GREEN POLYOLS MARKET, BY APPLICATION, 2021-2031 (VOLUME, KILOTON)
    TABLE 83. EUROPE GREEN POLYOLS MARKET, BY END-USE INDUSTRY, 2021-2031 (REVENUE, $MILLION)
    TABLE 84. EUROPE GREEN POLYOLS MARKET, BY END-USE INDUSTRY, 2021-2031 (VOLUME, KILOTON)
    TABLE 85. EUROPE GREEN POLYOLS MARKET, BY COUNTRY, 2021-2031 (REVENUE, $MILLION)
    TABLE 86. EUROPE GREEN POLYOLS MARKET, BY COUNTRY, 2021-2031 (VOLUME, KILOTON)
    TABLE 87. GERMANY GREEN POLYOLS MARKET, BY TYPE, 2021-2031 (REVENUE, $MILLION)
    TABLE 88. GERMANY GREEN POLYOLS MARKET, BY TYPE, 2021-2031 (VOLUME, KILOTON)
    TABLE 89. GERMANY GREEN POLYOLS MARKET, BY APPLICATION, 2021-2031 (REVENUE, $MILLION)
    TABLE 90. GERMANY GREEN POLYOLS MARKET, BY APPLICATION, 2021-2031 (VOLUME, KILOTON)
    TABLE 91. GERMANY GREEN POLYOLS MARKET, BY END-USE INDUSTRY, 2021-2031 (REVENUE, $MILLION)
    TABLE 92. GERMANY GREEN POLYOLS MARKET, BY END-USE INDUSTRY, 2021-2031 (VOLUME, KILOTON)
    TABLE 93. UK GREEN POLYOLS MARKET, BY TYPE, 2021-2031 (REVENUE, $MILLION)
    TABLE 94. UK GREEN POLYOLS MARKET, BY TYPE, 2021-2031 (VOLUME, KILOTON)
    TABLE 95. UK GREEN POLYOLS MARKET, BY APPLICATION, 2021-2031 (REVENUE, $MILLION)
    TABLE 96. UK GREEN POLYOLS MARKET, BY APPLICATION, 2021-2031 (VOLUME, KILOTON)
    TABLE 97. UK GREEN POLYOLS MARKET, BY END-USE INDUSTRY, 2021-2031 (REVENUE, $MILLION)
    TABLE 98. UK GREEN POLYOLS MARKET, BY END-USE INDUSTRY, 2021-2031 (VOLUME, KILOTON)
    TABLE 99. FRANCE GREEN POLYOLS MARKET, BY TYPE, 2021-2031 (REVENUE, $MILLION)
    TABLE 100. FRANCE GREEN POLYOLS MARKET, BY TYPE, 2021-2031 (VOLUME, KILOTON)
    TABLE 101. FRANCE GREEN POLYOLS MARKET, BY APPLICATION, 2021-2031 (REVENUE, $MILLION)
    TABLE 102. FRANCE GREEN POLYOLS MARKET, BY APPLICATION, 2021-2031 (VOLUME, KILOTON)
    TABLE 103. FRANCE GREEN POLYOLS MARKET, BY END-USE INDUSTRY, 2021-2031 (REVENUE, $MILLION)
    TABLE 104. FRANCE GREEN POLYOLS MARKET, BY END-USE INDUSTRY, 2021-2031 (VOLUME, KILOTON)
    TABLE 105. ITALY GREEN POLYOLS MARKET, BY TYPE, 2021-2031 (REVENUE, $MILLION)
    TABLE 106. ITALY GREEN POLYOLS MARKET, BY TYPE, 2021-2031 (VOLUME, KILOTON)
    TABLE 107. ITALY GREEN POLYOLS MARKET, BY APPLICATION, 2021-2031 (REVENUE, $MILLION)
    TABLE 108. ITALY GREEN POLYOLS MARKET, BY APPLICATION, 2021-2031 (VOLUME, KILOTON)
    TABLE 109. ITALY GREEN POLYOLS MARKET, BY END-USE INDUSTRY, 2021-2031 (REVENUE, $MILLION)
    TABLE 110. ITALY GREEN POLYOLS MARKET, BY END-USE INDUSTRY, 2021-2031 (VOLUME, KILOTON)
    TABLE 111. SPAIN GREEN POLYOLS MARKET, BY TYPE, 2021-2031 (REVENUE, $MILLION)
    TABLE 112. SPAIN GREEN POLYOLS MARKET, BY TYPE, 2021-2031 (VOLUME, KILOTON)
    TABLE 113. SPAIN GREEN POLYOLS MARKET, BY APPLICATION, 2021-2031 (REVENUE, $MILLION)
    TABLE 114. SPAIN GREEN POLYOLS MARKET, BY APPLICATION, 2021-2031 (VOLUME, KILOTON)
    TABLE 115. SPAIN GREEN POLYOLS MARKET, BY END-USE INDUSTRY, 2021-2031 (REVENUE, $MILLION)
    TABLE 116. SPAIN GREEN POLYOLS MARKET, BY END-USE INDUSTRY, 2021-2031 (VOLUME, KILOTON)
    TABLE 117. REST OF EUROPE GREEN POLYOLS MARKET, BY TYPE, 2021-2031 (REVENUE, $MILLION)
    TABLE 118. REST OF EUROPE GREEN POLYOLS MARKET, BY TYPE, 2021-2031 (VOLUME, KILOTON)
    TABLE 119. REST OF EUROPE GREEN POLYOLS MARKET, BY APPLICATION, 2021-2031 (REVENUE, $MILLION)
    TABLE 120. REST OF EUROPE GREEN POLYOLS MARKET, BY APPLICATION, 2021-2031 (VOLUME, KILOTON)
    TABLE 121. REST OF EUROPE GREEN POLYOLS MARKET, BY END-USE INDUSTRY, 2021-2031 (REVENUE, $MILLION)
    TABLE 122. REST OF EUROPE GREEN POLYOLS MARKET, BY END-USE INDUSTRY, 2021-2031 (VOLUME, KILOTON)
    TABLE 123. ASIA-PACIFIC GREEN POLYOLS MARKET, BY TYPE, 2021-2031 (REVENUE, $MILLION)
    TABLE 124. ASIA-PACIFIC GREEN POLYOLS MARKET, BY TYPE, 2021-2031 (VOLUME, KILOTON)
    TABLE 125. ASIA-PACIFIC GREEN POLYOLS MARKET, BY APPLICATION, 2021-2031 (REVENUE, $MILLION)
    TABLE 126. ASIA-PACIFIC GREEN POLYOLS MARKET, BY APPLICATION, 2021-2031 (VOLUME, KILOTON)
    TABLE 127. ASIA-PACIFIC GREEN POLYOLS MARKET, BY END-USE INDUSTRY, 2021-2031 (REVENUE, $MILLION)
    TABLE 128. ASIA-PACIFIC GREEN POLYOLS MARKET, BY END-USE INDUSTRY, 2021-2031 (VOLUME, KILOTON)
    TABLE 129. ASIA-PACIFIC GREEN POLYOLS MARKET, BY COUNTRY, 2021-2031 (REVENUE, $MILLION)
    TABLE 130. ASIA-PACIFIC GREEN POLYOLS MARKET, BY COUNTRY, 2021-2031 (VOLUME, KILOTON)
    TABLE 131. CHINA GREEN POLYOLS MARKET, BY TYPE, 2021-2031 (REVENUE, $MILLION)
    TABLE 132. CHINA GREEN POLYOLS MARKET, BY TYPE, 2021-2031 (VOLUME, KILOTON)
    TABLE 133. CHINA GREEN POLYOLS MARKET, BY APPLICATION, 2021-2031 (REVENUE, $MILLION)
    TABLE 134. CHINA GREEN POLYOLS MARKET, BY APPLICATION, 2021-2031 (VOLUME, KILOTON)
    TABLE 135. CHINA GREEN POLYOLS MARKET, BY END-USE INDUSTRY, 2021-2031 (REVENUE, $MILLION)
    TABLE 136. CHINA GREEN POLYOLS MARKET, BY END-USE INDUSTRY, 2021-2031 (VOLUME, KILOTON)
    TABLE 137. INDIA GREEN POLYOLS MARKET, BY TYPE, 2021-2031 (REVENUE, $MILLION)
    TABLE 138. INDIA GREEN POLYOLS MARKET, BY TYPE, 2021-2031 (VOLUME, KILOTON)
    TABLE 139. INDIA GREEN POLYOLS MARKET, BY APPLICATION, 2021-2031 (REVENUE, $MILLION)
    TABLE 140. INDIA GREEN POLYOLS MARKET, BY APPLICATION, 2021-2031 (VOLUME, KILOTON)
    TABLE 141. INDIA GREEN POLYOLS MARKET, BY END-USE INDUSTRY, 2021-2031 (REVENUE, $MILLION)
    TABLE 142. INDIA GREEN POLYOLS MARKET, BY END-USE INDUSTRY, 2021-2031 (VOLUME, KILOTON)
    TABLE 143. JAPAN GREEN POLYOLS MARKET, BY TYPE, 2021-2031 (REVENUE, $MILLION)
    TABLE 144. JAPAN GREEN POLYOLS MARKET, BY TYPE, 2021-2031 (VOLUME, KILOTON)
    TABLE 145. JAPAN GREEN POLYOLS MARKET, BY APPLICATION, 2021-2031 (REVENUE, $MILLION)
    TABLE 146. JAPAN GREEN POLYOLS MARKET, BY APPLICATION, 2021-2031 (VOLUME, KILOTON)
    TABLE 147. JAPAN GREEN POLYOLS MARKET, BY END-USE INDUSTRY, 2021-2031 (REVENUE, $MILLION)
    TABLE 148. JAPAN GREEN POLYOLS MARKET, BY END-USE INDUSTRY, 2021-2031 (VOLUME, KILOTON)
    TABLE 149. SOUTH KOREA GREEN POLYOLS MARKET, BY TYPE, 2021-2031 (REVENUE, $MILLION)
    TABLE 150. SOUTH KOREA GREEN POLYOLS MARKET, BY TYPE, 2021-2031 (VOLUME, KILOTON)
    TABLE 151. SOUTH KOREA GREEN POLYOLS MARKET, BY APPLICATION, 2021-2031 (REVENUE, $MILLION)
    TABLE 152. SOUTH KOREA GREEN POLYOLS MARKET, BY APPLICATION, 2021-2031 (VOLUME, KILOTON)
    TABLE 153. SOUTH KOREA GREEN POLYOLS MARKET, BY END-USE INDUSTRY, 2021-2031 (REVENUE, $MILLION)
    TABLE 154. SOUTH KOREA GREEN POLYOLS MARKET, BY END-USE INDUSTRY, 2021-2031 (VOLUME, KILOTON)
    TABLE 155. AUSTRALIA GREEN POLYOLS MARKET, BY TYPE, 2021-2031 (REVENUE, $MILLION)
    TABLE 156. AUSTRALIA GREEN POLYOLS MARKET, BY TYPE, 2021-2031 (VOLUME, KILOTON)
    TABLE 157. AUSTRALIA GREEN POLYOLS MARKET, BY APPLICATION, 2021-2031 (REVENUE, $MILLION)
    TABLE 158. AUSTRALIA GREEN POLYOLS MARKET, BY APPLICATION, 2021-2031 (VOLUME, KILOTON)
    TABLE 159. AUSTRALIA GREEN POLYOLS MARKET, BY END-USE INDUSTRY, 2021-2031 (REVENUE, $MILLION)
    TABLE 160. AUSTRALIA GREEN POLYOLS MARKET, BY END-USE INDUSTRY, 2021-2031 (VOLUME, KILOTON)
    TABLE 161. REST OF ASIA-PACIFIC GREEN POLYOLS MARKET, BY TYPE, 2021-2031 (REVENUE, $MILLION)
    TABLE 162. REST OF ASIA-PACIFIC GREEN POLYOLS MARKET, BY TYPE, 2021-2031 (VOLUME, KILOTON)
    TABLE 163. REST OF ASIA-PACIFIC GREEN POLYOLS MARKET, BY APPLICATION, 2021-2031 (REVENUE, $MILLION)
    TABLE 164. REST OF ASIA-PACIFIC GREEN POLYOLS MARKET, BY APPLICATION, 2021-2031 (VOLUME, KILOTON)
    TABLE 165. REST OF ASIA-PACIFIC GREEN POLYOLS MARKET, BY END-USE INDUSTRY, 2021-2031 (REVENUE, $MILLION)
    TABLE 166. REST OF ASIA-PACIFIC GREEN POLYOLS MARKET, BY END-USE INDUSTRY, 2021-2031 (VOLUME, KILOTON)
    TABLE 167. LAMEA GREEN POLYOLS MARKET, BY TYPE, 2021-2031 (REVENUE, $MILLION)
    TABLE 168. LAMEA GREEN POLYOLS MARKET, BY TYPE, 2021-2031 (VOLUME, KILOTON)
    TABLE 169. LAMEA GREEN POLYOLS MARKET, BY APPLICATION, 2021-2031 (REVENUE, $MILLION)
    TABLE 170. LAMEA GREEN POLYOLS MARKET, BY APPLICATION, 2021-2031 (VOLUME, KILOTON)
    TABLE 171. LAMEA GREEN POLYOLS MARKET, BY END-USE INDUSTRY, 2021-2031 (REVENUE, $MILLION)
    TABLE 172. LAMEA GREEN POLYOLS MARKET, BY END-USE INDUSTRY, 2021-2031 (VOLUME, KILOTON)
    TABLE 173. LAMEA GREEN POLYOLS MARKET, BY COUNTRY, 2021-2031 (REVENUE, $MILLION)
    TABLE 174. LAMEA GREEN POLYOLS MARKET, BY COUNTRY, 2021-2031 (VOLUME, KILOTON)
    TABLE 175. BRAZIL GREEN POLYOLS MARKET, BY TYPE, 2021-2031 (REVENUE, $MILLION)
    TABLE 176. BRAZIL GREEN POLYOLS MARKET, BY TYPE, 2021-2031 (VOLUME, KILOTON)
    TABLE 177. BRAZIL GREEN POLYOLS MARKET, BY APPLICATION, 2021-2031 (REVENUE, $MILLION)
    TABLE 178. BRAZIL GREEN POLYOLS MARKET, BY APPLICATION, 2021-2031 (VOLUME, KILOTON)
    TABLE 179. BRAZIL GREEN POLYOLS MARKET, BY END-USE INDUSTRY, 2021-2031 (REVENUE, $MILLION)
    TABLE 180. BRAZIL GREEN POLYOLS MARKET, BY END-USE INDUSTRY, 2021-2031 (VOLUME, KILOTON)
    TABLE 181. SOUTH AFRICA, GREEN POLYOLS MARKET, BY TYPE, 2021-2031 (REVENUE, $MILLION)
    TABLE 182. SOUTH AFRICA, GREEN POLYOLS MARKET, BY TYPE, 2021-2031 (VOLUME, KILOTON)
    TABLE 183. SOUTH AFRICA, GREEN POLYOLS MARKET, BY APPLICATION, 2021-2031 (REVENUE, $MILLION)
    TABLE 184. SOUTH AFRICA, GREEN POLYOLS MARKET, BY APPLICATION, 2021-2031 (VOLUME, KILOTON)
    TABLE 185. SOUTH AFRICA, GREEN POLYOLS MARKET, BY END-USE INDUSTRY, 2021-2031 (REVENUE, $MILLION)
    TABLE 186. SOUTH AFRICA, GREEN POLYOLS MARKET, BY END-USE INDUSTRY, 2021-2031 (VOLUME, KILOTON)
    TABLE 187. SAUDI ARABIA GREEN POLYOLS MARKET, BY TYPE, 2021-2031 (REVENUE, $MILLION)
    TABLE 188. SAUDI ARABIA GREEN POLYOLS MARKET, BY TYPE, 2021-2031 (VOLUME, KILOTON)
    TABLE 189. SAUDI ARABIA GREEN POLYOLS MARKET, BY APPLICATION, 2021-2031 (REVENUE, $MILLION)
    TABLE 190. SAUDI ARABIA GREEN POLYOLS MARKET, BY APPLICATION, 2021-2031 (VOLUME, KILOTON)
    TABLE 191. SAUDI ARABIA GREEN POLYOLS MARKET, BY END-USE INDUSTRY, 2021-2031 (REVENUE, $MILLION)
    TABLE 192. SAUDI ARABIA GREEN POLYOLS MARKET, BY END-USE INDUSTRY, 2021-2031 (VOLUME, KILOTON)
    TABLE 193. REST OF LAMEA GREEN POLYOLS MARKET, BY TYPE, 2021-2031 (REVENUE, $MILLION)
    TABLE 194. REST OF LAMEA GREEN POLYOLS MARKET, BY TYPE, 2021-2031 (VOLUME, KILOTON)
    TABLE 195. REST OF LAMEA GREEN POLYOLS MARKET, BY APPLICATION, 2021-2031 (REVENUE, $MILLION)
    TABLE 196. REST OF LAMEA GREEN POLYOLS MARKET, BY APPLICATION, 2021-2031 (VOLUME, KILOTON)
    TABLE 197. REST OF LAMEA GREEN POLYOLS MARKET, BY END-USE INDUSTRY, 2021-2031 (REVENUE, $MILLION)
    TABLE 198. REST OF LAMEA GREEN POLYOLS MARKET, BY END-USE INDUSTRY, 2021-2031 (VOLUME, KILOTON)
    TABLE 199.SYNTHESIA TECHNOLOGY GROUP: COMPANY SNAPSHOT
    TABLE 200.SYNTHESIA TECHNOLOGY GROUP: OPERATING SEGMENTS
    TABLE 201.SYNTHESIA TECHNOLOGY GROUP: PRODUCT PORTFOLIO
    TABLE 202.SYNTHESIA TECHNOLOGY GROUP: NET SALES
    TABLE 203.SYNTHESIA TECHNOLOGY GROUP: KEY STRATERGIES
    TABLE 204.UNISOL: COMPANY SNAPSHOT
    TABLE 205.UNISOL: OPERATING SEGMENTS
    TABLE 206.UNISOL: PRODUCT PORTFOLIO
    TABLE 207.UNISOL: NET SALES
    TABLE 208.UNISOL: KEY STRATERGIES
    TABLE 209.BASF SE: COMPANY SNAPSHOT
    TABLE 210.BASF SE: OPERATING SEGMENTS
    TABLE 211.BASF SE: PRODUCT PORTFOLIO
    TABLE 212.BASF SE: NET SALES
    TABLE 213.BASF SE: KEY STRATERGIES
    TABLE 214.CARGILL INCORPORATED: COMPANY SNAPSHOT
    TABLE 215.CARGILL INCORPORATED: OPERATING SEGMENTS
    TABLE 216.CARGILL INCORPORATED: PRODUCT PORTFOLIO
    TABLE 217.CARGILL INCORPORATED: NET SALES
    TABLE 218.CARGILL INCORPORATED: KEY STRATERGIES
    TABLE 219.ARKEMA: COMPANY SNAPSHOT
    TABLE 220.ARKEMA: OPERATING SEGMENTS
    TABLE 221.ARKEMA: PRODUCT PORTFOLIO
    TABLE 222.ARKEMA: NET SALES
    TABLE 223.ARKEMA: KEY STRATERGIES
    TABLE 224.COVESTRO AG: COMPANY SNAPSHOT
    TABLE 225.COVESTRO AG: OPERATING SEGMENTS
    TABLE 226.COVESTRO AG: PRODUCT PORTFOLIO
    TABLE 227.COVESTRO AG: NET SALES
    TABLE 228.COVESTRO AG: KEY STRATERGIES
    TABLE 229.IQS GLOBAL: COMPANY SNAPSHOT
    TABLE 230.IQS GLOBAL: OPERATING SEGMENTS
    TABLE 231.IQS GLOBAL: PRODUCT PORTFOLIO
    TABLE 232.IQS GLOBAL: NET SALES
    TABLE 233.IQS GLOBAL: KEY STRATERGIES
    TABLE 234.BIOBASED TECHNOLOGIES: COMPANY SNAPSHOT
    TABLE 235.BIOBASED TECHNOLOGIES: OPERATING SEGMENTS
    TABLE 236.BIOBASED TECHNOLOGIES: PRODUCT PORTFOLIO
    TABLE 237.BIOBASED TECHNOLOGIES: NET SALES
    TABLE 238.BIOBASED TECHNOLOGIES: KEY STRATERGIES
    TABLE 239.EMERY OLEOCHEMICALS LLC: COMPANY SNAPSHOT
    TABLE 240.EMERY OLEOCHEMICALS LLC: OPERATING SEGMENTS
    TABLE 241.EMERY OLEOCHEMICALS LLC: PRODUCT PORTFOLIO
    TABLE 242.EMERY OLEOCHEMICALS LLC: NET SALES
    TABLE 243.EMERY OLEOCHEMICALS LLC: KEY STRATERGIES
    TABLE 244.ROQUETTE: COMPANY SNAPSHOT
    TABLE 245.ROQUETTE: OPERATING SEGMENTS
    TABLE 246.ROQUETTE: PRODUCT PORTFOLIO
    TABLE 247.ROQUETTE: NET SALES
    TABLE 248.ROQUETTE: KEY STRATERGIES
  • LIST OF FIGURES

  • FIGURE 1.GREEN POLYOLS MARKET SEGMENTATION
    FIGURE 2.GREEN POLYOLS MARKET,2021-2031
    FIGURE 3.GREEN POLYOLS MARKET,2021-2031
    FIGURE 4. TOP INVESTMENT POCKETS, BY REGION
    FIGURE 5.PORTER FIVE-1
    FIGURE 6.PORTER FIVE-2
    FIGURE 7.PORTER FIVE-3
    FIGURE 8.PORTER FIVE-4
    FIGURE 9.PORTER FIVE-5
    FIGURE 10.TOP PLAYER POSITIONING
    FIGURE 11.GREEN POLYOLS MARKET:DRIVERS, RESTRAINTS AND OPPORTUNITIES
    FIGURE 12.PRICING ANALYSIS
    FIGURE 13.VALUE CHAIN ANALYSIS
    FIGURE 14.PATENT ANALYSIS BY COMPANY
    FIGURE 15.PATENT ANALYSIS BY COUNTRY
    FIGURE 16.GREEN POLYOLS MARKET,BY TYPE,2021(%)
    FIGURE 17.COMPARATIVE SHARE ANALYSIS OF POLYETHER POLYOLS  GREEN POLYOLS MARKET,2021-2031(%)
    FIGURE 18.COMPARATIVE SHARE ANALYSIS OF  POLYESTER POLYOLS GREEN POLYOLS MARKET,2021-2031(%)
    FIGURE 19.GREEN POLYOLS MARKET,BY APPLICATION,2021(%)
    FIGURE 20.COMPARATIVE SHARE ANALYSIS OF POLYURETHANE FOAM GREEN POLYOLS MARKET,2021-2031(%)
    FIGURE 21.COMPARATIVE SHARE ANALYSIS OF ADHESIVES AND SEALANTS GREEN POLYOLS MARKET,2021-2031(%)
    FIGURE 22.COMPARATIVE SHARE ANALYSIS OF COATINGS GREEN POLYOLS MARKET,2021-2031(%)
    FIGURE 23.COMPARATIVE SHARE ANALYSIS OF OTHERS GREEN POLYOLS MARKET,2021-2031(%)
    FIGURE 24.GREEN POLYOLS MARKET,BY END-USE INDUSTRY,2021(%)
    FIGURE 25.COMPARATIVE SHARE ANALYSIS OF FURNITURE AND BEDDING GREEN POLYOLS MARKET,2021-2031(%)
    FIGURE 26.COMPARATIVE SHARE ANALYSIS OF CONSTRUCTION GREEN POLYOLS MARKET,2021-2031(%)
    FIGURE 27.COMPARATIVE SHARE ANALYSIS OF PACKAGING GREEN POLYOLS MARKET,2021-2031(%)
    FIGURE 28.COMPARATIVE SHARE ANALYSIS OF AUTOMOTIVE GREEN POLYOLS MARKET,2021-2031(%)
    FIGURE 29.COMPARATIVE SHARE ANALYSIS OF OTHERS GREEN POLYOLS MARKET,2021-2031(%)
    FIGURE 30.GREEN POLYOLS MARKET BY REGION,2021
    FIGURE 31.U.S. GREEN POLYOLS MARKET,2021-2031($MILLION)
    FIGURE 32.CANADA GREEN POLYOLS MARKET,2021-2031($MILLION)
    FIGURE 33.MEXICO GREEN POLYOLS MARKET,2021-2031($MILLION)
    FIGURE 34.GERMANY GREEN POLYOLS MARKET,2021-2031($MILLION)
    FIGURE 35.UK GREEN POLYOLS MARKET,2021-2031($MILLION)
    FIGURE 36.FRANCE GREEN POLYOLS MARKET,2021-2031($MILLION)
    FIGURE 37.ITALY GREEN POLYOLS MARKET,2021-2031($MILLION)
    FIGURE 38.SPAIN GREEN POLYOLS MARKET,2021-2031($MILLION)
    FIGURE 39.REST OF EUROPE GREEN POLYOLS MARKET,2021-2031($MILLION)
    FIGURE 40.CHINA GREEN POLYOLS MARKET,2021-2031($MILLION)
    FIGURE 41.INDIA GREEN POLYOLS MARKET,2021-2031($MILLION)
    FIGURE 42.JAPAN GREEN POLYOLS MARKET,2021-2031($MILLION)
    FIGURE 43.SOUTH KOREA GREEN POLYOLS MARKET,2021-2031($MILLION)
    FIGURE 44.AUSTRALIA GREEN POLYOLS MARKET,2021-2031($MILLION)
    FIGURE 45.REST OF ASIA-PACIFIC GREEN POLYOLS MARKET,2021-2031($MILLION)
    FIGURE 46.BRAZIL GREEN POLYOLS MARKET,2021-2031($MILLION)
    FIGURE 47.SOUTH AFRICA, GREEN POLYOLS MARKET,2021-2031($MILLION)
    FIGURE 48.SAUDI ARABIA GREEN POLYOLS MARKET,2021-2031($MILLION)
    FIGURE 49.REST OF LAMEA GREEN POLYOLS MARKET,2021-2031($MILLION)
    FIGURE 50. TOP WINNING STRATEGIES, BY YEAR
    FIGURE 51. TOP WINNING STRATEGIES, BY DEVELOPMENT
    FIGURE 52. TOP WINNING STRATEGIES, BY COMPANY
    FIGURE 53.PRODUCT MAPPING OF TOP 10 PLAYERS
    FIGURE 54.COMPETITIVE DASHBOARD
    FIGURE 55.COMPETITIVE HEATMAP OF TOP 10 KEY PLAYERS
    FIGURE 56.SYNTHESIA TECHNOLOGY GROUP.: NET SALES ($MILLION)
    FIGURE 57.UNISOL.: NET SALES ($MILLION)
    FIGURE 58.BASF SE.: NET SALES ($MILLION)
    FIGURE 59.CARGILL INCORPORATED.: NET SALES ($MILLION)
    FIGURE 60.ARKEMA.: NET SALES ($MILLION)
    FIGURE 61.COVESTRO AG.: NET SALES ($MILLION)
    FIGURE 62.IQS GLOBAL.: NET SALES ($MILLION)
    FIGURE 63.BIOBASED TECHNOLOGIES.: NET SALES ($MILLION)
    FIGURE 64.EMERY OLEOCHEMICALS LLC.: NET SALES ($MILLION)
    FIGURE 65.ROQUETTE.: NET SALES ($MILLION)


According to the perspective of the CXOs of leading companies, the green market is anticipated to grow in near future due to its extensive use in applications such as polyurethane foam. adhesives & sealants, coatings, and others. Polyurethane foam is formed from polyether polyols, which are widely used in the construction industry. It is capable of controlling temperature effectively. As a result, it is employed in the insulating of walls, doors, panels, and roofs. Versatile polyurethane foam provides cushioning in beds, furniture, automobile interiors, carpet underlay, and packaging.

Moreover, rise in demand for bio-friendly organic compounds is anticipated to drive the market growth during the forecast period. However, the availability of alternatives is projected to hinder market growth. The North America region is projected to register robust growth during the forecast period.

PURCHASE OPTIONS

Call or Email us

U.S.-Canada Toll-free: +1-800-792-5285
Int'l : +1-503-894-6022
Europe : +44-845-528-1300
Email : help@alliedmarketresearch.com
 
FREQUENTLY ASKED QUESTIONS?

A. The global green polyols market was valued at $7.3 billion in 2021, and is projected to reach $17.2 bllion by 2031, registering a CAGR of 9.1% from 2022 to 2031.

A. Growth in demand from furniture & bedding, construction, packaging, automotive industries is predicted to propel the market growth during the forecast period.

A. Polyurethane foam is the leading application of Green Polyols Market.

A. North America is projected to register a robust growth during the forecast period.

A. Major players operating in the global green polyols market include Synthesia Technology Group, UniSol, BASF SE, Cargill Incorporated, Arkema, Covestro AG, IQS Global, BioBased Technologies, Emery Oleochemicals LLC, and Roquette.

Looking for Customization?

 Customization Request

Have a Question?

 Speak with Analyst

Any Confusion?

 Inquire Before Buying

Have a glance of the Report

  Request Sample
RELATED TAGS

Purchase Full Report of
Green Polyols Market

Start reading instantly.
This Report and over 66,905+ more Reports, Available with Avenue Library. T&C*.

  • Online Only
  • $3,570
  • Online cloud access only
  • Restricted print, copy, paste & download
  • Read only
  • Free industry update
    (Within 180 days)
  • Free report update in next update cycle
    (Nov 2023 - Nov 2024)
  • Data Pack
  • $3,840
  • Restricted to one authorized user
  • One print only
  • Available in
    Excel
  • Free industry update
    (Within 180 days)
  •   Free report update in next update cycle
    (Nov 2023 - Nov 2024)
  • Single User
  • $5,730
  • Restricted to one authorized user
  • One print only
  • Available in
    PDF
  • Free industry update
    (Within 180 days)
  •   Free report update in next update cycle
    (Nov 2023 - Nov 2024)
  • Five Users
  • $6,450
  • Limited to five authorized users
  • Print upto five copies
  • Available in
    PDF
  • Free industry update
    (Within 180 days)
  •   Free report update in next update cycle
    (Nov 2023 - Nov 2024)
  • Enterprise
    License/PDF

  • $9,600
  • Unlimited
    within
    company/enterprise
  • Available in Excel & PDF
  • Free industry update
    (Within 180 days)
  •   Free report update in next update cycle
    (Nov 2023 - Nov 2024)
  • Library
    Membership

  • $999 $ 1,175
    Per User/ Per month/ Billed annually
  • Published Content
    E-access
  • Company Profiles
    E-access
  • Newly Added Content Access
  • 10 PDF
    Downloads
  • 5 Excel Data
    Pack Downloads
  • 250 Company Profiles PDF Downloads
  • Buy Now

*Taxes/Fees, if applicable will be added during checkout. All prices in USD

RELATED REPORTS
 

Why Allied Market Research?


Infallible Methodology

To ensure high-level data integrity, accurate analysis, and impeccable forecasts

Analyst Support

For complete satisfaction

Customization

On-demand customization of scope of the report to exactly meet your needs

TARGETED MARKET VIEW

Targeted market view to provide pertinent information and save time of readers

Get fresh content delivered

Get insights on topics that are crucial for your business. Stay abreast of your interest areas.

Get Industry Data Alerts

Why Allied Market Research?

Infallible Methodology

To ensure high-level data integrity, accurate analysis, and impeccable forecasts

Analyst Support

For complete satisfaction

Customization

On-demand customization of scope of the report to exactly meet your needs

TARGETED MARKET VIEW

Targeted market view to provide pertinent information and save time of readers