
1, 4 Butanediol Market Research, 2033
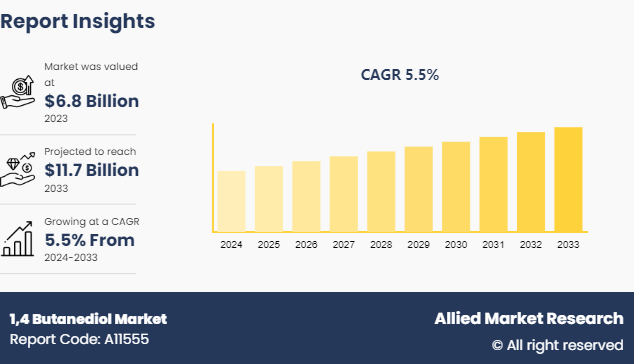
The global 1, 4 butanediol market was valued at $6.8 billion in 2023, and is projected to reach $11.7 billion by 2033, growing at a CAGR of 5.5% from 2024 to 2033.
Market Introduction and Definition
1, 4-Butanediol (BDO) is a colorless, viscous organic compound that is widely used in industrial applications as a solvent, plasticizer, and as an intermediate in the production of polyurethanes, polyesters, and spandex fibers. BDO is also utilized in the manufacture of tetrahydrofuran (THF) , a solvent for various polymers. It is produced through several methods, including the Reppe process, Davy process, and via biological fermentation. While BDO has legitimate industrial uses, it is also a precursor to gamma-hydroxybutyrate (GHB) , a substance with potential for abuse. Its handling requires careful regulation to prevent misuse, while ensuring its availability for essential industrial applications.
Key Takeaways
- The report provides competitive dynamics by evaluating business segments, product portfolios, target market revenue, geographical presence and key strategic developments by prominent manufacturers.
- The 1, 4 butanediol market is fragmented in nature among prominent companies such as DCC, BASF SE, Otto Chemie Pvt. Ltd., NOVEL CHEM, Suvchem, Henan GP Chemicals Co., Ltd, Tokyo Chemical Industry Co., Ltd. (TCI) , Univar Solutions LLC, Genomatica, Inc., and Shandong LanDian Biological Technology Co., LTD.
- The study contains qualitative information such as the market dynamics (drivers, restraints, challenges, and opportunities) , public policy analysis, pricing analysis, and Porter’s Five Force Analysis across North America, Europe, Asia-Pacific, LAMEA regions.
- Latest trends in global 1, 4 butanediol market such as undergoing R&D activities, regulatory guidelines, and government initiatives are analyzed across 16 countries in 4 different regions.
- More than 1, 600 1, 4 butanediol related product literatures, industry releases, annual reports, and other such documents of key industry participants along with authentic industry journals and government websites have been reviewed for generating high-value industry insights for global 1, 4 butanediol market.
Key Market Dynamics
Growing population base has led to rapid urbanization in both developed and developing economies such as the U.S., China, India, and others. This has increased government spending on architecture sector to develop various upcoming infrastructure projects. For instance, according to a report published by National Investment Promotion and Facilitation Agency, the infrastructure activities accounted for 13% share of the total foreign direct investment (FDI) inflows in 2021. Furthermore, rapid development of water supply, sanitation, urban transport, schools, and healthcare are aiding the growth of the building & architecture sector.
The construction industry extensively uses 1, 4 butanediol derived polyurethane-based products for insulation, sealants, adhesives, and coatings. These materials enhance energy efficiency in buildings, offer excellent thermal insulation, and provide durability and flexibility in construction applications. Thus, the global increase in construction activities may significantly boosts the demand for 1, 4 butanediol market.
Moreover, in the personal care and cosmetics industry, 1, 4 butanediol is valued for its versatile properties and potential anti-aging effects. It is incorporated into skincare formulations such as creams, serums, and lotions as humectant, solvent, texture enhancer, preservative booster, and emollient, thereby aiding in maintaining youthful skin. As consumers become more conscious of the ingredients in their personal care products and seek natural alternatives, the demand for 1, 4 butanediol as a key component in skincare formulations continues to rise. According to a an article published by East West Bank in January 2022, China will account for almost 70% of the beauty and personal care market within Asia-Pacific by 2025. Furthermore, the expanding beauty and cosmetics market, especially in emerging economies, presents lucrative opportunities for 1, 4 butanediol manufacturers and suppliers.
However, one of the primary restraints in the 1, 4 butanediol market is the production challenges particularly by using conventional processes such as Reppe and Davy methods that generates substantial greenhouse gas emissions and other pollutants. Furthermore, stringent environmental regulations related to greenhouse emissions laid by several national and international agencies such as the U.S. Environmental protection Agency (U.S. EPA) , Central Pollution Control Board (CPCB) , Clean Air Act, State Pollution Board (SPB) , and others pose another significant challenge for the 1, 4 butanediol manufacturers. This factor may restrain the growth of the 1, 4 butanediol market during the forecast period.
On the contrary, the increasing regulations and growing public awareness have made key manufacturers of various end-use sectors produce non-hazardous, green, and sustainable solutions. Also, to comply with the global trend of sustainability several sectors have increased their investments for developing sustainable materials for day-to-day use. For instance, according to a report published by Investopedia, the investments in green technology accounted for $755 billion in 2021. Furthermore, several environment regulatory bodies such as the United Nations Environment Programme (UNEP) and others have put more emphasis on investing in green technology for producing sustainable products. In addition, different R&D projects have been conducted with huge investments for producing bio-butanediol by lignocellulosic biomass. For instance, according to data revealed by Genomatica, Inc a leader in manufacturing bio butanediol, around $125 million has been raised and invested for innovation, development, and commercialization of bio butanediol for use in a wide variety of sectors including automotive, electrical & electronics, sports apparel, and others. This is anticipated to increase the sales and utilization of sustainable 1, 4 butanediol among different end-use sectors; thus, creating remunerative opportunities for the market.

The analysis encompasses patent trends, key patent holders, technological advancements, market segmentation, competitive landscape, and future outlook within the 1, 4 butanediol market. Patent filings related to adhesive film have shown a steady increase over the past decade, indicating growing interest and investment in 1, 4 butanediol R&D.
Market Segmentation
The 1, 4 butanediol market is segmented on the basis by product type, application, end-use industry, and region. By product type, the market is classified into synthetic and bio-based. Based on application, the market is segmented into gamma butyrolactone (GBL) , polyurethane (PU) , tetrahydrofuran (THF) , polybutylene terephthalate (PBT) , and others. By End-Use Industry, the market is classified into automotive, pharmaceutical, electrical & electronics, personal care & cosmetics, and others. Region-wise the market is studied across areas such as North America, Europe, Asia-Pacific, and LAMEA.
Regional/Country Market Outlook
North America represents a significant market for 1, 4 butanediol, driven by the utilization of 1, 4 butanediol in sectors such as electronics, automotive, and aviation in North America. Furthermore, rapid surge in the residential and commercial building & construction activities in the U.S. where 1, 4 butanediol-based polybutylene terephthalate is widely employed for manufacturing switches, electric boards, and other electronic housing materials installed in newly constructed buildings. This may fuel the growth of the 1, 4 butanediol market in the region. For instance, according to a report published by the U.S. General Administration in November 2023, the U.S. government has announced a $2 billion investment for more than 150 upcoming construction projects.
Moreover, the automotive industry in Canada is growing at a rapid pace where 1, 4 butanediol is used for manufacturing automotive instrument panels, connectors, and electronic chambers. This may act as one of the key drivers of the 1, 4 butanediol market. In addition, the region has a strong presence of key technology leaders such as Apple, HP, and Dell, which are consistently adding value by producing highly advanced smartphones and laptops, wherein 1, 4 butanediol-based polybutylene terephthalate is used in manufacturing phone connectors, keys, and other plastic parts of the gadgets.
Additionally, increase in awareness about sustainability and rise in penetration of fuel economy vehicles have increased the manufacturing and sales of electronic vehicles in Mexico, where bio-butanediol is widely used as a major precursor for manufacturing lightweight automobile parts. For instance, according to a report published by the International Trade Administration, Mexico reported a 26.3% growth in electric vehicles in 2022. Thus, increase in sale of electronic vehicles is anticipated to create remunerative opportunities for the 1, 4 butanediol market during the forecast period.
Competitive Landscape
The major players operating in the 1, 4 butanediol market include DCC, BASF SE, Otto Chemie Pvt. Ltd., NOVEL CHEM, Suvchem, Henan GP Chemicals Co., Ltd, Tokyo Chemical Industry Co., Ltd. (TCI) , Univar Solutions LLC, Genomatica, Inc., and Shandong LanDian Biological Technology Co., LTD. Other players in the 1, 4 butanediol market include Central Drug House, MERU CHEM PVT. LTD., Zhengzhou Meiya Chemical Products Co., Ltd, Parchem, and so on.
Industry Trends
- According to a report published by Journal of Pesticide Science in 2023, advancements in production technologies aimed to enhance the overall efficiency of 1, 4 butanediol may surge the potential application of 1, 4 butanediol across numerous end-use industries; thus, fueling the market growth.
- According to a report published by Springler in 2021, researchers from India have developed a novel bio-butanediol that can be used as a stabilizer in various cosmetic formulations such as sunscreens, hair care, and others.
Public Policy Analysis of Global 1, 4 Butanediol Market
Several acts and regulations have been imposed in order to avoid safeguard the manufacturing and utilization of 1, 4 butanediol for application in various end-use sectors. For instance:
- In U.S, Occupational Safety and Health Administration (OSHA) Hazard Communication Standard (HCS) (29 CFR 1910.1200) regulates the manufacturing and import of 1, 4 butanediol.
- Furthermore, the Environmental Protection Agency’s (EPA’s) Toxic Substances Control Act (TSCA) Inventory (40 CFR 710) regulates the manufacturing, processing, and distribution of 1, 4 butanediol within the U.S.
- In Europe, Registration, Evaluation, Authorization, and Restriction of Chemicals (REACH) Regulation (EC No 1907/2006) regulates the production, handling, and utilization of 1, 4 butanediol across various end-use sectors including plastic manufacturing, packaging, personal care, and others.
- Moreover, European Chemicals Agency (ECHA) regulates the trade-related activities of 1, 4 butanediol within or outside Europe.
- In Japan, Chemical Substances Control Law (CSCL) regulates the utilization of 1, 4 butanediol across various end-use sectors to ensure proper safety.
Key Sources Referred
- National Promotion and Facilitation Agency
- BioMed Central
- U.S. Development Authority
- East West Bank
- U.S. Food and Agriculture Organization (U.S. FAO)
- Invest India
Key Benefits For Stakeholders
- This report provides a quantitative analysis of the market segments, current trends, estimations, and dynamics of the 1, 4 butanediol market analysis from 2024 to 2033 to identify the prevailing 1, 4 butanediol market opportunities.
- The market research is offered along with information related to key drivers, restraints, and opportunities.
- Porter's five forces analysis highlights the potency of buyers and suppliers to enable stakeholders make profit-oriented business decisions and strengthen their supplier-buyer network.
- In-depth analysis of the 1, 4 butanediol market segmentation assists to determine the prevailing market opportunities.
- Major countries in each region are mapped according to their revenue contribution to the global market.
- Market player positioning facilitates benchmarking and provides a clear understanding of the present position of the market players.
- The report includes the analysis of the regional as well as global 1, 4 butanediol market trends, key players, market segments, application areas, and market growth strategies.
1, 4 Butanediol Market Report Highlights
| Aspects | Details |
| Market Size By 2033 | USD 11.7 Billion |
| Growth Rate | CAGR of 5.5% |
| Forecast period | 2024 - 2033 |
| Report Pages | 350 |
| By Product Type |
|
| By Application |
|
| By End-Use Industry |
|
| By Region |
|
| Key Market Players | Univar Solutions LLC, Tokyo Chemical Industry Co., Ltd. (TCI), Henan GP Chemicals Co.,Ltd, Suvchem, BASF SE, Otto Chemie Pvt. Ltd., NOVEL CHEM, DCC, Shandong LanDian Biological Technology Co., LTD., Genomatica, Inc. |
Loading Table Of Content...

