0
2022
3d Concrete Printing Market

3D Concrete Printing Market

by Printing Type (Gantry system, Robotic arm), by Technique (Extrusion-based, Powder-based), by End-use Sector (Residential, Commercial, Infrastructure): Global Opportunity Analysis and Industry Forecast, 2021-2031

Report Code: A01225
Oct 2022 | Pages: 210
Tables: 132
Charts: 54
  • Formats*:

  • pdf

    Single User License, Five User
    License & Enterprise User License

  • xls

    Data Pack Excel License

  • ppt

    It comes with the additional cost
    of $2500.00 contact sales.


3D Concrete Printing Market Research, 2031

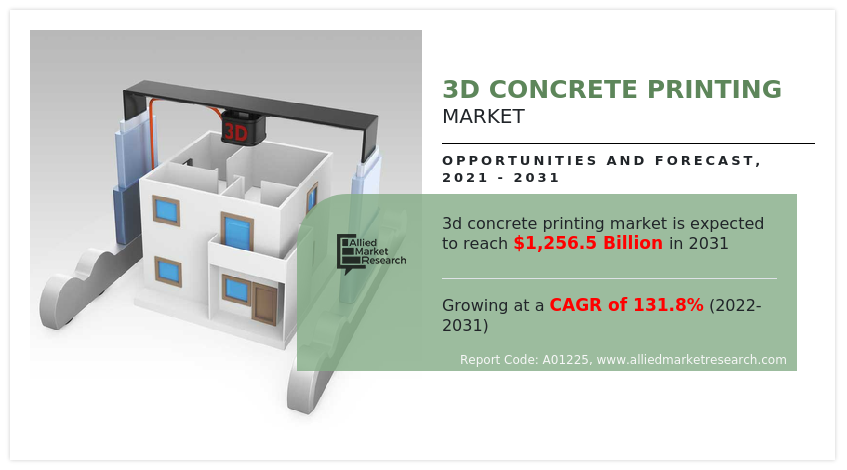
The global 3D concrete printing market size was valued at $371.7 million in 2021, and is projected to reach $1,256.5 billion by 2031, growing at a CAGR of 131.8% from 2022 to 2031. 3D concrete printing is a building technology that uses computer-operated robots, which can print 3D structures for buildings and other infrastructure. Software such as AutoCAD or SolidWorks are used to pre-program the path of the printer. The concrete that is fed to the printer is dispensed through the nozzle layer-by-layer in the pre-programmed desired path. Different types of concrete having various types of material compositions are used for 3D printing. Ready-mix and high-density concrete with minor changes in their composition are used for 3D printing.
The 3D concrete printing market was hampered during the outbreak of COVID-19 as there were restrictions on construction activities, in addition to the decline in R&D activities.

The growth of the global 3D concrete printing market is driven by the high cost of skilled labor in developed countries. In addition, manual construction process generates construction waste, which subsequently needs to be collected and demolished. The wastage of concrete increases the project cost for the contractor and the collection & demolition cost for the government. On the contrary, 3D printing generates little waste as compared to the manual process. Moreover, the mass production of irregular shapes of objects is easier and more economical with the use of this technology.

3D Concrete Printing Market

However, high capital cost of 3D printer, its maintenance, and its operating software, as well as hardware acts as a major restraint to the market growth. The limitation on printing sizes and heights is another drawback, which hampers the growth of the market and technology globally. 3D concrete printing of huge objects needs a larger setup for the printer to travel the distance. Similarly, 3D printing needs cranes or other provisions to carry the printer to the desired height. This increases the capital and operation cost of the project, owing to the larger setup of frames, thereby restraining the 3D concrete printing market growth.
3D Concrete Printing Market

During the outbreak of the COVID-19 pandemic, the construction, manufacturing, hotel, and tourism industries were majorly affected. Manufacturing activities were halted or restricted. Construction and transportation activities, along with their supply chains, were hampered on a global level. This led to a decline in the demand for construction and 3D concrete printing, thereby restraining the growth of the 3D concrete printing market. Now, industries are gradually resuming their regular manufacturing and services. This is expected to lead to the re-initiation of 3D concrete printing companies at their full-scale capacities, which helped the 3D concrete printing industry to recover by the end of 2021.
3D Concrete Printing Market

Rapid urbanization demands fast and accurate, yet cheaper and waste-free construction. These demands are met by 3D concrete printing technology. Thus, enovation and upgrade of walls, roofs, and separating panels in buildings and infrastructure are anticipated to offer remunerative opportunities for the expansion of the 3D concrete printing market during the forecast period.
3D Concrete Printing Market

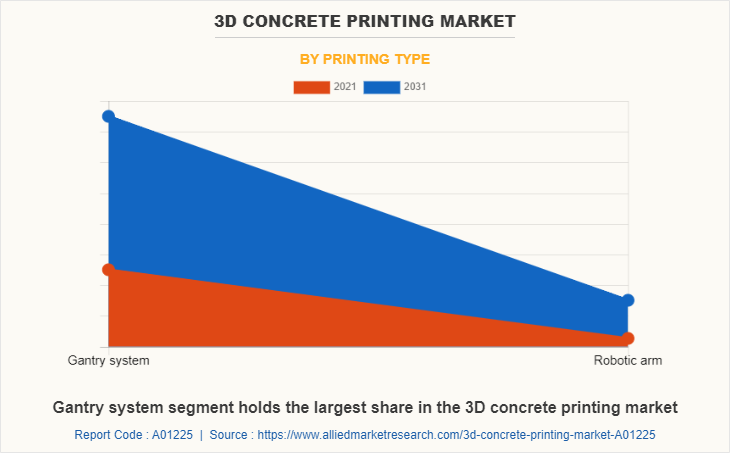
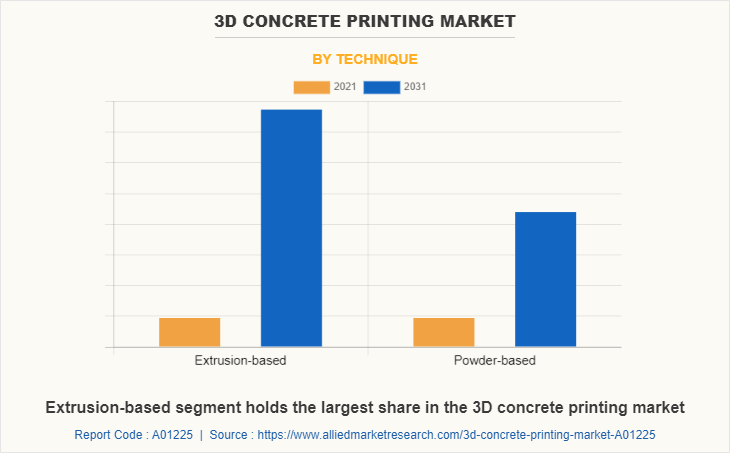
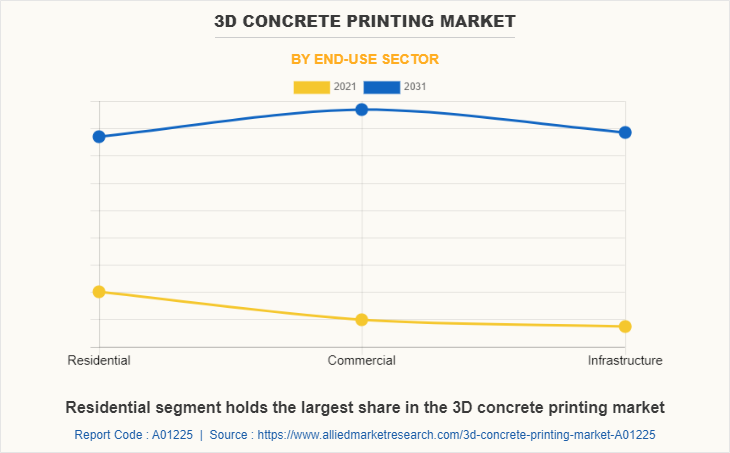
The 3D concrete printing market analysis is segmented into Printing Type, Technique and End-use Sector. On the basis of printing type, the market is divided into gantry system and robotic arm. On the basis of technique, it is classified into extrusion-based and powder-based. On the basis of  end-use sector, it is segregated into residential, commercial, and infrastructure. Region-wise, the market is analyzed across North America, Europe, Asia-Pacific, and LAMEA.

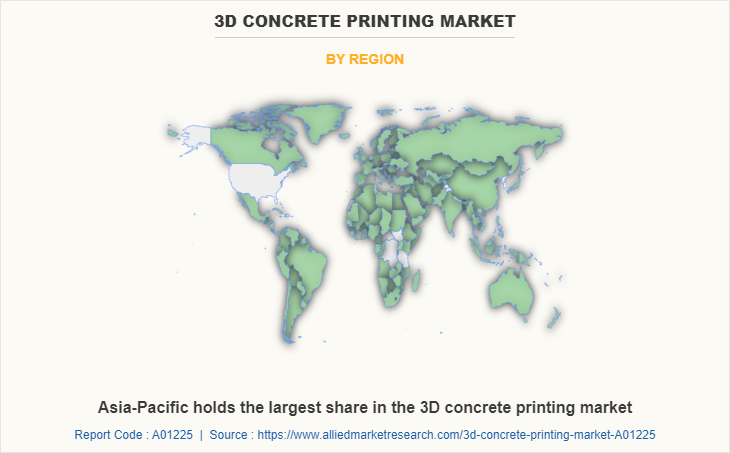
By printing type, in 2021, the gantry system segment dominated the market in terms of revenue, and the robotic arm segment is expected to witness growth at the highest CAGR during the forecast period. On the basis of technique, the extrusion-based segment led the market in 2021 in terms of revenue, and the powder-based segment is anticipated to register the highest CAGR during the forecast period. On the basis of end-use sector, the residential segment led the 3D concrete printing market share in 2021 in terms of revenue, and the infrastructure segment is anticipated to register the highest CAGR during the forecast period. Region-wise, the Asia-Pacific region accounted for the highest market share in 2021, and LAMEA is anticipated to register the highest CAGR during the forecast period.
3D Concrete Printing Market

COMPETITION ANALYSIS

The major players profiled in the 3D concrete printing market include Apis Cor, Cobod International A/S, CyBe Construction, D-shape, Heidelbergcement AG (ItalcementiSpA), LafargeHolcim, Sika AG, Skanska, Yingchuang Building Technique (Shanghai) Co., Ltd. (Winsun), and XtreeE. Major companies in the market have adopted acquisition, partnership, and business expansionas their key developmental strategies to offer better products and services to customers in the market.

Key Benefits For Stakeholders

  • This report provides a quantitative analysis of the market segments, current trends, estimations, and dynamics of the 3D concrete printing market forecast from 2022 to 2031.
  • The market research is offered along with information related to key drivers, restraints, and opportunities.
  • Porter's five forces analysis highlights the potency of buyers and suppliers to enable stakeholders make profit-oriented business decisions and strengthen their supplier-buyer network.
  • In-depth analysis of the 3D concrete printing market opportunities.
  • Major countries in each region are mapped according to their revenue contribution to the global market.
  • Market player positioning facilitates benchmarking and provides a clear understanding of the present position of the market players.
  • The report includes the analysis of the regional as well as global 3D concrete printing market trends, key players, market segments, application areas, and market growth strategies.

3D Concrete Printing Market Report Highlights

Aspects Details
Market Size By 2031 USD 1256.5 billion
Growth Rate CAGR of 131.8%
Forecast period 2021 - 2031
Report Pages 210
By Printing Type
  • Gantry system
  • Robotic arm
By Technique
  • Powder-based
  • Extrusion-based
By End-use Sector
  • Residential
  • Commercial
  • Infrastructure
By Region
  • North America  (U.S., Canada, Mexico)
  • Europe  (Germany, France, UK, Denmark, Rest of Europe)
  • Asia-Pacific  (China, Japan, India, South Korea, Rest of Asia-Pacific)
  • LAMEA  (Latin America, Middle East, Africa)
Key Market Players Cobod International A/S, HeidelbergCement AG, cybe construction, D-shape, Apis Cor, Yingchuang Building Technique (Shanghai) Co., Ltd. (Winsun), XtreeE, Skanska AB, Holcim, Sika AG
 
  • CHAPTER 1:INTRODUCTION

    • 1.1.Report description

    • 1.2.Key market segments

    • 1.3.Key benefits to the stakeholders

    • 1.4.Research Methodology

      • 1.4.1.Secondary research

      • 1.4.2.Primary research

      • 1.4.3.Analyst tools and models

  • CHAPTER 2:EXECUTIVE SUMMARY

    • 2.1.Key findings of the study

    • 2.2.CXO Perspective

  • CHAPTER 3:MARKET OVERVIEW

    • 3.1.Market definition and scope

    • 3.2.Key findings

      • 3.2.1.Top investment pockets

    • 3.3.Porter’s five forces analysis

    • 3.4.Top player positioning

    • 3.5.Market dynamics

      • 3.5.1.Drivers

      • 3.5.2.Restraints

      • 3.5.3.Opportunities

    • 3.6.COVID-19 Impact Analysis on the market

  • CHAPTER 4: 3D CONCRETE PRINTING MARKET, BY PRINTING TYPE

    • 4.1 Overview

      • 4.1.1 Market size and forecast

    • 4.2 Gantry system

      • 4.2.1 Key market trends, growth factors and opportunities

      • 4.2.2 Market size and forecast, by region

      • 4.2.3 Market share analysis by country

    • 4.3 Robotic arm

      • 4.3.1 Key market trends, growth factors and opportunities

      • 4.3.2 Market size and forecast, by region

      • 4.3.3 Market share analysis by country

  • CHAPTER 5: 3D CONCRETE PRINTING MARKET, BY TECHNIQUE

    • 5.1 Overview

      • 5.1.1 Market size and forecast

    • 5.2 Extrusion-based

      • 5.2.1 Key market trends, growth factors and opportunities

      • 5.2.2 Market size and forecast, by region

      • 5.2.3 Market share analysis by country

    • 5.3 Powder-based

      • 5.3.1 Key market trends, growth factors and opportunities

      • 5.3.2 Market size and forecast, by region

      • 5.3.3 Market share analysis by country

  • CHAPTER 6: 3D CONCRETE PRINTING MARKET, BY END-USE SECTOR

    • 6.1 Overview

      • 6.1.1 Market size and forecast

    • 6.2 Residential

      • 6.2.1 Key market trends, growth factors and opportunities

      • 6.2.2 Market size and forecast, by region

      • 6.2.3 Market share analysis by country

    • 6.3 Commercial

      • 6.3.1 Key market trends, growth factors and opportunities

      • 6.3.2 Market size and forecast, by region

      • 6.3.3 Market share analysis by country

    • 6.4 Infrastructure

      • 6.4.1 Key market trends, growth factors and opportunities

      • 6.4.2 Market size and forecast, by region

      • 6.4.3 Market share analysis by country

  • CHAPTER 7: 3D CONCRETE PRINTING MARKET, BY REGION

    • 7.1 Overview

      • 7.1.1 Market size and forecast

    • 7.2 North America

      • 7.2.1 Key trends and opportunities

      • 7.2.2 North America Market size and forecast, by Printing Type

      • 7.2.3 North America Market size and forecast, by Technique

      • 7.2.4 North America Market size and forecast, by End-use Sector

      • 7.2.5 North America Market size and forecast, by country

        • 7.2.5.1 U.S.
          • 7.2.5.1.1 Key market trends, growth factors and opportunities
          • 7.2.5.1.2 Market size and forecast, by Printing Type
          • 7.2.5.1.3 Market size and forecast, by Technique
          • 7.2.5.1.4 Market size and forecast, by End-use Sector
        • 7.2.5.2 Canada
          • 7.2.5.2.1 Key market trends, growth factors and opportunities
          • 7.2.5.2.2 Market size and forecast, by Printing Type
          • 7.2.5.2.3 Market size and forecast, by Technique
          • 7.2.5.2.4 Market size and forecast, by End-use Sector
        • 7.2.5.3 Mexico
          • 7.2.5.3.1 Key market trends, growth factors and opportunities
          • 7.2.5.3.2 Market size and forecast, by Printing Type
          • 7.2.5.3.3 Market size and forecast, by Technique
          • 7.2.5.3.4 Market size and forecast, by End-use Sector
    • 7.3 Europe

      • 7.3.1 Key trends and opportunities

      • 7.3.2 Europe Market size and forecast, by Printing Type

      • 7.3.3 Europe Market size and forecast, by Technique

      • 7.3.4 Europe Market size and forecast, by End-use Sector

      • 7.3.5 Europe Market size and forecast, by country

        • 7.3.5.1 Germany
          • 7.3.5.1.1 Key market trends, growth factors and opportunities
          • 7.3.5.1.2 Market size and forecast, by Printing Type
          • 7.3.5.1.3 Market size and forecast, by Technique
          • 7.3.5.1.4 Market size and forecast, by End-use Sector
        • 7.3.5.2 France
          • 7.3.5.2.1 Key market trends, growth factors and opportunities
          • 7.3.5.2.2 Market size and forecast, by Printing Type
          • 7.3.5.2.3 Market size and forecast, by Technique
          • 7.3.5.2.4 Market size and forecast, by End-use Sector
        • 7.3.5.3 UK
          • 7.3.5.3.1 Key market trends, growth factors and opportunities
          • 7.3.5.3.2 Market size and forecast, by Printing Type
          • 7.3.5.3.3 Market size and forecast, by Technique
          • 7.3.5.3.4 Market size and forecast, by End-use Sector
        • 7.3.5.4 Denmark
          • 7.3.5.4.1 Key market trends, growth factors and opportunities
          • 7.3.5.4.2 Market size and forecast, by Printing Type
          • 7.3.5.4.3 Market size and forecast, by Technique
          • 7.3.5.4.4 Market size and forecast, by End-use Sector
        • 7.3.5.5 Rest of Europe
          • 7.3.5.5.1 Key market trends, growth factors and opportunities
          • 7.3.5.5.2 Market size and forecast, by Printing Type
          • 7.3.5.5.3 Market size and forecast, by Technique
          • 7.3.5.5.4 Market size and forecast, by End-use Sector
    • 7.4 Asia-Pacific

      • 7.4.1 Key trends and opportunities

      • 7.4.2 Asia-Pacific Market size and forecast, by Printing Type

      • 7.4.3 Asia-Pacific Market size and forecast, by Technique

      • 7.4.4 Asia-Pacific Market size and forecast, by End-use Sector

      • 7.4.5 Asia-Pacific Market size and forecast, by country

        • 7.4.5.1 China
          • 7.4.5.1.1 Key market trends, growth factors and opportunities
          • 7.4.5.1.2 Market size and forecast, by Printing Type
          • 7.4.5.1.3 Market size and forecast, by Technique
          • 7.4.5.1.4 Market size and forecast, by End-use Sector
        • 7.4.5.2 Japan
          • 7.4.5.2.1 Key market trends, growth factors and opportunities
          • 7.4.5.2.2 Market size and forecast, by Printing Type
          • 7.4.5.2.3 Market size and forecast, by Technique
          • 7.4.5.2.4 Market size and forecast, by End-use Sector
        • 7.4.5.3 India
          • 7.4.5.3.1 Key market trends, growth factors and opportunities
          • 7.4.5.3.2 Market size and forecast, by Printing Type
          • 7.4.5.3.3 Market size and forecast, by Technique
          • 7.4.5.3.4 Market size and forecast, by End-use Sector
        • 7.4.5.4 South Korea
          • 7.4.5.4.1 Key market trends, growth factors and opportunities
          • 7.4.5.4.2 Market size and forecast, by Printing Type
          • 7.4.5.4.3 Market size and forecast, by Technique
          • 7.4.5.4.4 Market size and forecast, by End-use Sector
        • 7.4.5.5 Rest of Asia-Pacific
          • 7.4.5.5.1 Key market trends, growth factors and opportunities
          • 7.4.5.5.2 Market size and forecast, by Printing Type
          • 7.4.5.5.3 Market size and forecast, by Technique
          • 7.4.5.5.4 Market size and forecast, by End-use Sector
    • 7.5 LAMEA

      • 7.5.1 Key trends and opportunities

      • 7.5.2 LAMEA Market size and forecast, by Printing Type

      • 7.5.3 LAMEA Market size and forecast, by Technique

      • 7.5.4 LAMEA Market size and forecast, by End-use Sector

      • 7.5.5 LAMEA Market size and forecast, by country

        • 7.5.5.1 Latin America
          • 7.5.5.1.1 Key market trends, growth factors and opportunities
          • 7.5.5.1.2 Market size and forecast, by Printing Type
          • 7.5.5.1.3 Market size and forecast, by Technique
          • 7.5.5.1.4 Market size and forecast, by End-use Sector
        • 7.5.5.2 Middle East
          • 7.5.5.2.1 Key market trends, growth factors and opportunities
          • 7.5.5.2.2 Market size and forecast, by Printing Type
          • 7.5.5.2.3 Market size and forecast, by Technique
          • 7.5.5.2.4 Market size and forecast, by End-use Sector
        • 7.5.5.3 Africa
          • 7.5.5.3.1 Key market trends, growth factors and opportunities
          • 7.5.5.3.2 Market size and forecast, by Printing Type
          • 7.5.5.3.3 Market size and forecast, by Technique
          • 7.5.5.3.4 Market size and forecast, by End-use Sector
  • CHAPTER 8: COMPANY LANDSCAPE

    • 8.1. Introduction

    • 8.2. Top winning strategies

    • 8.3. Product Mapping of Top 10 Player

    • 8.4. Competitive Dashboard

    • 8.5. Competitive Heatmap

    • 8.6. Key developments

  • CHAPTER 9: COMPANY PROFILES

    • 9.1 HeidelbergCement AG

      • 9.1.1 Company overview

      • 9.1.2 Company snapshot

      • 9.1.3 Operating business segments

      • 9.1.4 Product portfolio

      • 9.1.5 Business performance

      • 9.1.6 Key strategic moves and developments

    • 9.2 Skanska AB

      • 9.2.1 Company overview

      • 9.2.2 Company snapshot

      • 9.2.3 Operating business segments

      • 9.2.4 Product portfolio

      • 9.2.5 Business performance

      • 9.2.6 Key strategic moves and developments

    • 9.3 Yingchuang Building Technique (Shanghai) Co., Ltd. (Winsun)

      • 9.3.1 Company overview

      • 9.3.2 Company snapshot

      • 9.3.3 Operating business segments

      • 9.3.4 Product portfolio

      • 9.3.5 Business performance

      • 9.3.6 Key strategic moves and developments

    • 9.4 XtreeE

      • 9.4.1 Company overview

      • 9.4.2 Company snapshot

      • 9.4.3 Operating business segments

      • 9.4.4 Product portfolio

      • 9.4.5 Business performance

      • 9.4.6 Key strategic moves and developments

    • 9.5 Sika AG

      • 9.5.1 Company overview

      • 9.5.2 Company snapshot

      • 9.5.3 Operating business segments

      • 9.5.4 Product portfolio

      • 9.5.5 Business performance

      • 9.5.6 Key strategic moves and developments

    • 9.6 Apis Cor

      • 9.6.1 Company overview

      • 9.6.2 Company snapshot

      • 9.6.3 Operating business segments

      • 9.6.4 Product portfolio

      • 9.6.5 Business performance

      • 9.6.6 Key strategic moves and developments

    • 9.7 Cobod International A/S

      • 9.7.1 Company overview

      • 9.7.2 Company snapshot

      • 9.7.3 Operating business segments

      • 9.7.4 Product portfolio

      • 9.7.5 Business performance

      • 9.7.6 Key strategic moves and developments

    • 9.8 D-shape

      • 9.8.1 Company overview

      • 9.8.2 Company snapshot

      • 9.8.3 Operating business segments

      • 9.8.4 Product portfolio

      • 9.8.5 Business performance

      • 9.8.6 Key strategic moves and developments

    • 9.9 cybe construction

      • 9.9.1 Company overview

      • 9.9.2 Company snapshot

      • 9.9.3 Operating business segments

      • 9.9.4 Product portfolio

      • 9.9.5 Business performance

      • 9.9.6 Key strategic moves and developments

    • 9.10 Holcim

      • 9.10.1 Company overview

      • 9.10.2 Company snapshot

      • 9.10.3 Operating business segments

      • 9.10.4 Product portfolio

      • 9.10.5 Business performance

      • 9.10.6 Key strategic moves and developments

  • LIST OF TABLES

  • TABLE 1. GLOBAL 3D CONCRETE PRINTING MARKET, BY PRINTING TYPE, 2021-2031 (REVENUE, $MILLION)
    TABLE 2. 3D CONCRETE PRINTING MARKET FOR GANTRY SYSTEM, BY REGION, 2021-2031 (REVENUE, $MILLION)
    TABLE 3. 3D CONCRETE PRINTING MARKET FOR GANTRY SYSTEM, BY COUNTRY, 2021-2031 (REVENUE, $MILLION)
    TABLE 4. 3D CONCRETE PRINTING MARKET FOR ROBOTIC ARM, BY REGION, 2021-2031 (REVENUE, $MILLION)
    TABLE 5. 3D CONCRETE PRINTING MARKET FOR ROBOTIC ARM, BY COUNTRY, 2021-2031 (REVENUE, $MILLION)
    TABLE 6. GLOBAL 3D CONCRETE PRINTING MARKET, BY TECHNIQUE, 2021-2031 (REVENUE, $MILLION)
    TABLE 7. 3D CONCRETE PRINTING MARKET FOR EXTRUSION-BASED, BY REGION, 2021-2031 (REVENUE, $MILLION)
    TABLE 8. 3D CONCRETE PRINTING MARKET FOR EXTRUSION-BASED, BY COUNTRY, 2021-2031 (REVENUE, $MILLION)
    TABLE 9. 3D CONCRETE PRINTING MARKET FOR POWDER-BASED, BY REGION, 2021-2031 (REVENUE, $MILLION)
    TABLE 10. 3D CONCRETE PRINTING MARKET FOR POWDER-BASED, BY COUNTRY, 2021-2031 (REVENUE, $MILLION)
    TABLE 11. GLOBAL 3D CONCRETE PRINTING MARKET, BY END-USE SECTOR, 2021-2031 (REVENUE, $MILLION)
    TABLE 12. 3D CONCRETE PRINTING MARKET FOR RESIDENTIAL, BY REGION, 2021-2031 (REVENUE, $MILLION)
    TABLE 13. 3D CONCRETE PRINTING MARKET FOR RESIDENTIAL, BY COUNTRY, 2021-2031 (REVENUE, $MILLION)
    TABLE 14. 3D CONCRETE PRINTING MARKET FOR COMMERCIAL, BY REGION, 2021-2031 (REVENUE, $MILLION)
    TABLE 15. 3D CONCRETE PRINTING MARKET FOR COMMERCIAL, BY COUNTRY, 2021-2031 (REVENUE, $MILLION)
    TABLE 16. 3D CONCRETE PRINTING MARKET FOR INFRASTRUCTURE, BY REGION, 2021-2031 (REVENUE, $MILLION)
    TABLE 17. 3D CONCRETE PRINTING MARKET FOR INFRASTRUCTURE, BY COUNTRY, 2021-2031 (REVENUE, $MILLION)
    TABLE 18. 3D CONCRETE PRINTING MARKET, BY REGION, 2021-2031 (REVENUE, $MILLION)
    TABLE 19. NORTH AMERICA 3D CONCRETE PRINTING MARKET, BY PRINTING TYPE, 2021-2031 (REVENUE, $MILLION)
    TABLE 20. NORTH AMERICA 3D CONCRETE PRINTING MARKET, BY TECHNIQUE, 2021-2031 (REVENUE, $MILLION)
    TABLE 21. NORTH AMERICA 3D CONCRETE PRINTING MARKET, BY END-USE SECTOR, 2021-2031 (REVENUE, $MILLION)
    TABLE 22. NORTH AMERICA 3D CONCRETE PRINTING MARKET, BY COUNTRY, 2021-2031 (REVENUE, $MILLION)
    TABLE 23. U.S. 3D CONCRETE PRINTING MARKET, BY PRINTING TYPE, 2021-2031 (REVENUE, $MILLION)
    TABLE 24. U.S. 3D CONCRETE PRINTING MARKET, BY TECHNIQUE, 2021-2031 (REVENUE, $MILLION)
    TABLE 25. U.S. 3D CONCRETE PRINTING MARKET, BY END-USE SECTOR, 2021-2031 (REVENUE, $MILLION)
    TABLE 26. CANADA 3D CONCRETE PRINTING MARKET, BY PRINTING TYPE, 2021-2031 (REVENUE, $MILLION)
    TABLE 27. CANADA 3D CONCRETE PRINTING MARKET, BY TECHNIQUE, 2021-2031 (REVENUE, $MILLION)
    TABLE 28. CANADA 3D CONCRETE PRINTING MARKET, BY END-USE SECTOR, 2021-2031 (REVENUE, $MILLION)
    TABLE 29. MEXICO 3D CONCRETE PRINTING MARKET, BY PRINTING TYPE, 2021-2031 (REVENUE, $MILLION)
    TABLE 30. MEXICO 3D CONCRETE PRINTING MARKET, BY TECHNIQUE, 2021-2031 (REVENUE, $MILLION)
    TABLE 31. MEXICO 3D CONCRETE PRINTING MARKET, BY END-USE SECTOR, 2021-2031 (REVENUE, $MILLION)
    TABLE 32. EUROPE 3D CONCRETE PRINTING MARKET, BY PRINTING TYPE, 2021-2031 (REVENUE, $MILLION)
    TABLE 33. EUROPE 3D CONCRETE PRINTING MARKET, BY TECHNIQUE, 2021-2031 (REVENUE, $MILLION)
    TABLE 34. EUROPE 3D CONCRETE PRINTING MARKET, BY END-USE SECTOR, 2021-2031 (REVENUE, $MILLION)
    TABLE 35. EUROPE 3D CONCRETE PRINTING MARKET, BY COUNTRY, 2021-2031 (REVENUE, $MILLION)
    TABLE 36. GERMANY 3D CONCRETE PRINTING MARKET, BY PRINTING TYPE, 2021-2031 (REVENUE, $MILLION)
    TABLE 37. GERMANY 3D CONCRETE PRINTING MARKET, BY TECHNIQUE, 2021-2031 (REVENUE, $MILLION)
    TABLE 38. GERMANY 3D CONCRETE PRINTING MARKET, BY END-USE SECTOR, 2021-2031 (REVENUE, $MILLION)
    TABLE 39. FRANCE 3D CONCRETE PRINTING MARKET, BY PRINTING TYPE, 2021-2031 (REVENUE, $MILLION)
    TABLE 40. FRANCE 3D CONCRETE PRINTING MARKET, BY TECHNIQUE, 2021-2031 (REVENUE, $MILLION)
    TABLE 41. FRANCE 3D CONCRETE PRINTING MARKET, BY END-USE SECTOR, 2021-2031 (REVENUE, $MILLION)
    TABLE 42. UK 3D CONCRETE PRINTING MARKET, BY PRINTING TYPE, 2021-2031 (REVENUE, $MILLION)
    TABLE 43. UK 3D CONCRETE PRINTING MARKET, BY TECHNIQUE, 2021-2031 (REVENUE, $MILLION)
    TABLE 44. UK 3D CONCRETE PRINTING MARKET, BY END-USE SECTOR, 2021-2031 (REVENUE, $MILLION)
    TABLE 45. DENMARK 3D CONCRETE PRINTING MARKET, BY PRINTING TYPE, 2021-2031 (REVENUE, $MILLION)
    TABLE 46. DENMARK 3D CONCRETE PRINTING MARKET, BY TECHNIQUE, 2021-2031 (REVENUE, $MILLION)
    TABLE 47. DENMARK 3D CONCRETE PRINTING MARKET, BY END-USE SECTOR, 2021-2031 (REVENUE, $MILLION)
    TABLE 48. REST OF EUROPE 3D CONCRETE PRINTING MARKET, BY PRINTING TYPE, 2021-2031 (REVENUE, $MILLION)
    TABLE 49. REST OF EUROPE 3D CONCRETE PRINTING MARKET, BY TECHNIQUE, 2021-2031 (REVENUE, $MILLION)
    TABLE 50. REST OF EUROPE 3D CONCRETE PRINTING MARKET, BY END-USE SECTOR, 2021-2031 (REVENUE, $MILLION)
    TABLE 51. ASIA-PACIFIC 3D CONCRETE PRINTING MARKET, BY PRINTING TYPE, 2021-2031 (REVENUE, $MILLION)
    TABLE 52. ASIA-PACIFIC 3D CONCRETE PRINTING MARKET, BY TECHNIQUE, 2021-2031 (REVENUE, $MILLION)
    TABLE 53. ASIA-PACIFIC 3D CONCRETE PRINTING MARKET, BY END-USE SECTOR, 2021-2031 (REVENUE, $MILLION)
    TABLE 54. ASIA-PACIFIC 3D CONCRETE PRINTING MARKET, BY COUNTRY, 2021-2031 (REVENUE, $MILLION)
    TABLE 55. CHINA 3D CONCRETE PRINTING MARKET, BY PRINTING TYPE, 2021-2031 (REVENUE, $MILLION)
    TABLE 56. CHINA 3D CONCRETE PRINTING MARKET, BY TECHNIQUE, 2021-2031 (REVENUE, $MILLION)
    TABLE 57. CHINA 3D CONCRETE PRINTING MARKET, BY END-USE SECTOR, 2021-2031 (REVENUE, $MILLION)
    TABLE 58. JAPAN 3D CONCRETE PRINTING MARKET, BY PRINTING TYPE, 2021-2031 (REVENUE, $MILLION)
    TABLE 59. JAPAN 3D CONCRETE PRINTING MARKET, BY TECHNIQUE, 2021-2031 (REVENUE, $MILLION)
    TABLE 60. JAPAN 3D CONCRETE PRINTING MARKET, BY END-USE SECTOR, 2021-2031 (REVENUE, $MILLION)
    TABLE 61. INDIA 3D CONCRETE PRINTING MARKET, BY PRINTING TYPE, 2021-2031 (REVENUE, $MILLION)
    TABLE 62. INDIA 3D CONCRETE PRINTING MARKET, BY TECHNIQUE, 2021-2031 (REVENUE, $MILLION)
    TABLE 63. INDIA 3D CONCRETE PRINTING MARKET, BY END-USE SECTOR, 2021-2031 (REVENUE, $MILLION)
    TABLE 64. SOUTH KOREA 3D CONCRETE PRINTING MARKET, BY PRINTING TYPE, 2021-2031 (REVENUE, $MILLION)
    TABLE 65. SOUTH KOREA 3D CONCRETE PRINTING MARKET, BY TECHNIQUE, 2021-2031 (REVENUE, $MILLION)
    TABLE 66. SOUTH KOREA 3D CONCRETE PRINTING MARKET, BY END-USE SECTOR, 2021-2031 (REVENUE, $MILLION)
    TABLE 67. REST OF ASIA-PACIFIC 3D CONCRETE PRINTING MARKET, BY PRINTING TYPE, 2021-2031 (REVENUE, $MILLION)
    TABLE 68. REST OF ASIA-PACIFIC 3D CONCRETE PRINTING MARKET, BY TECHNIQUE, 2021-2031 (REVENUE, $MILLION)
    TABLE 69. REST OF ASIA-PACIFIC 3D CONCRETE PRINTING MARKET, BY END-USE SECTOR, 2021-2031 (REVENUE, $MILLION)
    TABLE 70. LAMEA 3D CONCRETE PRINTING MARKET, BY PRINTING TYPE, 2021-2031 (REVENUE, $MILLION)
    TABLE 71. LAMEA 3D CONCRETE PRINTING MARKET, BY TECHNIQUE, 2021-2031 (REVENUE, $MILLION)
    TABLE 72. LAMEA 3D CONCRETE PRINTING MARKET, BY END-USE SECTOR, 2021-2031 (REVENUE, $MILLION)
    TABLE 73. LAMEA 3D CONCRETE PRINTING MARKET, BY COUNTRY, 2021-2031 (REVENUE, $MILLION)
    TABLE 74. LATIN AMERICA 3D CONCRETE PRINTING MARKET, BY PRINTING TYPE, 2021-2031 (REVENUE, $MILLION)
    TABLE 75. LATIN AMERICA 3D CONCRETE PRINTING MARKET, BY TECHNIQUE, 2021-2031 (REVENUE, $MILLION)
    TABLE 76. LATIN AMERICA 3D CONCRETE PRINTING MARKET, BY END-USE SECTOR, 2021-2031 (REVENUE, $MILLION)
    TABLE 77. MIDDLE EAST 3D CONCRETE PRINTING MARKET, BY PRINTING TYPE, 2021-2031 (REVENUE, $MILLION)
    TABLE 78. MIDDLE EAST 3D CONCRETE PRINTING MARKET, BY TECHNIQUE, 2021-2031 (REVENUE, $MILLION)
    TABLE 79. MIDDLE EAST 3D CONCRETE PRINTING MARKET, BY END-USE SECTOR, 2021-2031 (REVENUE, $MILLION)
    TABLE 80. AFRICA 3D CONCRETE PRINTING MARKET, BY PRINTING TYPE, 2021-2031 (REVENUE, $MILLION)
    TABLE 81. AFRICA 3D CONCRETE PRINTING MARKET, BY TECHNIQUE, 2021-2031 (REVENUE, $MILLION)
    TABLE 82. AFRICA 3D CONCRETE PRINTING MARKET, BY END-USE SECTOR, 2021-2031 (REVENUE, $MILLION)
    TABLE 83.HEIDELBERGCEMENT AG: COMPANY SNAPSHOT
    TABLE 84.HEIDELBERGCEMENT AG: OPERATING SEGMENTS
    TABLE 85.HEIDELBERGCEMENT AG: PRODUCT PORTFOLIO
    TABLE 86.HEIDELBERGCEMENT AG: NET SALES
    TABLE 87.HEIDELBERGCEMENT AG: KEY STRATERGIES
    TABLE 88.SKANSKA AB: COMPANY SNAPSHOT
    TABLE 89.SKANSKA AB: OPERATING SEGMENTS
    TABLE 90.SKANSKA AB: PRODUCT PORTFOLIO
    TABLE 91.SKANSKA AB: NET SALES
    TABLE 92.SKANSKA AB: KEY STRATERGIES
    TABLE 93.YINGCHUANG BUILDING TECHNIQUE (SHANGHAI) CO., LTD. (WINSUN): COMPANY SNAPSHOT
    TABLE 94.YINGCHUANG BUILDING TECHNIQUE (SHANGHAI) CO., LTD. (WINSUN): OPERATING SEGMENTS
    TABLE 95.YINGCHUANG BUILDING TECHNIQUE (SHANGHAI) CO., LTD. (WINSUN): PRODUCT PORTFOLIO
    TABLE 96.YINGCHUANG BUILDING TECHNIQUE (SHANGHAI) CO., LTD. (WINSUN): NET SALES
    TABLE 97.YINGCHUANG BUILDING TECHNIQUE (SHANGHAI) CO., LTD. (WINSUN): KEY STRATERGIES
    TABLE 98.XTREEE: COMPANY SNAPSHOT
    TABLE 99.XTREEE: OPERATING SEGMENTS
    TABLE 100.XTREEE: PRODUCT PORTFOLIO
    TABLE 101.XTREEE: NET SALES
    TABLE 102.XTREEE: KEY STRATERGIES
    TABLE 103.SIKA AG: COMPANY SNAPSHOT
    TABLE 104.SIKA AG: OPERATING SEGMENTS
    TABLE 105.SIKA AG: PRODUCT PORTFOLIO
    TABLE 106.SIKA AG: NET SALES
    TABLE 107.SIKA AG: KEY STRATERGIES
    TABLE 108.APIS COR: COMPANY SNAPSHOT
    TABLE 109.APIS COR: OPERATING SEGMENTS
    TABLE 110.APIS COR: PRODUCT PORTFOLIO
    TABLE 111.APIS COR: NET SALES
    TABLE 112.APIS COR: KEY STRATERGIES
    TABLE 113.COBOD INTERNATIONAL A/S: COMPANY SNAPSHOT
    TABLE 114.COBOD INTERNATIONAL A/S: OPERATING SEGMENTS
    TABLE 115.COBOD INTERNATIONAL A/S: PRODUCT PORTFOLIO
    TABLE 116.COBOD INTERNATIONAL A/S: NET SALES
    TABLE 117.COBOD INTERNATIONAL A/S: KEY STRATERGIES
    TABLE 118.D-SHAPE: COMPANY SNAPSHOT
    TABLE 119.D-SHAPE: OPERATING SEGMENTS
    TABLE 120.D-SHAPE: PRODUCT PORTFOLIO
    TABLE 121.D-SHAPE: NET SALES
    TABLE 122.D-SHAPE: KEY STRATERGIES
    TABLE 123.CYBE CONSTRUCTION: COMPANY SNAPSHOT
    TABLE 124.CYBE CONSTRUCTION: OPERATING SEGMENTS
    TABLE 125.CYBE CONSTRUCTION: PRODUCT PORTFOLIO
    TABLE 126.CYBE CONSTRUCTION: NET SALES
    TABLE 127.CYBE CONSTRUCTION: KEY STRATERGIES
    TABLE 128.HOLCIM: COMPANY SNAPSHOT
    TABLE 129.HOLCIM: OPERATING SEGMENTS
    TABLE 130.HOLCIM: PRODUCT PORTFOLIO
    TABLE 131.HOLCIM: NET SALES
    TABLE 132.HOLCIM: KEY STRATERGIES
  • LIST OF FIGURES

  • FIGURE 1.3D CONCRETE PRINTING MARKET SEGMENTATION
    FIGURE 2.3D CONCRETE PRINTING MARKET,2021-2031
    FIGURE 3.3D CONCRETE PRINTING MARKET,2021-2031
    FIGURE 4. TOP INVESTMENT POCKETS, BY REGION
    FIGURE 5.PORTER FIVE-1
    FIGURE 6.PORTER FIVE-2
    FIGURE 7.PORTER FIVE-3
    FIGURE 8.PORTER FIVE-4
    FIGURE 9.PORTER FIVE-5
    FIGURE 10.TOP PLAYER POSITIONING
    FIGURE 11.3D CONCRETE PRINTING MARKET:DRIVERS, RESTRAINTS AND OPPORTUNITIES
    FIGURE 12.3D CONCRETE PRINTING MARKET,BY PRINTING TYPE,2021(%)
    FIGURE 13.COMPARATIVE SHARE ANALYSIS OF GANTRY SYSTEM 3D CONCRETE PRINTING MARKET,2021-2031(%)
    FIGURE 14.COMPARATIVE SHARE ANALYSIS OF ROBOTIC ARM 3D CONCRETE PRINTING MARKET,2021-2031(%)
    FIGURE 15.3D CONCRETE PRINTING MARKET,BY TECHNIQUE,2021(%)
    FIGURE 16.COMPARATIVE SHARE ANALYSIS OF EXTRUSION-BASED 3D CONCRETE PRINTING MARKET,2021-2031(%)
    FIGURE 17.COMPARATIVE SHARE ANALYSIS OF POWDER-BASED 3D CONCRETE PRINTING MARKET,2021-2031(%)
    FIGURE 18.3D CONCRETE PRINTING MARKET,BY END-USE SECTOR,2021(%)
    FIGURE 19.COMPARATIVE SHARE ANALYSIS OF RESIDENTIAL 3D CONCRETE PRINTING MARKET,2021-2031(%)
    FIGURE 20.COMPARATIVE SHARE ANALYSIS OF COMMERCIAL 3D CONCRETE PRINTING MARKET,2021-2031(%)
    FIGURE 21.COMPARATIVE SHARE ANALYSIS OF INFRASTRUCTURE 3D CONCRETE PRINTING MARKET,2021-2031(%)
    FIGURE 22.3D CONCRETE PRINTING MARKET BY REGION,2021
    FIGURE 23.U.S. 3D CONCRETE PRINTING MARKET,2021-2031($MILLION)
    FIGURE 24.CANADA 3D CONCRETE PRINTING MARKET,2021-2031($MILLION)
    FIGURE 25.MEXICO 3D CONCRETE PRINTING MARKET,2021-2031($MILLION)
    FIGURE 26.GERMANY 3D CONCRETE PRINTING MARKET,2021-2031($MILLION)
    FIGURE 27.FRANCE 3D CONCRETE PRINTING MARKET,2021-2031($MILLION)
    FIGURE 28.UK 3D CONCRETE PRINTING MARKET,2021-2031($MILLION)
    FIGURE 29.DENMARK 3D CONCRETE PRINTING MARKET,2021-2031($MILLION)
    FIGURE 30.REST OF EUROPE 3D CONCRETE PRINTING MARKET,2021-2031($MILLION)
    FIGURE 31.CHINA 3D CONCRETE PRINTING MARKET,2021-2031($MILLION)
    FIGURE 32.JAPAN 3D CONCRETE PRINTING MARKET,2021-2031($MILLION)
    FIGURE 33.INDIA 3D CONCRETE PRINTING MARKET,2021-2031($MILLION)
    FIGURE 34.SOUTH KOREA 3D CONCRETE PRINTING MARKET,2021-2031($MILLION)
    FIGURE 35.REST OF ASIA-PACIFIC 3D CONCRETE PRINTING MARKET,2021-2031($MILLION)
    FIGURE 36.LATIN AMERICA 3D CONCRETE PRINTING MARKET,2021-2031($MILLION)
    FIGURE 37.MIDDLE EAST 3D CONCRETE PRINTING MARKET,2021-2031($MILLION)
    FIGURE 38.AFRICA 3D CONCRETE PRINTING MARKET,2021-2031($MILLION)
    FIGURE 39. TOP WINNING STRATEGIES, BY YEAR
    FIGURE 40. TOP WINNING STRATEGIES, BY DEVELOPMENT
    FIGURE 41. TOP WINNING STRATEGIES, BY COMPANY
    FIGURE 42.PRODUCT MAPPING OF TOP 10 PLAYERS
    FIGURE 43.COMPETITIVE DASHBOARD
    FIGURE 44.COMPETITIVE HEATMAP OF TOP 10 KEY PLAYERS
    FIGURE 45.HEIDELBERGCEMENT AG.: NET SALES ($MILLION)
    FIGURE 46.SKANSKA AB.: NET SALES ($MILLION)
    FIGURE 47.YINGCHUANG BUILDING TECHNIQUE (SHANGHAI) CO., LTD. (WINSUN).: NET SALES ($MILLION)
    FIGURE 48.XTREEE.: NET SALES ($MILLION)
    FIGURE 49.SIKA AG.: NET SALES ($MILLION)
    FIGURE 50.APIS COR.: NET SALES ($MILLION)
    FIGURE 51.COBOD INTERNATIONAL A/S.: NET SALES ($MILLION)
    FIGURE 52.D-SHAPE.: NET SALES ($MILLION)
    FIGURE 53.CYBE CONSTRUCTION.: NET SALES ($MILLION)
    FIGURE 54.HOLCIM.: NET SALES ($MILLION)


The utilization of 3D concrete printing service is expected to increase, owing to rapid urbanization and environmental awareness. Moreover, significant technological advancements in 3D printing technology fuel the market growth. In 2021, Asia-Pacific region was the highest revenue contributor to the global market, whereas LAMEA is expected to offer lucrative opportunities to the key players in the market.

Solution to overcome high labor cost, accuracy in complex design products, and cost-efficiency in mass production drive the 3D concrete printing market growth. However, high investment costs and limitation of printer considering the size of the objects to be printed impede the market growth. On the contrary, advanced technology used for building in developed nations is expected to create lucrative opportunities for the expansion of the 3D concrete printing market during the forecast period.

However, the technology has some challenges such as development of exact raw material, low material strength, poor surface finish, and lack of technical expertise on software and hardware. Research and development by the players in the market will make it possible to overcome these challenges and therefore boost the market growth during the forecast period. Thus, companies are adopting strategies like business expansion, product launch, and partnership to overcome these challenges and drive the growth of the market. For instance, in June 2020, LafargeHolcim introduced its first dry mortar range that is suitable for 3D printing.

PURCHASE OPTIONS

Call or Email us

U.S.-Canada Toll-free: +1-800-792-5285
Int'l : +1-503-894-6022
Europe : +44-845-528-1300
Email : help@alliedmarketresearch.com
 
FREQUENTLY ASKED QUESTIONS?

A. The global 3D concrete printing market was valued at $371.7 million in 2021, and is projected to reach $1,256,522.8 million by 2031, registering a CAGR of 131.8% from 2022 to 2031.

A. The forecast period considered for the global 3D concrete printing market is 2022 to 2031, wherein, 2021 is the base year, 2022 is the estimated year, and 2031 is the forecast year.

A. To get latest version of global 3D concrete printing market report can be obtained on demand from the website.

A. The base year considered in the global 3D concrete printing market report is 2021.

A. The major players profiled in the 3D concrete printing market include Apis Cor, Cobod International A/S, CyBe Construction, D-shape, Heidelbergcement AG (ItalcementiSpA), LafargeHolcim, Sika AG, Skanska, Yingchuang Building Technique (Shanghai) Co., Ltd. (Winsun), and XtreeE.

A. The top ten market players are selected based on two key attributes - competitive strength and market positioning.

A. The report contains an exclusive company profile section, where leading companies in the market are profiled. These profiles typically cover company overview, geographical presence, market dominance (in terms of revenue and volume sales), various strategies and recent developments.

A. By printing type, the gantry segment is the highest share holder of 3D concrete printing market.

Looking for Customization?

 Customization Request

Have a Question?

 Speak with Analyst

Any Confusion?

 Inquire Before Buying

Have a glance of the Report

  Request Sample
RELATED TAGS

Purchase Full Report of
3d Concrete Printing Market

Start reading instantly.
This Report and over 68,439+ more Reports, Available with Avenue Library. T&C*.

  • Online Only
  • $3,570
  • Online cloud access only
  • Restricted print, copy, paste & download
  • Read only
  • Free industry update
    (Within 180 days)
  • Free report update in next update cycle
    (Oct 2023 - Oct 2024)
  • Data Pack
  • $3,840
  • Restricted to one authorized user
  • One print only
  • Available in
    Excel
  • Free industry update
    (Within 180 days)
  •   Free report update in next update cycle
    (Oct 2023 - Oct 2024)
  • Single User
  • $5,730
  • Restricted to one authorized user
  • One print only
  • Available in
    PDF
  • Free industry update
    (Within 180 days)
  •   Free report update in next update cycle
    (Oct 2023 - Oct 2024)
  • Five Users
  • $6,450
  • Limited to five authorized users
  • Print upto five copies
  • Available in
    PDF
  • Free industry update
    (Within 180 days)
  •   Free report update in next update cycle
    (Oct 2023 - Oct 2024)
  • Enterprise
    License/PDF

  • $9,600
  • Unlimited
    within
    company/enterprise
  • Available in Excel & PDF
  • Free industry update
    (Within 180 days)
  •   Free report update in next update cycle
    (Oct 2023 - Oct 2024)
  • Library
    Membership

  • $999 $ 1,175
    Per User/ Per month/ Billed annually
  • Published Content
    E-access
  • Company Profiles
    E-access
  • Newly Added Content Access
  • 10 PDF
    Downloads
  • 5 Excel Data
    Pack Downloads
  • 250 Company Profiles PDF Downloads
  • Buy Now

*Taxes/Fees, if applicable will be added during checkout. All prices in USD

RELATED REPORTS
 

Why Allied Market Research?


Infallible Methodology

To ensure high-level data integrity, accurate analysis, and impeccable forecasts

Analyst Support

For complete satisfaction

Customization

On-demand customization of scope of the report to exactly meet your needs

TARGETED MARKET VIEW

Targeted market view to provide pertinent information and save time of readers

Get fresh content delivered

Get insights on topics that are crucial for your business. Stay abreast of your interest areas.

Get Industry Data Alerts

Why Allied Market Research?

Infallible Methodology

To ensure high-level data integrity, accurate analysis, and impeccable forecasts

Analyst Support

For complete satisfaction

Customization

On-demand customization of scope of the report to exactly meet your needs

TARGETED MARKET VIEW

Targeted market view to provide pertinent information and save time of readers