
3D Printing Construction Market Overview
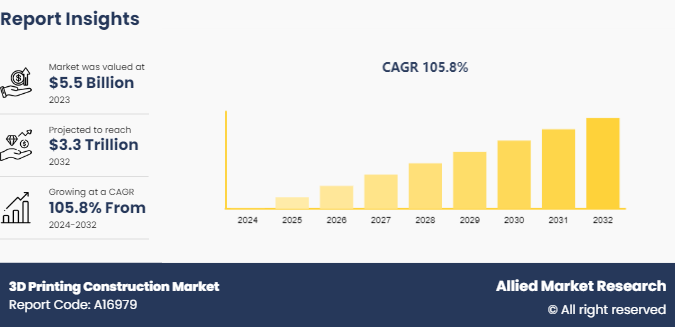
The global 3d printing construction market size was valued at $5.5 billion in 2023, and is projected to reach $3.3 trillion by 2032, growing at a CAGR of 105.8% from 2024 to 2032. This is primarily due to increased government investments in the construction of new buildings and infrastructure. Additionally, the numerous benefits offered by 3D printing in construction are expected to create substantial growth opportunities. The launch of innovative 3D printing materials by key industry players is also contributing to the expansion of the global 3D printing construction market.
Market Dynamics & Insights
- By material type, the concrete segment held the largest share in the 3D printing construction market size for 2023.
- By construction method, the extrusion segment held the largest share in the precast construction market for 2023.
- Asia-Pacific is expected to witness the highest CAGR during the 3D printing construction market forecast period.
Market Size & Future Outlook
- 2023 Market Size: $5.5 Billion
- 2032 Projected Market Size: $3.3 Trillion
- CAGR (2024-2032): 105.8%
- North America: Largest market in 2023
- Asia-Pacific: Fastest growing market
Market Introduction and Definition
3D printing construction technology is a method, which includes printing 3D structures layer by layer using a 3D printer. Researchers have printed bridges in polymer, concrete, metal off-site, and complete structures in clay or concrete on-site to showcase the technique. The technique offers faster construction by using less materials with lower labor costs.
Key Takeaways
- The 3D printing construction market overview study covers 20 countries. The research includes a segment analysis of each country in terms of value ($Billion) for the projected period 2023-2032.
- More than 1, 500 product literatures, industry releases, annual reports, and other such documents of major 3D printing construction system industry participants along with authentic industry journals, trade associations' releases, and government websites have been reviewed for generating high-value industry insights.
- The study integrated high-quality data, professional opinions and analysis, and critical independent perspectives. The research approach is intended to provide a balanced view of global markets and to assist stakeholders in making educated decisions in order to achieve their most ambitious growth objectives.
Industry Trends
- In October 2023, Tvasta, a Chennai-based construction company build a 3D-printed building in Thiruvananthapuram. It is designed as a demonstration project, AMAZE-28.
- In August 2023, L&T Construction unveiled the 3D printed post office. It is constructed by using COBOD's BOD2 3D construction printer.
- In January 2024, AJAX Engineering launched 3D concrete printing machine. The AJAX 3D concrete printer seamlessly works with a CAD design to create a physical object from a CAD model.
Key Market Dynamics
The global 3D printing construction industry is being driven by the increase in use of 3D printers in the construction industry for making precise final products, developing & prototyping while lowering the production, and materials cost. In addition, various advantages include high precision that increased productivity, lower labor costs, and faster printing, which boost the 3D printing construction market growth. Furthermore, one of the primary reasons that drive market growth is rise in adoption of green buildings and structures throughout the world. New commercial construction projects, such as business complexes, hospitals, housing facilities, and shopping malls, are being prompted by population growth. Moreover, construction of roads, bridges, railways, and airports drive the expansion of the 3D printing construction market.
Value Chain Analysis of Global 3D Printing Construction Market
The value chain of the global 3D printing construction market encompasses various stages, each adding value through different processes, technologies, and activities.
- Raw Material Supply: Procuring raw materials like concrete, composites, polymers, and metals specifically designed for 3D printing applications. Innovating and enhancing materials to improve their suitability for 3D printing, including developing materials with specific properties like high strength, durability, and fast setting times.
- Design and Manufacturing of 3D Printers: Creating advanced 3D printers capable of handling large-scale construction projects. Developing software for design, modeling, and controlling the 3D printing process. Advancing printing techniques such as contour crafting, powder bonding, and extrusion to improve efficiency and quality.
- Design and Engineering Services: Creating detailed digital models and blueprints for construction projects. Conducting structural analysis and simulations to ensure the integrity and safety of the designs. Tailoring designs to leverage the unique capabilities of 3D printing, optimizing for material use and construction efficiency.
- Construction and Assembly: Preparing the construction site, including setting up 3D printers and ensuring appropriate environmental conditions. Layer-by-layer printing of building components or entire structures. Assembling printed components, finishing surfaces, and integrating utilities like plumbing and electrical systems.
- Quality Control and Testing: Ensuring that the materials used meet the required specifications and standards. Verifying the strength, durability, and safety of printed structures through various testing methods. Conducting inspections and obtaining necessary certifications to ensure compliance with building codes and regulations.
- Marketing and Sales: Understanding market trends, customer needs, and competitive landscape. Promoting 3D printing construction solutions through various channels. Establish distribution networks and sales strategies to reach target customers.
- After-Sales Services: Providing ongoing support and maintenance for 3D printed structures and equipment. Offering training programs for customers to effectively use 3D printing technology. Continuously improving and upgrading equipment and materials based on customer feedback and technological advancements.
3D Printing Construction Market Segmentation Overview
The 3D printing construction market is segmented into construction method, by material type, and by end-user. Based on construction method, the market is divided into extrusion and power bonding. As per material type, the market is divided into concrete, metal, and composite. Based on end user, the market is divided into buildings and infrastructure. Region wise, the 3D printing construction market share is analyzed across North America (U.S., Canada, Mexico) , Europe (Germany, UK, France, Italy, Rest of Europe) , Asia-Pacific (China, India, Japan, South Korea, Rest of Asia-Pacific) , and LAMEA (Latin America, Middle East, and Africa) .
Regional/Country Market Outlook
The regional and country market outlook for the 3D printing construction market can vary based on several factors including economic conditions, industrial development, infrastructure projects, regulatory policies, and construction activities.
- Strong innovation ecosystems, substantial investments, and favorable government policies have led to the adoption of 3D printing construction technology. There is high demand for sustainable building practices, significant investments in infrastructure, and a robust tech industry.
- European countries such as Germany, the UK, France, and Italy have well-established construction and industrial sectors, driving demand for 3D printing construction in various applications including factories, warehouses, and public infrastructure.
- Emerging markets in Eastern Europe, including Poland, Russia, and Turkey, present growth opportunities for manufacturers and suppliers of 3D printing construction.
- Increasing investments in Asia-Pacific construction projects, manufacturing facilities, transportation infrastructure, and commercial buildings drive demand for 3D printing construction in the region.
- China, as the world's largest steel producer and consumer, represents a significant market for 3D printing construction, especially in sectors such as manufacturing, logistics, and construction.
- Middle East, particularly countries like the United Arab Emirates, Saudi Arabia, and Qatar, exhibit strong demand for 3D printing construction driven by ongoing construction projects, industrial expansion, and infrastructure development initiatives.
- Latin American countries such as Brazil, Argentina, and Chile are key markets for 3D printing construction, supported by infrastructure investments, industrial growth, and urban development projects.
Competitive Landscape
The major players operating in the 3D printing construction market include Aectual, CyBe Construction, ICON Technology Inc., Skanska AB, Peri group, Contour Crafting, Apis Cor, MX3D, XtreeE, and Branch technology.
Key Sources Referred
- Global Construction Outlook 2023
- World Steel Association
- National Association of Architectural Metal Manufacturers (NAAMM)
- Manufacturers Association (SMA)
- American Institute of Steel Construction (AISC)
- Ministry of Housing and Urban Affairs (India)
- World Economic Forum
- European Committee for Standardization (CEN)
What are the Key Benefits for Stakeholders
- This report provides a quantitative analysis of the market segments, current analysis and trends, estimations, and dynamics of the 3d printing construction market from 2024 to 2032 to identify the prevailing 3d printing construction market opportunity.
- The market research is offered along with information related to key drivers, restraints, and 3D printing construction opportunity.
- Porter's five forces 3D printing construction market analysis highlights the potency of buyers and suppliers to enable stakeholders make profit-oriented business decisions and strengthen their supplier-buyer network.
- In-depth analysis of the 3d printing construction market segmentation assists to determine the prevailing market opportunities.
- Major countries in each region are mapped according to their revenue contribution to the global 3D printing construction market forecast.
- Market player positioning facilitates benchmarking and provides a clear understanding of the present position of the market players.
- The report includes the analysis of the regional as well as global 3d printing construction market trends, key players, market segments, application areas, and market growth strategies.
3D Printing Construction Market Report Highlights
| Aspects | Details |
| Market Size By 2032 | USD 3.3 Trillion |
| Growth Rate | CAGR of 105.8% |
| Forecast period | 2024 - 2032 |
| Report Pages | 187 |
| By Construction Method |
|
| By Material Type |
|
| By End-user |
|
| By Region |
|
| Key Market Players | MX3D, Skanska AB, Branch technology, CyBe Construction, Aectual, ICON Technology Inc, Apis Cor, XtreeE, Contour Crafting, Peri group |
The 3D printing construction market has been experiencing significant growth due to advancements in technology, increasing demand for sustainable construction methods, and cost-efficiency.
The buildings are the leading end user of 3D Printing Construction Market
Asia-Pacific is the largest regional market for 3D Printing Construction
The 3D printing construction market was valued at $5.5 billion in 2023
The major players operating in the 3D printing construction market include Aectual, CyBe Construction, ICON Technology Inc., Skanska AB, Peri group, Contour Crafting, Apis Cor, MX3D, XtreeE, and Branch technology.
Loading Table Of Content...

