
3D Printing Materials Market Overview :
3D Printing Materials Market was valued at $578 million, and is expected to reach $1,871 million by 2022, supported by a CAGR of 18.3%. 3D printing is defined as an additive manufacturing process meant for accomplishing three-dimensional solid object by adding subsequent layers of materials to compose the object. The devices used for this purpose is termed as 3D printers.
.jpg)
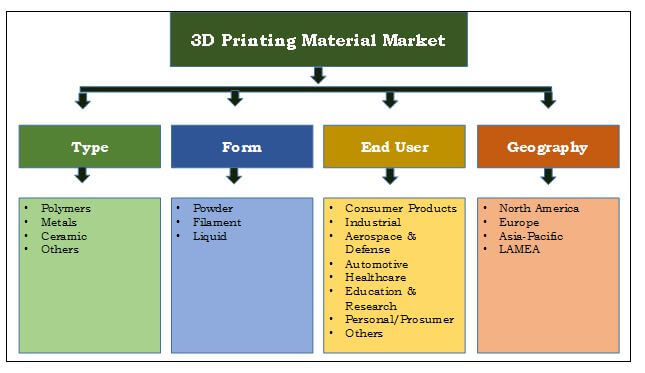
The digital file containing information for the configuration of the desired object and the materials used act as an intermediate between the resultant product and the 3D printers. This report provides a comprehensive analysis of the materials that are used during 3D printing, termed as 3D printing materials. These materials are used in three forms i.e., powder, filament and liquid, in which liquid form is employed at a large scale. The report is also defining the recent trends and future growth potential of the 3D printing materials market. Polymers (plastics), metals, ceramics, among others, are some of the currently used 3D printing materials. Amongst them, polymers are the most commonly used printing materials and is expected to continue accounting for major material demand in the forecast period. This is because of the major applications served by the plastics in industries and consumer goods of the 3D printing material market.
The report also focuses on the end user of the materials which includes, consumer products; industrial; aerospace and defense; automotive; healthcare; education and research; personal/prosumer; and others. Amid them automotive is the major end user utilizing 3D printing materials and expected to do so in the forecast period too. Moreover, the report analyzes the current market trends of the 3D printing materials across different regions, and forecasts the opportunities in the market by analyzing government regulations, policies, and consumer preferences across various geographic regions. The figures provided in this report are based on the demand or consumption quantity across the type of material and end user, at country level. The market value and volumes are further derived by doing bottom-up approach and considering price trends.
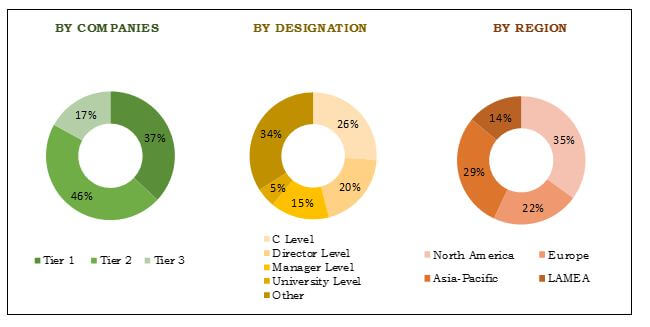
Breakdown of Primary Respondents
According to the perspectives of CXOs of leading companies, growth in investment towards R&D, increase in adoption of 3D printing devices, development of low cost devices, and decrease in the price of materials are driving the demand for 3D printing materials. Polymers and metals are the most widely used 3D printing material. Across the industry, significant efforts are being made to commercialize new materials to meet the specification of high end applications. Demand for polymers in 3D printing material market is growing significantly owing to a significant upsurge in the demand for desktop printing, whereas demand for metals is growing primarily due to growing penetration in high end applications such as structural parts in automotive and aerospace industry. According to the CXOs, the demand for 3D printing material is witnessing significant growth in all the regions, due to decreasing price and rapid acceptance of 3D printing technology from prototyping, product designing, and concept modelling to final product manufacturing.
Breakdown of Primary Respondents
The key players in the world 3D printing materials market have adopted various business strategies, such as research and development, product launch, agreement, acquisition, collaboration, expansion, and partnership, to sustain the intense market competition. The stakeholders of the 3D printing materials market include 3D printing material providers who distribute their products to several end-user industries across the globe. The data pertaining to market players and their strategic moves have been obtained through press releases of companies, blogs, and primary calls to the experts in the industry.
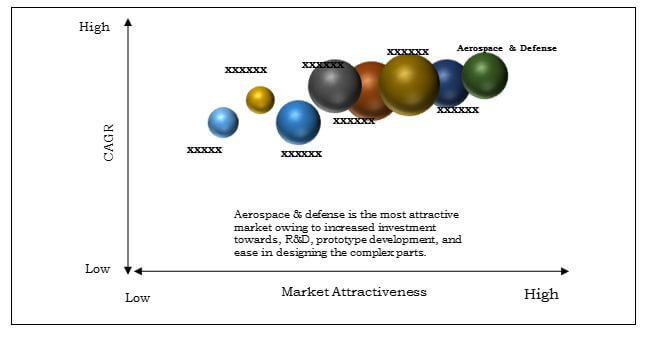
Top Investment Pockets
In the world 3D printing materials market, with respect to end user, aerospace and defense is the most lucrative segment followed by industrial sector, automotive, and others. Significant investment towards R&D in 3D printing by major companies along with consumer acceptance is driving the demand for 3D printing materials in the aerospace and defense sector. North America is the major region which is driving the demand for metals in aerospace and defense sector owing to a high demand and huge investment in research and development.
Top Investment Pockets
At present scenario, 3D printing is majorly used for prototype development, mold, or core designing and to some extent manufacturing of end parts or products. High cost of materials such as metals and metal alloys are restricting its widespread penetration in sectors such as industrial; aerospace and defense; healthcare; automotive; and others. In addition, the cost of 3D printers used for industrial purpose is significantly high which is hampering the market growth of both 3D printers and printing materials.
Polymers are the most widely used material in the 3D printing materials market. It found applications in both desktop printing and in other industrial applications. Acrylonitrile butadiene styrene (ABS), polylactic acid (PLA), nylon, PET, and photopolymers are the most commonly used polymers in the 3D printing material industry.
In the healthcare industry, 3D printing is playing a significant role in terms of applications such as for dental surgery, replacing burnt skin, airway splints for babies with tracheobronchomalacia (TBM), and many others. It is not only helping cure some of the most chronic disease but also in the replacement of the damaged parts. For instance, expert have developed airway splints for babies with tracheobronchomalacia, which makes the tiny airways around the lungs prone to collapsing. Airway splints is one of the most significant developments in the healthcare industry as they are the first 3D implant made for kids and they’re designed to grow with the patient. It had been successfully tested in children between the ages of three months and 16 months. As per sources these splints can be produced in a matter of hours, and they only cost about $10 per unit. Increased R&D activities towards implementation of 3D printing technology in healthcare sector are expected to provide significant opportunities to the industry players in terms of new commercial avenues for their existing and new product range.
Asia-Pacific 3D Printing Materials Market
3D Printing Materials Market Segmentation
Increase in the disposable income of the countries such as China, India, ASEAN, and others are driving the industries such as consumer products, automotive, healthcare, and others. Polymers is the largest segment in the region in terms of 3D printing materials demand due to wide adoption of desktop printers in the region. However, metal is the fastest growing segment owing to increasing penetration in the sectors such as energy, aerospace & defense, education & research, healthcare, and industrial. In the region global players such as Stratasys, 3D Systems, EOS GmbH, and Arkema are investing immensely to meet the growing demand.
China 3D Printing Materials Market: 2014–2022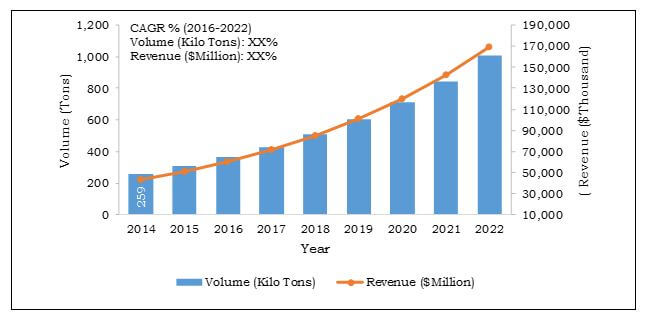
Key players profiled in this report include 3D Systems Corp., Arcam AB, Arkema S.A., Royal DSM N.V., Exone GmbH, Stratasys Ltd., CRP Group, Envisiontec GmbH, EOS GmbH Electro Optical Systems, and LPW Technology Ltd. are also provided in this report.
Other major players in the industry include Advanc3d Materials, Advanced Powders and Coatings, Cookson Precious Metals, Exceltec, Formlabs, Toner Plastic, TLC Korea, Taulman 3D, Maker Juice, and Legor Group.
Key Market Benefits:
This report provides an extensive analysis of the current and emerging market trends and dynamics in the global 3D printing materials market.
In-depth analysis is conducted by constructing market estimations for key market segments between 2014 and 2022.
- Geographically, the 3D printing materials market is analyzed based on various regions such as North America, Europe, Asia-Pacific, and LAMEA. It also includes country analysis of major countries in each geographic region.
- This study evaluates competitive landscape and value chain to interpret the competitive environment across various geographies.
- Comprehensive analysis of factors that drive and restrict the growth of the global 3D printing materials market is provided.
- Exhaustive analysis of the global 3D printing materials market by type predicts the major material used currently along with the ones that would gain prominence in the future.
- Extensive analysis of the market is conducted by following key product positioning and monitoring the top competitors within the framework.
3D Printing Materials Market Report Highlights
| Aspects | Details |
| By Type |
|
| By Form |
|
| By End User |
|
| By Geography |
|
| Key Market Players | ExOne GmbH, LPW Technology Ltd, THE ARKEMA GROUP, Royal DSM N.V., 3D Systems, Inc., Arcam AB, Stratasys Ltd., ENVISIONTEC, INC., CRP TECHNOLOGY S.r.l., EOS GmbH-Electro Optical Systems |
| Other players in the value chain include | Advanc3d Materials, Advanced Powders and Coatings, Cookson Precious Metals, Exceltec, Formlabs, Toner Plastic, TLC Korea, Taulman 3D, Maker Juice, Legor Group |
Loading Table Of Content...

