0
2022
Iot In Transportation Market

IoT in Transportation Market

by Type (Hardware, Software, and Services), Mode of Transport (Roadways, Railways, Airways, and Maritime), and Application (Traffic Congestion Control Systems; Automotive Telematics; Reservation, Toll, & Ticketing Systems; Security & Surveillance Systems; Remote Monitoring; and Others): Global Opportunity Analysis and Industry Forecast, 2021-2030

Report Code: A02153
Feb 2022 | Pages: 250
Tables: 124
Charts: 61
  • Formats*:

  • pdf

    Single User License, Five User
    License & Enterprise User License

  • xls

    Data Pack Excel License

  • ppt

    It comes with the additional cost
    of $2500.00 contact sales.


COVID-19

Pandemic disrupted the entire world and affected many industries.

Get detailed COVID-19 impact analysis on the Iot In Transportation Market

Request Now !

IoT in Transportation Market Statistics: 2030

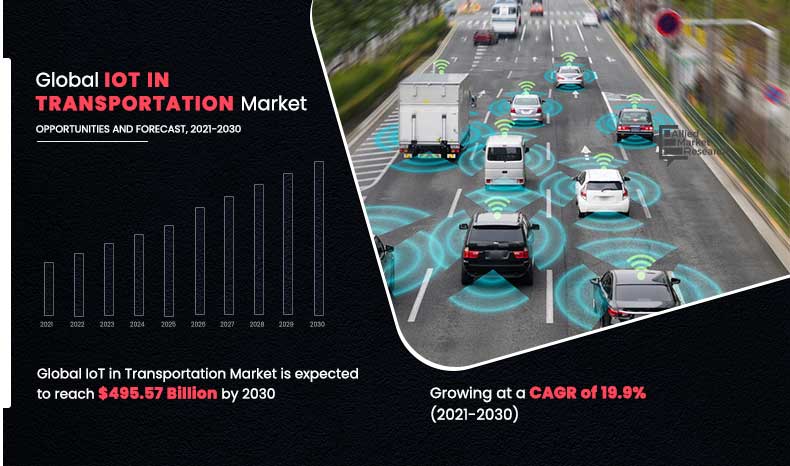
The global IoT in transportation market size was valued at $83.25 billion in 2020, and is projected to reach $495.57 billion by 2030, registering a CAGR of 19.9% from 2021 to 2030.

Due to the COVID-19 pandemic, the IoT in transportation market is expected to decile as a result of numerous government, public, and other organizations adopting a work-from-home culture for their personnel. Moreover, a number of government agencies and non-governmental organizations (NGOs) are using IoT in transportation to reduce losses caused by natural disasters, pandemic situations, and to increase their market share.

IoT for transportation is the networking of objects via embedded sensors, actuators, and other devices that gather and transmit data about real-world activities. Use of IoT enabled technology is changing the way that the transportation sector operates. In addition, IoT technologies help to provide customers with more accurate, up-to-date, real-time data to better plan journeys, and improve communication. Moreover, it provides ability to track things such as train speeds, aircraft part conditions, roadway temperatures, and number of vehicles at an intersection using IoT enabled technology can all help to improve the safety of our transit systems worldwide.

	IoT-in-Transportation-Market,-2021-2030

Enhanced internet penetration and decreased cost of powerful sensors & controllers drive growth of the market. In addition, growth in information, communication, & technology (ICT) fuels growth of the market. However, poor internet infrastructure in developing nations is expected to impede the market growth. Furthermore, adoption of cloud computing and analytics is expected to provide lucrative opportunities for the market growth.

By mode of transport, the roadways segment dominated the IoT in transportation market in 2020, and is expected to continue its dominance in the coming years as it addresses problems such high maintenance cost, accidents, and loss of life. However, the rail segment is expected to witness growth at the highest rate during the forecast period. Improvement of operational efficiency, passenger experience, and the operators’ return on investments are expected to fuel the market growth in railways.

Region wise, the IoT in transportation industry was dominated by North America in 2020, owing to large number of vendors and favorable government policies. However, Asia-Pacific is expected to witness growth at the highest rate, owing to large population base and hub for global goods transportation.

The report focuses on growth prospects, restraints, and trends of the IoT in transportation market analysis. The study provides Porter’s five forces analysis to understand impact of various factors, such as bargaining power of suppliers, competitive intensity of competitors, threat of new entrants, threat of substitutes, and bargaining power of buyers on the IoT in transportation market share.

Segment Review

The global IoT in transportation market is segmented on the basis of type, mode of transport, application, and region. By type, it is categorized into hardware, software, and services. By mode of transport, it is divided into roadways, railways, airways, and maritime. By application, it is classified into traffic congestion control systems; automotive telematics; reservation, toll, & ticketing systems; security & surveillance systems; remote monitoring; and others. Region wise, it is analyzed across North America, Europe, Asia-Pacific, and LAMEA.

The key players operating in the global IoT in transportation industry includes Alcatel-Lucent, AT&T Inc., Garmin International Inc., IBM Corp., Denso Corp., Thales Group, General Electric, Verizon Communications Inc., Cisco Systems, Inc., and TomTom N.V. These players have adopted various strategies to increase their market penetration and strengthen their position in the industry.

COVID-19 Impact Analysis

The IoT in transportation market is projected to decline, owing to COVID-19 situation due to various government, public, and other organizations adopting work from home culture for their employees. In addition, owing to implementation of lockdown by majority of governments the transportation industry was heavily affected. In addition, one of the most popular ideas for using IoT in the transport sector, which is currently being discussed is automated and contactless interaction. Moreover, owing to growth in concern regarding parking spot for trucks, many transportation agencies introduced automated place to park their trucks and at the same time stay safe by limiting the COVID-19 spread. Reservation and payment process is both automated and contactless. Considering the operational part, a special camera will record the license plate at the entrance of each truck and only in case of prior reservation, a truck can enter the parking lot contactless.

IoT in Transportation Market
By Type

Your browser does not support the canvas element.

Softwate segment is projected as one of the most lucrative segments.

Get more information on this report : Request Sample Pages

Top Impacting Factors

Enhanced internet penetration

Increase in penetration of wireless technology boosts growth of the IoT in transportation industry, owing to rise in need for advanced technological solutions such as robots, drones, and self-driving vehicles drives the need for an advanced wireless communication solution. Further, modern internet of things solutions is equipped with next generation 5G wireless network tech that enables faster data transferring and offers highly reliable & more secure infrastructure. Further, surge in demand for high-speed data exchange rates across large numbers of interconnected devices drive the need for IoT in transportation market. In addition, rise in adoption of LoRaWAN (Long Range Wide Area Network) across the Internet of Things application is expected to offer significant growth opportunities for the market during the forecast period.

IoT in Transportation Market
By Application

Your browser does not support the canvas element.

Traffic Congestion Control System segment is projected as one of the most lucrative segments.

Get more information on this report : Request Sample Pages

Adoption of cloud computing and analytics

Increase in adoption of analytics and cloud computing among automobile and shipping & aviation industry manufacturers, owing to advantages such as fuel efficiency, security, enhanced uptime, reliability, enriched IT service, increased flexibility of data access, and operational speed. Cloud computing and analytics combined with IoT offers transportation agencies an upper hand in managing business operations in efficient and timely manner. In addition, cloud-based analytics help the transport industry to reduce their operational costs as well as to reduce infrastructure & storage cost of the organization. Furthermore, cloud-based analytics offers institutes with superior security and provides enhanced safety to critical data of the organization, which provides lucrative opportunities for the market. In addition, cloud computing also helps the transport industry in analyzing large quantity of data set and to enhance their analytics skill, which in turn, is increasing demand for IoT in the transport industry. Furthermore, rapid adoption of connected devices across various education institutes and government initiatives to increase digitization across the industry vertical propels growth of the market.

IoT in Transportation Market
By Region

2030
Asia-pacific 
North America
Europe
LAMEA

Asia-Pacific would exhibit the highest CAGR of 22.6% during 2021-2030.

Get more information on this report : Request Sample Pages

Key Benefits For Stakeholders       

  • The study provides an in-depth analysis of the IoT in transportation market forecast along with the current trends and future estimations to explain the imminent investment pockets.
  • Information about key drivers, restraints, & opportunities and their impact analysis on the global IoT in transportation market trends is provided in the report.
  • Porter’s five forces analysis illustrates the potency of the buyers and suppliers operating in the industry.
  • The quantitative analysis of the IoT in transportation market size from 2021 to 2030 is provided to determine the market potential.

IoT in Transportation Market Report Highlights

Aspects Details
By Component
  • Hardware
  • Software
  • Services
By Mode of Transport
  • Roadways
  • Railways
  • Airways
  • Maritime
By Application
  • Traffic Congestion Control Systems
  • Automotive Telematics
  • Reservation, Toll, & Ticketing Systems
  • Security & Surveillance Systems
  • Remote Monitoring
  • Others
By Region
  • North America  (U.S., Canada, Mexico)
  • Europe   (UK, Germany, France, Italy, Rest of Europe)
  • Asia-Pacific   (China, Japan, India, South Korea, Rest of Asia-Pacific)
  • LAMEA  (Latin America, Middle East, Africa)
By Key Market Players
  • Alcatel-Lucent
  • AT&T Inc.
  • Garmin International Inc.
  • IBM Corp.
  • Denso Corp.
  • Thales Group
  • General Electric
  • Verizon Communications Inc.
  • Cisco Systems, Inc.
  • TomTom N.V.
 

CHAPTER 1:INTRODUCTION

1.1.Report Description
1.2.Key Market Segments
1.3.Key Benefits
1.4.Research Methodology

1.4.1.Primary Research
1.4.2.Secondary Research
1.4.3.Analyst Tools and Models

CHAPTER 2:EXECUTIVE SUMMARY

2.1.CXO Perspective

CHAPTER 3:MARKET LANDSCAPE

3.1.Market Definition and Scope
3.2.Key Findings

3.2.1.Top Investment Pockets
3.2.2.Top Winning Strategies

3.3.Porter's Five Forces Analysis

3.3.1.Bargaining Power of Suppliers
3.3.2.Threat of New Entrants
3.3.3.Threat of Substitutes
3.3.4.Competitive Rivalry
3.3.5.Bargaining Power among Buyers

3.4.Market Share Analysis/Top Player Positioning

3.4.1.Market Share Analysis/Top Player Positioning 2020

3.5.Market Dynamics

3.5.1.Drivers
3.5.2.Restraints
3.5.3.Opportunities

3.6.COVID-19 Impact Analysis
3.7.Patent landscape
3.8.Competitive Heatmap
3.9.Regulatory Guidelines

CHAPTER 4:IOT IN TRANSPORTATION MARKET, BY TYPE

4.1.Market Overview

 4.1.1Market Size and Forecast, By Type

4.2.Hardware

4.2.1.Key Market Trends, Growth Factors and Opportunities
4.2.2.Market Size and Forecast, By Region 
4.2.3.Market Share Analysis, By Country

4.3.Software

4.3.1.Key Market Trends, Growth Factors and Opportunities
4.3.2.Market Size and Forecast, By Region 
4.3.3.Market Share Analysis, By Country

4.4.Services

4.4.1.Key Market Trends, Growth Factors and Opportunities
4.4.2.Market Size and Forecast, By Region 
4.4.3.Market Share Analysis, By Country

CHAPTER 5:IOT IN TRANSPORTATION MARKET, BY MODE OF TRANSPORT

5.1.Market Overview

 5.1.1Market Size and Forecast, By Mode Of Transport

5.2.Road

5.2.1.Key Market Trends, Growth Factors and Opportunities
5.2.2.Market Size and Forecast, By Region 
5.2.3.Market Share Analysis, By Country

5.3.Rail

5.3.1.Key Market Trends, Growth Factors and Opportunities
5.3.2.Market Size and Forecast, By Region 
5.3.3.Market Share Analysis, By Country

5.4.Air

5.4.1.Key Market Trends, Growth Factors and Opportunities
5.4.2.Market Size and Forecast, By Region 
5.4.3.Market Share Analysis, By Country

5.5.Maritime

5.5.1.Key Market Trends, Growth Factors and Opportunities
5.5.2.Market Size and Forecast, By Region 
5.5.3.Market Share Analysis, By Country

CHAPTER 6:IOT IN TRANSPORTATION MARKET, BY APPLICATION

6.1.Market Overview

 6.1.1Market Size and Forecast, By Application

6.2.Traffic Congestion Control System

6.2.1.Key Market Trends, Growth Factors and Opportunities
6.2.2.Market Size and Forecast, By Region 
6.2.3.Market Share Analysis, By Country

6.3.Automotive Telematics

6.3.1.Key Market Trends, Growth Factors and Opportunities
6.3.2.Market Size and Forecast, By Region 
6.3.3.Market Share Analysis, By Country

6.4.Reservation, Toll, And Ticketing Systems

6.4.1.Key Market Trends, Growth Factors and Opportunities
6.4.2.Market Size and Forecast, By Region 
6.4.3.Market Share Analysis, By Country

6.5.Security And Survilliance System

6.5.1.Key Market Trends, Growth Factors and Opportunities
6.5.2.Market Size and Forecast, By Region 
6.5.3.Market Share Analysis, By Country

6.6.Remote Monitoring

6.6.1.Key Market Trends, Growth Factors and Opportunities
6.6.2.Market Size and Forecast, By Region 
6.6.3.Market Share Analysis, By Country

6.7.Others

6.7.1.Key Market Trends, Growth Factors and Opportunities
6.7.2.Market Size and Forecast, By Region 
6.7.3.Market Share Analysis, By Country

CHAPTER 7:IOT IN TRANSPORTATION MARKET, BY REGION

7.1.Market Overview

 7.1.1Market Size and Forecast, By Region

7.2.North America

7.2.1.Key Market Trends and Opportunities
7.2.2.Market Size and Forecast, By Type
7.2.3.Market Size and Forecast, By Mode Of Transport
7.2.4.Market Size and Forecast, By Application
7.2.5.Market Size and Forecast, By Country
7.2.6.United States Iot In Transportation Market

7.2.6.1.Market Size and Forecast, By Type
7.2.6.2.Market Size and Forecast, By Mode Of Transport
7.2.6.3.Market Size and Forecast, By Application

7.2.7.Canada Iot In Transportation Market

7.2.7.1.Market Size and Forecast, By Type
7.2.7.2.Market Size and Forecast, By Mode Of Transport
7.2.7.3.Market Size and Forecast, By Application

7.3.Europe

7.3.1.Key Market Trends and Opportunities
7.3.2.Market Size and Forecast, By Type
7.3.3.Market Size and Forecast, By Mode Of Transport
7.3.4.Market Size and Forecast, By Application
7.3.5.Market Size and Forecast, By Country
7.3.6.France Iot In Transportation Market

7.3.6.1.Market Size and Forecast, By Type
7.3.6.2.Market Size and Forecast, By Mode Of Transport
7.3.6.3.Market Size and Forecast, By Application

7.3.7.Germany Iot In Transportation Market

7.3.7.1.Market Size and Forecast, By Type
7.3.7.2.Market Size and Forecast, By Mode Of Transport
7.3.7.3.Market Size and Forecast, By Application

7.3.8.Italy Iot In Transportation Market

7.3.8.1.Market Size and Forecast, By Type
7.3.8.2.Market Size and Forecast, By Mode Of Transport
7.3.8.3.Market Size and Forecast, By Application

7.3.9.U.K Iot In Transportation Market

7.3.9.1.Market Size and Forecast, By Type
7.3.9.2.Market Size and Forecast, By Mode Of Transport
7.3.9.3.Market Size and Forecast, By Application

7.3.10.Rest Of Europe Iot In Transportation Market

7.3.10.1.Market Size and Forecast, By Type
7.3.10.2.Market Size and Forecast, By Mode Of Transport
7.3.10.3.Market Size and Forecast, By Application

7.4.Asia-Pacific

7.4.1.Key Market Trends and Opportunities
7.4.2.Market Size and Forecast, By Type
7.4.3.Market Size and Forecast, By Mode Of Transport
7.4.4.Market Size and Forecast, By Application
7.4.5.Market Size and Forecast, By Country
7.4.6.China Iot In Transportation Market

7.4.6.1.Market Size and Forecast, By Type
7.4.6.2.Market Size and Forecast, By Mode Of Transport
7.4.6.3.Market Size and Forecast, By Application

7.4.7.Japan Iot In Transportation Market

7.4.7.1.Market Size and Forecast, By Type
7.4.7.2.Market Size and Forecast, By Mode Of Transport
7.4.7.3.Market Size and Forecast, By Application

7.4.8.India Iot In Transportation Market

7.4.8.1.Market Size and Forecast, By Type
7.4.8.2.Market Size and Forecast, By Mode Of Transport
7.4.8.3.Market Size and Forecast, By Application

7.4.9.South Korea Iot In Transportation Market

7.4.9.1.Market Size and Forecast, By Type
7.4.9.2.Market Size and Forecast, By Mode Of Transport
7.4.9.3.Market Size and Forecast, By Application

7.4.10.Rest of Asia Pacific Iot In Transportation Market
 

7.4.10.1.Market Size and Forecast, By Type
7.4.10.2.Market Size and Forecast, By Mode Of Transport
7.4.10.3.Market Size and Forecast, By Application

7.5.LAMEA

7.5.1.Key Market Trends and Opportunities
7.5.2.Market Size and Forecast, By Type
7.5.3.Market Size and Forecast, By Mode Of Transport
7.5.4.Market Size and Forecast, By Application
7.5.5.Market Size and Forecast, By Country
7.5.6.Latin America Iot In Transportation Market

7.5.6.1.Market Size and Forecast, By Type
7.5.6.2.Market Size and Forecast, By Mode Of Transport
7.5.6.3.Market Size and Forecast, By Application

7.5.7.Middle East Iot In Transportation Market

7.5.7.1.Market Size and Forecast, By Type
7.5.7.2.Market Size and Forecast, By Mode Of Transport
7.5.7.3.Market Size and Forecast, By Application

7.5.8.Africa Iot In Transportation Market

7.5.8.1.Market Size and Forecast, By Type
7.5.8.2.Market Size and Forecast, By Mode Of Transport
7.5.8.3.Market Size and Forecast, By Application

CHAPTER 8:COMPANY PROFILES

8.1.ATAndT INTELLECTUAL PROPERTY

8.1.1.Company Overview
8.1.2.Key Executives
8.1.3.Company snapshot
8.1.4.Operating business segments
8.1.5.Product portfolio
8.1.6.Business Performance
8.1.7.Key Strategic Moves and Developments

8.2.CISCO SYSTEM INC.
 

8.2.1.Company Overview
8.2.2.Key Executives
8.2.3.Company snapshot
8.2.4.Operating business segments
8.2.5.Product portfolio
8.2.6.Business Performance
8.2.7.Key Strategic Moves and Developments

8.3.DENSO-HOLDING GMBH And CO. KG
 

8.3.1.Company Overview
8.3.2.Key Executives
8.3.3.Company snapshot
8.3.4.Operating business segments
8.3.5.Product portfolio
8.3.6.Business Performance
8.3.7.Key Strategic Moves and Developments

8.4.GARMIN LTD.

8.4.1.Company Overview
8.4.2.Key Executives
8.4.3.Company snapshot
8.4.4.Operating business segments
8.4.5.Product portfolio
8.4.6.Business Performance
8.4.7.Key Strategic Moves and Developments

8.5.GENERAL ELECTRIC

8.5.1.Company Overview
8.5.2.Key Executives
8.5.3.Company snapshot
8.5.4.Operating business segments
8.5.5.Product portfolio
8.5.6.Business Performance
8.5.7.Key Strategic Moves and Developments

8.6.IBM CORPORATION

8.6.1.Company Overview
8.6.2.Key Executives
8.6.3.Company snapshot
8.6.4.Operating business segments
8.6.5.Product portfolio
8.6.6.Business Performance
8.6.7.Key Strategic Moves and Developments

8.7.NOKIA CORPORATION (ALCATEL-LUCENT S.A.)

8.7.1.Company Overview
8.7.2.Key Executives
8.7.3.Company snapshot
8.7.4.Operating business segments
8.7.5.Product portfolio
8.7.6.Business Performance
8.7.7.Key Strategic Moves and Developments

8.8.THALES GROUP

8.8.1.Company Overview
8.8.2.Key Executives
8.8.3.Company snapshot
8.8.4.Operating business segments
8.8.5.Product portfolio
8.8.6.Business Performance
8.8.7.Key Strategic Moves and Developments

8.9.TOMTOM INTERNATIONAL BV.

8.9.1.Company Overview
8.9.2.Key Executives
8.9.3.Company snapshot
8.9.4.Operating business segments
8.9.5.Product portfolio
8.9.6.Business Performance
8.9.7.Key Strategic Moves and Developments

8.10.VERIZON

8.10.1.Company Overview
8.10.2.Key Executives
8.10.3.Company snapshot
8.10.4.Operating business segments
8.10.5.Product portfolio
8.10.6.Business Performance
8.10.7.Key Strategic Moves and Developments

LIST OF TABLES

TABLE 1.GLOBAL IOT IN TRANSPORTATION MARKET, BY TYPE, 2020-2030 ($MILLION)
TABLE 2.GLOBAL IOT IN TRANSPORTATION MARKET FOR HARDWARE, BY REGION, 2020-2030 ($MILLION)
TABLE 3.GLOBAL IOT IN TRANSPORTATION MARKET FOR SOFTWARE, BY REGION, 2020-2030 ($MILLION)
TABLE 4.GLOBAL IOT IN TRANSPORTATION MARKET FOR SERVICES, BY REGION, 2020-2030 ($MILLION)
TABLE 5.GLOBAL IOT IN TRANSPORTATION MARKET, BY MODE OF TRANSPORT, 2020-2030 ($MILLION)
TABLE 6.GLOBAL IOT IN TRANSPORTATION MARKET FOR ROAD, BY REGION, 2020-2030 ($MILLION)
TABLE 7.GLOBAL IOT IN TRANSPORTATION MARKET FOR RAIL, BY REGION, 2020-2030 ($MILLION)
TABLE 8.GLOBAL IOT IN TRANSPORTATION MARKET FOR AIR, BY REGION, 2020-2030 ($MILLION)
TABLE 9.GLOBAL IOT IN TRANSPORTATION MARKET FOR MARITIME, BY REGION, 2020-2030 ($MILLION)
TABLE 10.GLOBAL IOT IN TRANSPORTATION MARKET, BY APPLICATION, 2020-2030 ($MILLION)
TABLE 11.GLOBAL IOT IN TRANSPORTATION MARKET FOR TRAFFIC CONGESTION CONTROL SYSTEM, BY REGION, 2020-2030 ($MILLION)
TABLE 12.GLOBAL IOT IN TRANSPORTATION MARKET FOR AUTOMOTIVE TELEMATICS, BY REGION, 2020-2030 ($MILLION)
TABLE 13.GLOBAL IOT IN TRANSPORTATION MARKET FOR RESERVATION, TOLL, AND TICKETING SYSTEMS, BY REGION, 2020-2030 ($MILLION)
TABLE 14.GLOBAL IOT IN TRANSPORTATION MARKET FOR SECURITY AND SURVILLIANCE SYSTEM, BY REGION, 2020-2030 ($MILLION)
TABLE 15.GLOBAL IOT IN TRANSPORTATION MARKET FOR REMOTE MONITORING, BY REGION, 2020-2030 ($MILLION)
TABLE 16.GLOBAL IOT IN TRANSPORTATION MARKET FOR OTHERS, BY REGION, 2020-2030 ($MILLION)
TABLE 17.GLOBAL IOT IN TRANSPORTATION MARKET, BY REGION, 2020-2030 ($MILLION)
TABLE 18.NORTH AMERICA IOT IN TRANSPORTATION, BY TYPE, 2020-2030 ($MILLION)
TABLE 19.NORTH AMERICA IOT IN TRANSPORTATION, BY MODE OF TRANSPORT, 2020-2030 ($MILLION)
TABLE 20.NORTH AMERICA IOT IN TRANSPORTATION, BY APPLICATION, 2020-2030 ($MILLION)
TABLE 21.UNITED STATES IOT IN TRANSPORTATION, BY TYPE, 2020-2030 ($MILLION)
TABLE 22.UNITED STATES IOT IN TRANSPORTATION, BY MODE OF TRANSPORT, 2020-2030 ($MILLION)
TABLE 23.UNITED STATES IOT IN TRANSPORTATION, BY APPLICATION, 2020-2030 ($MILLION)
TABLE 24.CANADA IOT IN TRANSPORTATION, BY TYPE, 2020-2030 ($MILLION)
TABLE 25.CANADA IOT IN TRANSPORTATION, BY MODE OF TRANSPORT, 2020-2030 ($MILLION)
TABLE 26.CANADA IOT IN TRANSPORTATION, BY APPLICATION, 2020-2030 ($MILLION)
TABLE 27.EUROPE IOT IN TRANSPORTATION, BY TYPE, 2020-2030 ($MILLION)
TABLE 28.EUROPE IOT IN TRANSPORTATION, BY MODE OF TRANSPORT, 2020-2030 ($MILLION)
TABLE 29.EUROPE IOT IN TRANSPORTATION, BY APPLICATION, 2020-2030 ($MILLION)
TABLE 30.FRANCE IOT IN TRANSPORTATION, BY TYPE, 2020-2030 ($MILLION)
TABLE 31.FRANCE IOT IN TRANSPORTATION, BY MODE OF TRANSPORT, 2020-2030 ($MILLION)
TABLE 32.FRANCE IOT IN TRANSPORTATION, BY APPLICATION, 2020-2030 ($MILLION)
TABLE 33.GERMANY IOT IN TRANSPORTATION, BY TYPE, 2020-2030 ($MILLION)
TABLE 34.GERMANY IOT IN TRANSPORTATION, BY MODE OF TRANSPORT, 2020-2030 ($MILLION)
TABLE 35.GERMANY IOT IN TRANSPORTATION, BY APPLICATION, 2020-2030 ($MILLION)
TABLE 36.ITALY IOT IN TRANSPORTATION, BY TYPE, 2020-2030 ($MILLION)
TABLE 37.ITALY IOT IN TRANSPORTATION, BY MODE OF TRANSPORT, 2020-2030 ($MILLION)
TABLE 38.ITALY IOT IN TRANSPORTATION, BY APPLICATION, 2020-2030 ($MILLION)
TABLE 39.UNITED KINGDOM IOT IN TRANSPORTATION, BY TYPE, 2020-2030 ($MILLION)
TABLE 40.UNITED KINGDOM IOT IN TRANSPORTATION, BY MODE OF TRANSPORT, 2020-2030 ($MILLION)
TABLE 41.UNITED KINGDOM IOT IN TRANSPORTATION, BY APPLICATION, 2020-2030 ($MILLION)
TABLE 42.REST OF EUROPE IOT IN TRANSPORTATION, BY TYPE, 2020-2030 ($MILLION)
TABLE 43.REST OF EUROPE IOT IN TRANSPORTATION, BY MODE OF TRANSPORT, 2020-2030 ($MILLION)
TABLE 44.REST OF EUROPE IOT IN TRANSPORTATION, BY APPLICATION, 2020-2030 ($MILLION)
TABLE 45.ASIA-PACIFIC IOT IN TRANSPORTATION, BY TYPE, 2020-2030 ($MILLION)
TABLE 46.ASIA-PACIFIC IOT IN TRANSPORTATION, BY MODE OF TRANSPORT, 2020-2030 ($MILLION)
TABLE 47.ASIA-PACIFIC IOT IN TRANSPORTATION, BY APPLICATION, 2020-2030 ($MILLION)
TABLE 48.CHINA IOT IN TRANSPORTATION, BY TYPE, 2020-2030 ($MILLION)
TABLE 49.CHINA IOT IN TRANSPORTATION, BY MODE OF TRANSPORT, 2020-2030 ($MILLION)
TABLE 50.CHINA IOT IN TRANSPORTATION, BY APPLICATION, 2020-2030 ($MILLION)
TABLE 51.JAPAN IOT IN TRANSPORTATION, BY TYPE, 2020-2030 ($MILLION)
TABLE 52.JAPAN IOT IN TRANSPORTATION, BY MODE OF TRANSPORT, 2020-2030 ($MILLION)
TABLE 53.JAPAN IOT IN TRANSPORTATION, BY APPLICATION, 2020-2030 ($MILLION)
TABLE 54.INDIA IOT IN TRANSPORTATION, BY TYPE, 2020-2030 ($MILLION)
TABLE 55.INDIA IOT IN TRANSPORTATION, BY MODE OF TRANSPORT, 2020-2030 ($MILLION)
TABLE 56.INDIA IOT IN TRANSPORTATION, BY APPLICATION, 2020-2030 ($MILLION)
TABLE 57.SOUTH KOREA IOT IN TRANSPORTATION, BY TYPE, 2020-2030 ($MILLION)
TABLE 58.SOUTH KOREA IOT IN TRANSPORTATION, BY MODE OF TRANSPORT, 2020-2030 ($MILLION)
TABLE 59.SOUTH KOREA IOT IN TRANSPORTATION, BY APPLICATION, 2020-2030 ($MILLION)
TABLE 60.REST OF ASIA PACIFIC IOT IN TRANSPORTATION, BY TYPE, 2020-2030 ($MILLION)
TABLE 61.REST OF ASIA PACIFIC IOT IN TRANSPORTATION, BY MODE OF TRANSPORT, 2020-2030 ($MILLION)
TABLE 62.REST OF ASIA PACIFIC IOT IN TRANSPORTATION, BY APPLICATION, 2020-2030 ($MILLION)
TABLE 63.LAMEA IOT IN TRANSPORTATION, BY TYPE, 2020-2030 ($MILLION)
TABLE 64.LAMEA IOT IN TRANSPORTATION, BY MODE OF TRANSPORT, 2020-2030 ($MILLION)
TABLE 65.LAMEA IOT IN TRANSPORTATION, BY APPLICATION, 2020-2030 ($MILLION)
TABLE 66.LATIN AMERICA IOT IN TRANSPORTATION, BY TYPE, 2020-2030 ($MILLION)
TABLE 67.LATIN AMERICA IOT IN TRANSPORTATION, BY MODE OF TRANSPORT, 2020-2030 ($MILLION)
TABLE 68.LATIN AMERICA IOT IN TRANSPORTATION, BY APPLICATION, 2020-2030 ($MILLION)
TABLE 69.MIDDLE EAST IOT IN TRANSPORTATION, BY TYPE, 2020-2030 ($MILLION)
TABLE 70.MIDDLE EAST IOT IN TRANSPORTATION, BY MODE OF TRANSPORT, 2020-2030 ($MILLION)
TABLE 71.MIDDLE EAST IOT IN TRANSPORTATION, BY APPLICATION, 2020-2030 ($MILLION)
TABLE 72.AFRICA IOT IN TRANSPORTATION, BY TYPE, 2020-2030 ($MILLION)
TABLE 73.AFRICA IOT IN TRANSPORTATION, BY MODE OF TRANSPORT, 2020-2030 ($MILLION)
TABLE 74.AFRICA IOT IN TRANSPORTATION, BY APPLICATION, 2020-2030 ($MILLION)
TABLE 75.ATANDT INTELLECTUAL PROPERTY: KEY EXECUTIVES
TABLE 76.ATANDT INTELLECTUAL PROPERTY: COMPANY SNAPSHOT
TABLE 77.ATANDT INTELLECTUAL PROPERTY: OPERATING SEGMENTS
TABLE 78.ATANDT INTELLECTUAL PROPERTY: PRODUCT PORTFOLIO
TABLE 79.ATANDT INTELLECTUAL PROPERTY: KEY STRATEGIC MOVES AND DEVELOPMENTS
TABLE 80.CISCO SYSTEM INC.: KEY EXECUTIVES
TABLE 81.CISCO SYSTEM INC.: COMPANY SNAPSHOT
TABLE 82.CISCO SYSTEM INC.: OPERATING SEGMENTS
TABLE 83.CISCO SYSTEM INC.: PRODUCT PORTFOLIO
TABLE 84.CISCO SYSTEM INC.: KEY STRATEGIC MOVES AND DEVELOPMENTS
TABLE 85.DENSO-HOLDING GMBH AND CO. KG: KEY EXECUTIVES
TABLE 86.DENSO-HOLDING GMBH AND CO. KG: COMPANY SNAPSHOT
TABLE 87.DENSO-HOLDING GMBH AND CO. KG: OPERATING SEGMENTS
TABLE 88.DENSO-HOLDING GMBH AND CO. KG: PRODUCT PORTFOLIO
TABLE 89.DENSO-HOLDING GMBH AND CO. KG: KEY STRATEGIC MOVES AND DEVELOPMENTS
TABLE 90.GARMIN LTD.: KEY EXECUTIVES
TABLE 91.GARMIN LTD.: COMPANY SNAPSHOT
TABLE 92.GARMIN LTD.: OPERATING SEGMENTS
TABLE 93.GARMIN LTD.: PRODUCT PORTFOLIO
TABLE 94.GARMIN LTD.: KEY STRATEGIC MOVES AND DEVELOPMENTS
TABLE 95.GENERAL ELECTRIC: KEY EXECUTIVES
TABLE 96.GENERAL ELECTRIC: COMPANY SNAPSHOT
TABLE 97.GENERAL ELECTRIC: OPERATING SEGMENTS
TABLE 98.GENERAL ELECTRIC: PRODUCT PORTFOLIO
TABLE 99.GENERAL ELECTRIC: KEY STRATEGIC MOVES AND DEVELOPMENTS
TABLE 100.IBM CORPORATION: KEY EXECUTIVES
TABLE 101.IBM CORPORATION: COMPANY SNAPSHOT
TABLE 102.IBM CORPORATION: OPERATING SEGMENTS
TABLE 103.IBM CORPORATION: PRODUCT PORTFOLIO
TABLE 104.IBM CORPORATION: KEY STRATEGIC MOVES AND DEVELOPMENTS
TABLE 105.NOKIA CORPORATION (ALCATEL-LUCENT S.A.): KEY EXECUTIVES
TABLE 106.NOKIA CORPORATION (ALCATEL-LUCENT S.A.): COMPANY SNAPSHOT
TABLE 107.NOKIA CORPORATION (ALCATEL-LUCENT S.A.): OPERATING SEGMENTS
TABLE 108.NOKIA CORPORATION (ALCATEL-LUCENT S.A.): PRODUCT PORTFOLIO
TABLE 109.NOKIA CORPORATION (ALCATEL-LUCENT S.A.): KEY STRATEGIC MOVES AND DEVELOPMENTS
TABLE 110.THALES GROUP: KEY EXECUTIVES
TABLE 111.THALES GROUP: COMPANY SNAPSHOT
TABLE 112.THALES GROUP: OPERATING SEGMENTS
TABLE 113.THALES GROUP: PRODUCT PORTFOLIO
TABLE 114.THALES GROUP: KEY STRATEGIC MOVES AND DEVELOPMENTS
TABLE 115.TOMTOM INTERNATIONAL BV.: KEY EXECUTIVES
TABLE 116.TOMTOM INTERNATIONAL BV.: COMPANY SNAPSHOT
TABLE 117.TOMTOM INTERNATIONAL BV.: OPERATING SEGMENTS
TABLE 118.TOMTOM INTERNATIONAL BV.: PRODUCT PORTFOLIO
TABLE 119.TOMTOM INTERNATIONAL BV.: KEY STRATEGIC MOVES AND DEVELOPMENTS
TABLE 120.VERIZON: KEY EXECUTIVES
TABLE 121.VERIZON: COMPANY SNAPSHOT
TABLE 122.VERIZON: OPERATING SEGMENTS
TABLE 123.VERIZON: PRODUCT PORTFOLIO
TABLE 124.VERIZON: KEY STRATEGIC MOVES AND DEVELOPMENTS

LIST OF FIGURES

FIGURE 1.GLOBAL IOT IN TRANSPORTATION MARKET SEGMENTATION
FIGURE 2.GLOBAL IOT IN TRANSPORTATION MARKET
FIGURE 3.SEGMENTATION IOT IN TRANSPORTATION MARKET
FIGURE 4.TOP INVESTMENT POCKET IN IOT IN TRANSPORTATION MARKET
FIGURE 5.TOP WINNING STRATEGIES, 2019-2021*
FIGURE 6.TOP WINNING STRATEGIES, BY DEVELOPMENT, 2019-2021(%)
FIGURE 7.TOP WINNING STRATEGIES, BY COMPANY, 2019-2021*
FIGURE 8.MODERATE BARGAINING POWER OF BUYERS
FIGURE 9.MODERATE BARGAINING POWER OF SUPPLIERS
FIGURE 10.MODERATE THREAT OF NEW ENTRANTS
FIGURE 11.LOW THREAT OF SUBSTITUTION
FIGURE 12.HIGH COMPETITIVE RIVALRY
FIGURE 13.TOP PLAYER POSITIONING, 2020
FIGURE 14.MARKET SHARE ANALYSIS, 2020
FIGURE 15.RESTRAINTS AND DRIVERS: IOT IN TRANSPORTATION MARKET
FIGURE 16.IOT IN TRANSPORTATION MARKET SEGMENTATION, BY TYPE
FIGURE 17.IOT IN TRANSPORTATION MARKET FOR HARDWARE, BY COUNTRY, 2020-2030 ($MILLION)
FIGURE 18.IOT IN TRANSPORTATION MARKET FOR SOFTWARE, BY COUNTRY, 2020-2030 ($MILLION)
FIGURE 19.IOT IN TRANSPORTATION MARKET FOR SERVICES, BY COUNTRY, 2020-2030 ($MILLION)
FIGURE 20.IOT IN TRANSPORTATION MARKET SEGMENTATION, BY MODE OF TRANSPORT
FIGURE 21.IOT IN TRANSPORTATION MARKET FOR ROAD, BY COUNTRY, 2020-2030 ($MILLION)
FIGURE 22.IOT IN TRANSPORTATION MARKET FOR RAIL, BY COUNTRY, 2020-2030 ($MILLION)
FIGURE 23.IOT IN TRANSPORTATION MARKET FOR AIR, BY COUNTRY, 2020-2030 ($MILLION)
FIGURE 24.IOT IN TRANSPORTATION MARKET FOR MARITIME, BY COUNTRY, 2020-2030 ($MILLION)
FIGURE 25.IOT IN TRANSPORTATION MARKET SEGMENTATION, BY APPLICATION
FIGURE 26.IOT IN TRANSPORTATION MARKET FOR TRAFFIC CONGESTION CONTROL SYSTEM, BY COUNTRY, 2020-2030 ($MILLION)
FIGURE 27.IOT IN TRANSPORTATION MARKET FOR AUTOMOTIVE TELEMATICS, BY COUNTRY, 2020-2030 ($MILLION)
FIGURE 28.IOT IN TRANSPORTATION MARKET FOR RESERVATION, TOLL, AND TICKETING SYSTEMS, BY COUNTRY, 2020-2030 ($MILLION)
FIGURE 29.IOT IN TRANSPORTATION MARKET FOR SECURITY AND SURVILLIANCE SYSTEM, BY COUNTRY, 2020-2030 ($MILLION)
FIGURE 30.IOT IN TRANSPORTATION MARKET FOR REMOTE MONITORING, BY COUNTRY, 2020-2030 ($MILLION)
FIGURE 31.IOT IN TRANSPORTATION MARKET FOR OTHERS, BY COUNTRY, 2020-2030 ($MILLION)
FIGURE 32.ATANDT INTELLECTUAL PROPERTY: NET SALES, 2018-2020 ($MILLION)
FIGURE 33.ATANDT INTELLECTUAL PROPERTY: REVENUE SHARE, BY SEGMENT, 2020 (%)
FIGURE 34.ATANDT INTELLECTUAL PROPERTY: REVENUE SHARE, BY REGION, 2020 (%)
FIGURE 35.CISCO SYSTEM INC.: NET SALES, 2018-2020 ($MILLION)
FIGURE 36.CISCO SYSTEM INC.: REVENUE SHARE, BY SEGMENT, 2020 (%)
FIGURE 37.CISCO SYSTEM INC.: REVENUE SHARE, BY REGION, 2020 (%)
FIGURE 38.DENSO-HOLDING GMBH AND CO. KG: NET SALES, 2018-2020 ($MILLION)
FIGURE 39.DENSO-HOLDING GMBH AND CO. KG: REVENUE SHARE, BY SEGMENT, 2020 (%)
FIGURE 40.DENSO-HOLDING GMBH AND CO. KG: REVENUE SHARE, BY REGION, 2020 (%)
FIGURE 41.GARMIN LTD.: NET SALES, 2018-2020 ($MILLION)
FIGURE 42.GARMIN LTD.: REVENUE SHARE, BY SEGMENT, 2020 (%)
FIGURE 43.GARMIN LTD.: REVENUE SHARE, BY REGION, 2020 (%)
FIGURE 44.GENERAL ELECTRIC: NET SALES, 2018-2020 ($MILLION)
FIGURE 45.GENERAL ELECTRIC: REVENUE SHARE, BY SEGMENT, 2020 (%)
FIGURE 46.GENERAL ELECTRIC: REVENUE SHARE, BY REGION, 2020 (%)
FIGURE 47.IBM CORPORATION: NET SALES, 2018-2020 ($MILLION)
FIGURE 48.IBM CORPORATION: REVENUE SHARE, BY SEGMENT, 2020 (%)
FIGURE 49.IBM CORPORATION: REVENUE SHARE, BY REGION, 2020 (%)
FIGURE 50.NOKIA CORPORATION (ALCATEL-LUCENT S.A.): NET SALES, 2018-2020 ($MILLION)
FIGURE 51.NOKIA CORPORATION (ALCATEL-LUCENT S.A.): REVENUE SHARE, BY SEGMENT, 2020 (%)
FIGURE 52.NOKIA CORPORATION (ALCATEL-LUCENT S.A.): REVENUE SHARE, BY REGION, 2020 (%)
FIGURE 53.THALES GROUP: NET SALES, 2018-2020 ($MILLION)
FIGURE 54.THALES GROUP: REVENUE SHARE, BY SEGMENT, 2020 (%)
FIGURE 55.THALES GROUP: REVENUE SHARE, BY REGION, 2020 (%)
FIGURE 56.TOMTOM INTERNATIONAL BV.: NET SALES, 2018-2020 ($MILLION)
FIGURE 57.TOMTOM INTERNATIONAL BV.: REVENUE SHARE, BY SEGMENT, 2020 (%)
FIGURE 58.TOMTOM INTERNATIONAL BV.: REVENUE SHARE, BY REGION, 2020 (%)
FIGURE 59.VERIZON: NET SALES, 2018-2020 ($MILLION)
FIGURE 60.VERIZON: REVENUE SHARE, BY SEGMENT, 2020 (%)
FIGURE 61.VERIZON: REVENUE SHARE, BY REGION, 2020 (%)


The Internet of things (IoT) is a network of embedded computer devices, data, and things that are uniquely integrated in current internet infrastructure. It has also enabled creation of a web of communicative networks between humans and machines, which is projected to improve capacity to govern infrastructures such as smart/intelligent transportation, smart cities, smart grids, smart homes, and others. In addition, application of IoT in the transportation industry provides high security and standards, as well as other social and economic benefits.

Key providers of the IoT in transportation market such as AT&T Intellectual Property, Cisco system, Inc., and Nokia Corporation account for a significant share in the market. Various companies are partnering to increase the IoT capabilities with the larger requirement. For instance, in March 2021, Nokia has signed a reseller agreement with ClearWorld, an alternative energy systems provider to sell ClearWorlds smart poles initially to U.S. cities and military bases as part of Nokia’s smart city solutions portfolio. Deployed in locations such as parks, parking lots, and roadways, the ClearWorld connected digital pole supports applications such as video analytics, Wi-Fi access points, gunshot detection, smart lighting, and license plate reading. Partnership with ClearWorld for smart poles enables Nokia to be a comprehensive solution provider of smart urban infrastructure solutions for cities.

In addition to the increase in demand for weather forecasting services, various companies are expanding their current services to continue with the rise in demand. For instance, in March 2021, Thales launched its first ever digital event dedicated to rail transport, the “Smart Mobilty Experience”. This event will be the occasion for clients and partners of the rail ecosystem to discover new products and major innovations, as well as to exchange about digitalization and the future of rail. In addition, Thales is offering solutions to transport passengers safely and with best possible experience, supervises operations with accurate situation awareness, and optimizes transport service efficiency. Using digital technologies such as IoT, 5G, cloud & web IT, data analytics & AI, Thales designs innovative solutions such as digital signaling, train autonomy, mobile ticketing, passenger flow analytics, data driven operation control, smart maintenance, which drastically impacts the way people travel.

Furthermore, market players are expanding their business operations and customers by increasing partnership and collaborative operations. For instance, in July 2021, Microsoft announced to acquire AT&T’s Network Cloud technology and intellectual property, as well as making job offers to several hundred AT&T engineers. In return, AT&T will move its 5G mobile network to Azure. The companies will start with AT&T’s 5G core, and expand from there.

PURCHASE OPTIONS

Call or Email us

U.S.-Canada Toll-free: +1-800-792-5285
Int'l : +1-503-894-6022
Europe : +44-845-528-1300
Email : help@alliedmarketresearch.com

Looking for Customization?

 Customization Request

Have a Question?

 Speak with Analyst

Any Confusion?

 Inquire Before Buying

Have a glance of the Report

  Request Sample
RELATED TAGS

Purchase Full Report of
Iot In Transportation Market

Start reading instantly.
This Report and over 67,404+ more Reports, Available with Avenue Library. T&C*.

  • Online Only
  • $3,713
  • Online cloud access only
  • Restricted print, copy, paste & download
  • Read only
  • Free industry update
    (Within 180 days)
  • Free report update in next update cycle
    (Feb 2023 - Feb 2024)
  • Data Pack
  • $4,126
  • Restricted to one authorized user
  • One print only
  • Available in
    Excel
  • Free industry update
    (Within 180 days)
  •   Free report update in next update cycle
    (Feb 2023 - Feb 2024)
  • Single User
  • $5,770
  • Restricted to one authorized user
  • One print only
  • Available in
    PDF
  • Free industry update
    (Within 180 days)
  •   Free report update in next update cycle
    (Feb 2023 - Feb 2024)
  • Five Users
  • $6,930
  • Limited to five authorized users
  • Print upto five copies
  • Available in
    PDF
  • Free industry update
    (Within 180 days)
  •   Free report update in next update cycle
    (Feb 2023 - Feb 2024)
  • Enterprise
    License/PDF

  • $10,665
  • Unlimited
    within
    company/enterprise
  • Available in Excel & PDF
  • Free industry update
    (Within 180 days)
  •   Free report update in next update cycle
    (Feb 2023 - Feb 2024)
  • Library
    Membership

  • $999 $ 1,175
    Per User/ Per month/ Billed annually
  • Published Content
    E-access
  • Company Profiles
    E-access
  • Newly Added Content Access
  • 10 PDF
    Downloads
  • 5 Excel Data
    Pack Downloads
  • 250 Company Profiles PDF Downloads
  • Buy Now

*Taxes/Fees, if applicable will be added during checkout. All prices in USD

RELATED REPORTS
 

Why Allied Market Research?


Infallible Methodology

To ensure high-level data integrity, accurate analysis, and impeccable forecasts

Analyst Support

For complete satisfaction

Customization

On-demand customization of scope of the report to exactly meet your needs

TARGETED MARKET VIEW

Targeted market view to provide pertinent information and save time of readers

Get fresh content delivered

Get insights on topics that are crucial for your business. Stay abreast of your interest areas.

Get Industry Data Alerts

Why Allied Market Research?

Infallible Methodology

To ensure high-level data integrity, accurate analysis, and impeccable forecasts

Analyst Support

For complete satisfaction

Customization

On-demand customization of scope of the report to exactly meet your needs

TARGETED MARKET VIEW

Targeted market view to provide pertinent information and save time of readers