Report Code: A00724 | Feb 2017 | Pages: 240 | ||
Tables: 74 | Charts: 79 |
|
Pandemic disrupted the entire world and affected many industries.
Get detailed COVID-19 impact analysis on the Medical Videoscope Market
Request Now !Global Medical Videoscope Market was valued at $17,927 million in 2015, and is expected to reach $27,202 million by 2022, supported by a CAGR of 5.9% during the forecast period 2016 - 2022. A medical videoscope is an illuminated, optical instrument used to screen and execute diagnostic interventions inside hollow cavities and visceral organs of the body, such as the brain, esophagus, lungs, abdomen, gastrointestinal (GI) tract, and others. Medical conditions such as abdominal pain, ulcers, digestive tract bleeding, abnormal growth in the colon, and other abdominal & gastrointestinal diseases can be diagnosed through endoscopy. The demand for medical videoscopes has increased significantly owing to the increasing preference for minimally invasive surgeries. Moreover, not only being minimal invasive, endoscopic procedures are cost-effective compared to other open surgeries, especially in terms of pre- and post-operational costs and length of stay at hospitals and clinics.
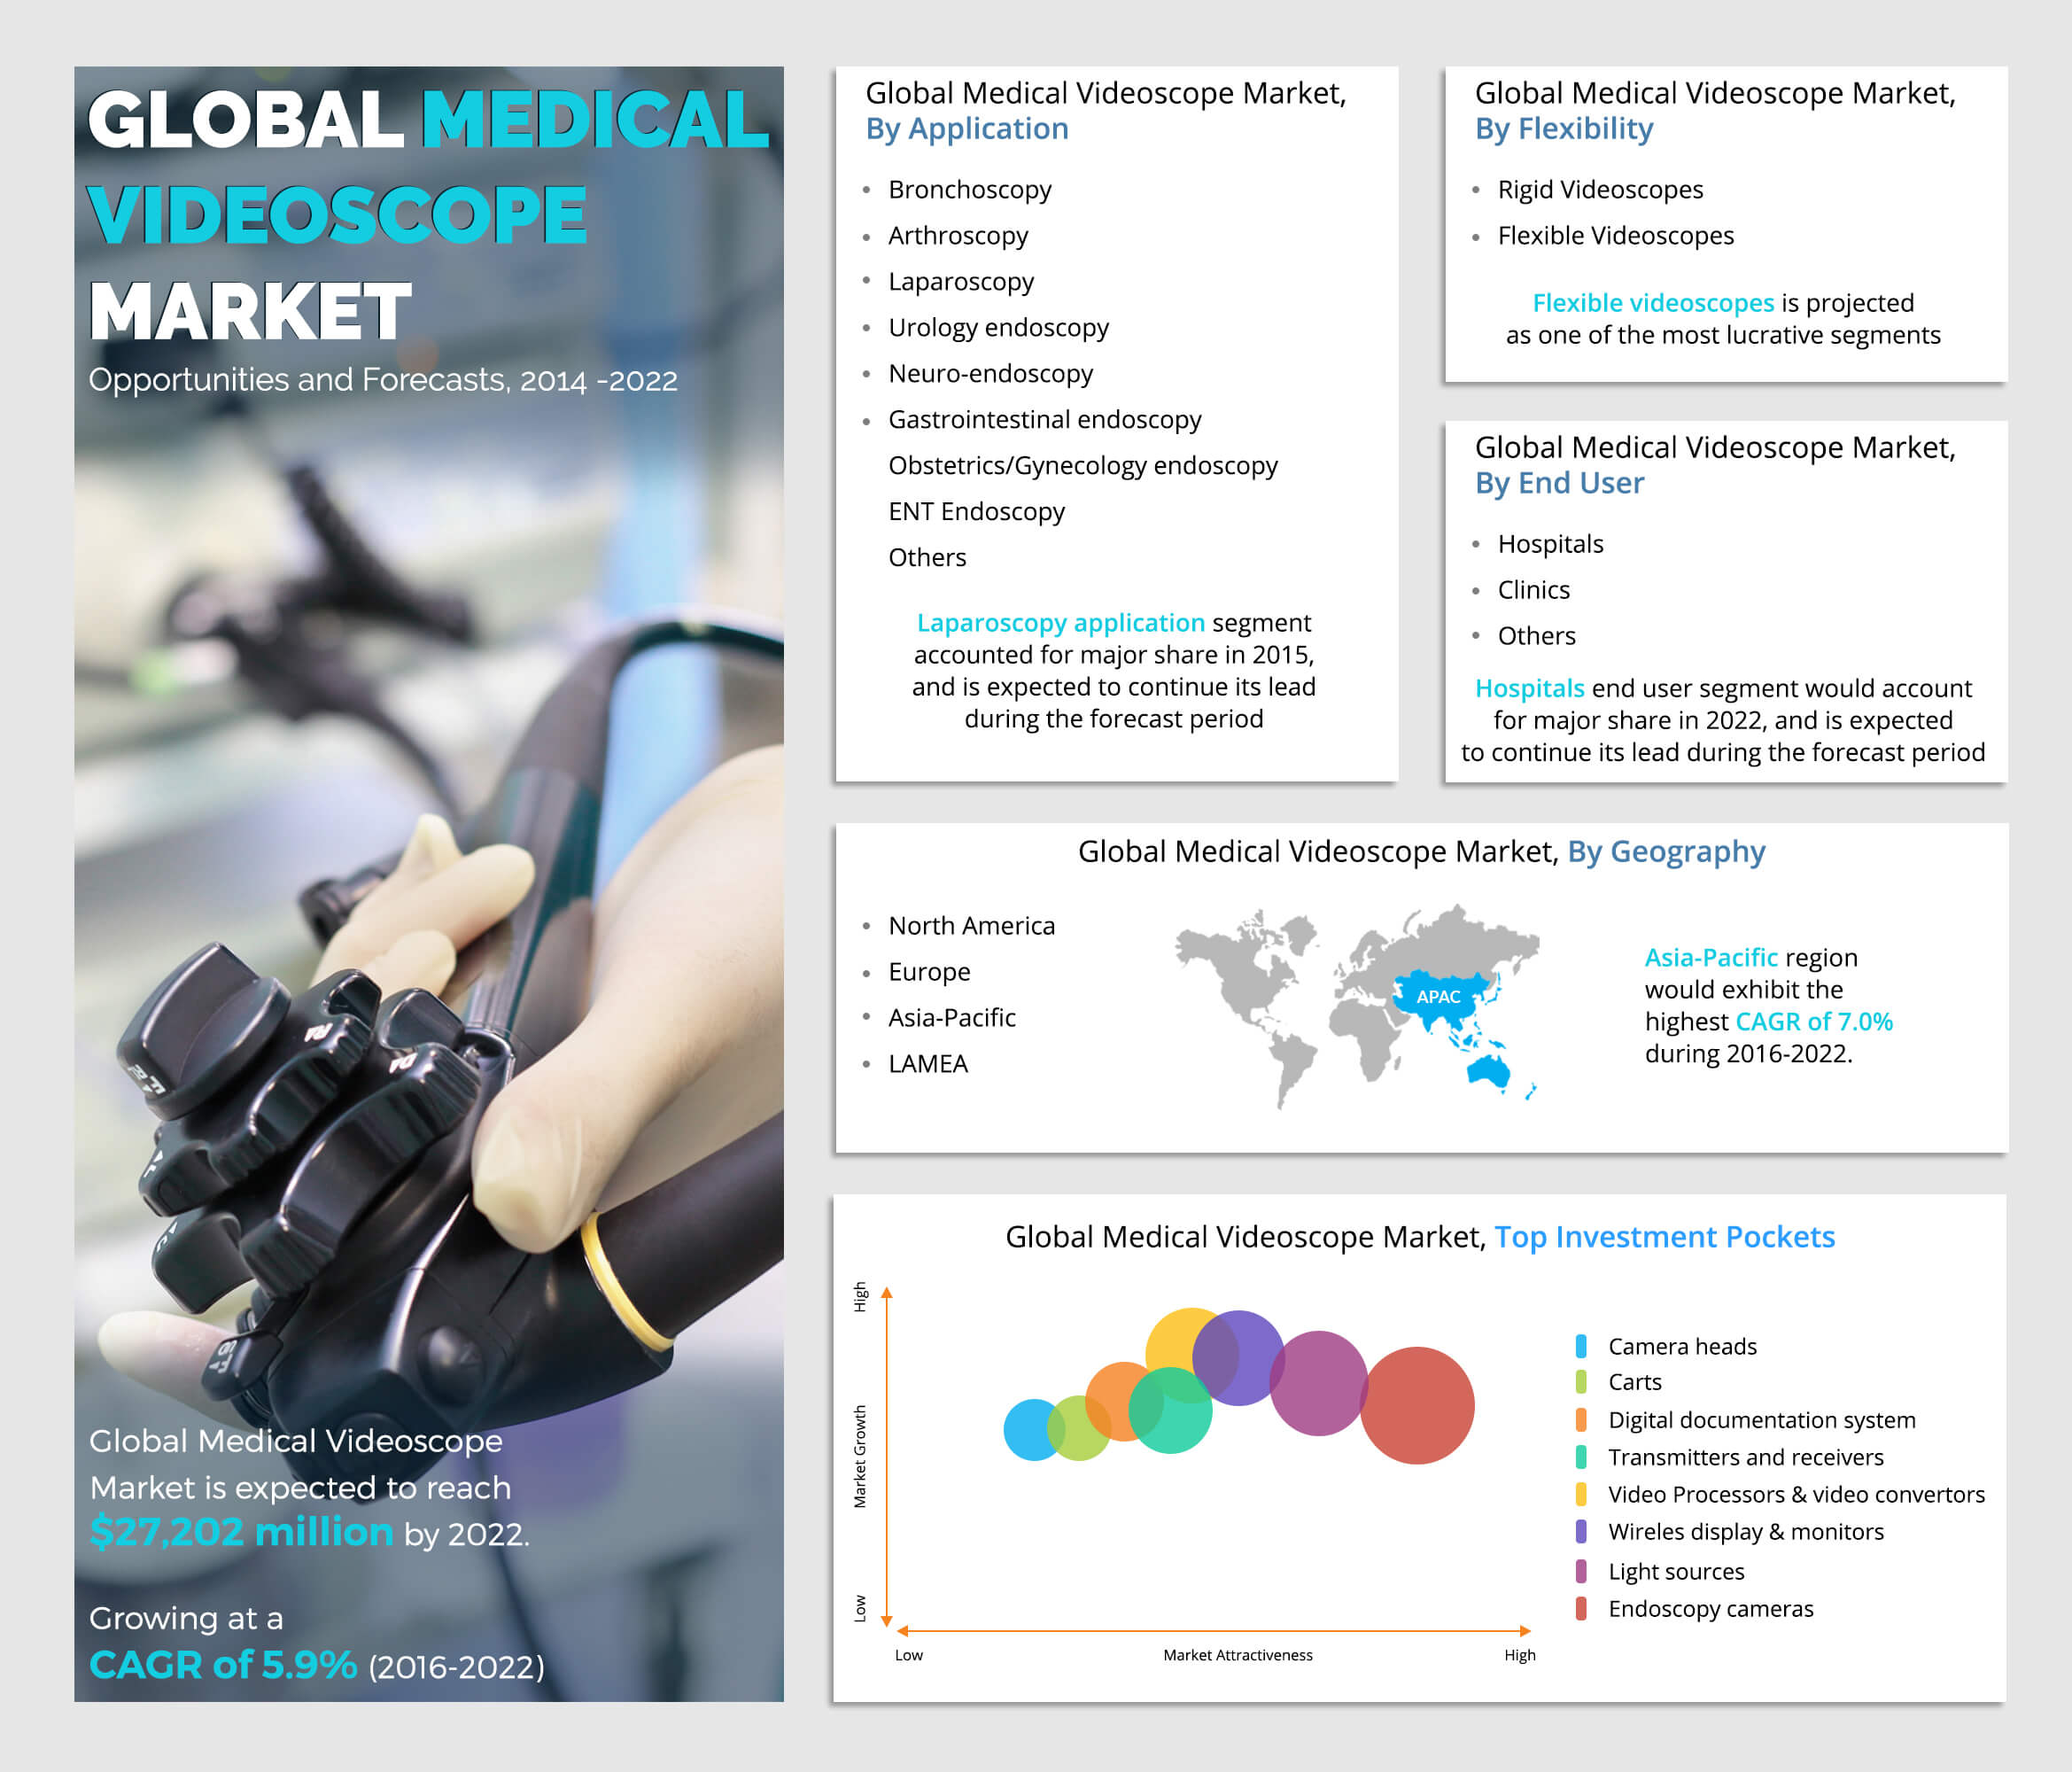
The medical videoscope market is segmented based on product type, application, end user, and geography. Based on product type, the market is bifurcated into videoscopes and visualization & documentation systems. The videoscope segment is segregated into videoscopy devices, capsule endoscopy, and robot-assisted endoscopy. In visualization & documentation system segment, endoscopy cameras occupied dominant share in 2015, and is expected to maintain this trend during the forecast period. This is attributed to the advanced imaging technologies such as ultrahigh-definition, 4-light emitting diode (LED) multi-light, and multi-zoom technology incorporated in endoscopy cameras.
Top investment pockets
Endoscopy cameras and light sources are the potential target areas for investment by the key players in the medical videoscope market, due to technological innovations in these devices. The endoscopy camera segment is poised to grow at a CAGR of 5.4% during the forecast period, owing to advanced imaging features offered by these cameras.
Top winning strategies
The key players adopted acquisition, expansion, product development, and agreement as their business strategies to sustain competition and increase their market share.
The key players operating in the global medical videoscope market include Conmed Corporation, Fujifilm Holdings Corporation, HOYA Corporation (Pentax Medical), KARL STORZ GmbH & Co. KG, Olympus Corporation, Richard Wolf GmbH, Smith & Nephew, Plc, Stryker Corporation, Hill Rom Holding, Inc. (Welch Allen, Inc.), and XION GmbH.
Other prominent players in the value chain include B. Braun Melsungen AG, Cook Medical, Arthrex Inc., Frontier Healthcare, Minntech Corporation (Subsidiary of Cantel Medical Corp.), Advanced Sterilization Products Services Inc., Medtronic Plc, STERIS Corporation, Siemens Healthcare, and US Endoscopy Group.
CHAPTER 1 INTRODUCTION
1.1. REPORT DESCRIPTION
1.2. KEY BENEFITS
1.3. KEY MARKET SEGMENTS
1.4. RESEARCH METHODOLOGY
1.4.1. Secondary research
1.4.2. Primary research
1.4.3. Analyst tools & models
CHAPTER 2 EXECUTIVE SUMMARY
2.1. CXO PERSPECTIVE
CHAPTER 3 MARKET OVERVIEW
3.1. MARKET DEFINITION AND SCOPE
3.2. KEY FINDINGS
3.2.1. Top investment pockets
3.2.2. Top winning strategies
3.3. PORTER’S FIVE FORCES ANALYSIS
3.4. REGULATION AND REIMBURSEMENT SCENARIO
3.5. MARKET DYNAMICS
3.5.1. Drivers
3.5.1.1. Innovation in medical videoscope
3.5.1.2. Rise in targeted disease and growth in geriatric population
3.5.1.3. Surge in preference for minimally invasive surgeries
3.5.2. Restraints
3.5.2.1. Lack of skilled professionals
3.5.2.2. High costs associated with medical videoscope
3.5.3. Opportunities
3.5.3.1. Unmet medical demands in developing countries
CHAPTER 4 MEDICAL VIDEOSCOPE MARKET, BY PRODUCT, 2014-2022, $MILLION
4.1. OVERVIEW
4.1.1. Market size and forecast
4.2. VIDEOSCOPES
4.2.1. Key market trends
4.2.2. Growth factors and opportunities
4.2.3. Market size and forecast
4.2.4. Videoscopy devices
4.2.4.1. Videoscopy devices, by flexibility
4.2.4.2. Market size and forecast
4.2.4.2.1. Flexible videoscopes
4.2.4.2.1.1. Market size and forecast
4.2.4.2.2. Rigid videoscopes
4.2.4.2.2.1. Market size and forecast
4.2.4.3. Videoscopy Devices, by type
4.2.4.3.1. Market size and forecast
4.2.4.3.2. Cystoscopes
4.2.4.3.2.1. Market size and forecast
4.2.4.3.3. Neuroendoscopes
4.2.4.3.3.1. Market size and forecast
4.2.4.3.4. Urology endoscopes
4.2.4.3.4.1. Market size and forecast
4.2.4.3.5. Arthroscopes
4.2.4.3.5.1. Market size and forecast
4.2.4.3.6. Laparoscopes
4.2.4.3.6.1. Market size and forecast
4.2.4.3.7. Obstetrics/Gynecological (OB/GN) endoscope
4.2.4.3.7.1. Market size and forecast
4.2.4.3.8. Otoscopes
4.2.4.3.8.1. Market size and forecast
4.2.4.3.9. Laryngoscopes
4.2.4.3.9.1. Market size and forecast
4.2.4.3.10. Nasopharyngoscopes
4.2.4.3.10.1. Market size and forecast
4.2.4.3.11. Rhinoscopes
4.2.4.3.11.1. Market size and forecast
4.2.4.3.12. Gastroscopes
4.2.4.3.12.1. Market size and forecast
4.2.4.3.13. Colonoscopes
4.2.4.3.13.1. Market size and forecast
4.2.4.3.14. Bronchoscopes
4.2.4.3.14.1. Market size and forecast
4.2.4.3.15. Duodenoscopes
4.2.4.3.15.1. Market size and forecast
4.2.4.3.16. Sigmoidoscopes
4.2.4.3.16.1. Market size and forecast
4.2.4.3.17. Other endoscopes
4.2.4.3.17.1. Market size and forecast
4.2.5. Capsule endoscopy
4.2.5.1. Market size and forecast
4.2.6. Robot-assisted endoscopy
4.2.6.1. Market size and forecast
4.3. VISUALIZATION AND DOCUMENTATION SYSTEMS
4.3.1. Key market trends
4.3.2. Key growth factors and opportunities
4.3.3. Market size and forecast
4.3.4. Light sources
4.3.4.1. Market size and forecast
4.3.5. Camera heads
4.3.5.1. Market size and forecast
4.3.6. Wireless display and monitors
4.3.6.1. Market size and forecast
4.3.7. Endoscopy cameras
4.3.7.1. Market size and forecast
4.3.8. Endoscopy Carts
4.3.8.1. Market size and forecast
4.3.9. Digital documentation systems
4.3.9.1. Market size and forecast
4.3.10. Video processors and video convertors
4.3.10.1. Market size and forecast
4.3.11. Transmitters and receivers
4.3.11.1. Market size and forecast
4.3.12. Others (printers, digital capture systems, recorders, couplers & splitters, and others)
4.3.12.1. Market size and forecast
CHAPTER 5 MEDICAL VIDEOSCOPE MARKET, BY APPLICATION, 2014-2022, $MILLION
5.1. OVERVIEW
5.1.1. Market size and forecast
5.2. BRONCHOSCOPY
5.2.1. Market size and forecast
5.3. ARTHROSCOPY
5.3.1. Market size and forecast
5.4. LAPAROSCOPY
5.4.1. Market size and forecast
5.5. UROLOGY ENDOSCOPY
5.5.1. Market size and forecast
5.6. NEURO-ENDOSCOPY
5.6.1. Market size and forecast
5.7. GASTROINTESTINAL ENDOSCOPY
5.7.1. Market size and forecast
5.8. OBSTETRICS/GYNECOLOGY ENDOSCOPY
5.8.1. Market size and forecast
5.9. ENT ENDOSCOPY
5.9.1. Market size and forecast
5.10. OTHER VIDEOSCOPY APPLICATIONS
5.10.1. Market size and forecast
CHAPTER 6 MEDICAL VIDEOSCOPE MARKET, BY END USER, 2014-2022, $MILLION
6.1. OVERVIEW
6.1.1. Market size and forecast
6.2. HOSPITALS
6.2.1. Market size and forecast
6.3. CLINICS
6.3.1. Market size and forecast
6.4. OTHERS
6.4.1. Market size and forecast
CHAPTER 7 MEDICAL VIDEOSCOPE MARKET, BY GEOGRAPHY, 2014-2022, $MILLION
7.1. OVERVIEW
7.1.1. Market size and forecast
7.2. NORTH AMERICA
7.2.1. Key market trends
7.2.2. Key growth factors and opportunities
7.2.3. Market size and forecast
7.2.3.1. U.S. market size and forecast
7.2.3.2. Mexico market size and forecast
7.2.3.3. Canada market size and forecast
7.3. EUROPE
7.3.1. Key market trends
7.3.2. Key growth factors and opportunities
7.3.3. Market size and forecast
7.3.3.1. UK market size and forecast
7.3.3.2. France market size and forecast
7.3.3.3. Germany market size and forecast
7.3.3.4. Rest of Europe market size and forecast
7.4. ASIA-PACIFIC
7.4.1. Key market trends
7.4.2. Key growth factors and opportunities
7.4.3. Market size and forecast
7.4.3.1. Japan market size and forecast
7.4.3.2. China market size and forecast
7.4.3.3. Australia market size and forecast
7.4.3.4. India market size and forecast
7.4.3.5. Rest of Asia-Pacific market size and forecast
7.5. LAMEA
7.5.1. Key market trends
7.5.2. Key growth factors and opportunities
7.5.3. Market size and forecast
7.5.3.1. Brazil market size and forecast
7.5.3.2. Saudi Arabia market size and forecast
7.5.3.3. South Africa market size and forecast
7.5.3.4. Rest of LAMEA market size and forecast
CHAPTER 8 COMPANY PROFILES
8.1. CONMED CORPORATION
8.1.1. Company overview
8.1.2. Operating business segments
8.1.3. Business performance
8.1.4. Key strategic moves and developments
8.2. FUJIFILM HOLDING CORPORATION
8.2.1. Company overview
8.2.2. Operating business segment
8.2.3. Business performance
8.2.4. Key strategic moves and developments
8.3. HOYA CORPORATION (PENTAX MEDICAL)
8.3.1. Company overview
8.3.2. Operating business segments
8.3.3. Business performance
8.3.4. Key strategic moves and developments
8.4. KARL STORZ GMBH & CO. KG
8.4.1. Company overview
8.4.2. Operating business segments
8.4.3. Business performance
8.4.4. Key strategic moves and developments
8.5. OLYMPUS CORPORATION
8.5.1. Company overview
8.5.2. Operating business segments
8.5.3. Business performance
8.5.4. Key strategic moves and developments
8.6. RICHARD WOLF GMBH
8.6.1. Company overview
8.6.2. Operating business segments
8.6.3. Business performance
8.6.4. Key strategic moves and developments
8.7. SMITH & NEPHEW PLC.
8.7.1. Company overview
8.7.2. Operating business segments
8.7.3. Business performance
8.8. STRYKER CORPORATION
8.8.1. Company overview
8.8.2. Operating business segments
8.8.3. Business performance
8.8.4. Key strategic moves and developments
8.9. HILL ROM HOLDING INC. (WELCH ALLYN, INC.)
8.9.1. Company overview
8.9.2. Operating business segments
8.9.3. Business performance
8.9.4. Key strategic moves and developments
8.10. XION GMBH
8.10.1. Company overview
8.10.2. Operating business segments
8.10.3. Business performance
8.10.4. Key strategic moves and developments
 LIST OF TABLES
TABLE 1. COOK MEDICAL’S CPT CODE ENDOSCOPY TECHNOLOGIES
TABLE 2. GLOBAL MEDICAL VIDEOSCOPE MARKET, BY PRODUCT, 2014-2022 ($MILLION)
TABLE 3. WORLD VIDEOSCOPE MARKET, BY PRODUCT TYPE 2014-2022 ($MILLION)
TABLE 4. VIDEOSCOPY DEVICES MARKET, BY FLEXIBILITY, 2014-2022 ($MILLION)
TABLE 5. ENDOSCOPY DEVICES MARKET, BY TYPE, 2014-2022 ($MILLION)
TABLE 6. CAPSULE ENDOSCOPY DEVICES MARKET, BY REGION, 2014-2022 ($MILLION)
TABLE 7. ROBOT ASSISTED ENDOSCOPY DEVICES MARKET, 2014-2022 ($MILLION)
TABLE 8. VISUALIZATION AND DOCUMENTATION SYSTEMS MARKET, BY TYPE, 2014-2022 ($MILLION)
TABLE 9. MEDICAL VIDEOSCOPE MARKET, BY APPLICATION, 2014-2022 ($MILLION)
TABLE 10. BRONCHOSCOPY MARKET, BY REGION, 2014-2022 ($MILLION)
TABLE 11. ARTHROSCOPY MARKET, BY REGION, 2014-2022 ($MILLION)
TABLE 12. LAPAROSCOPY MARKET, BY REGION, 2014-2022 ($MILLION)
TABLE 13. UROLOGY ENDOSCOPY MARKET, BY REGION, 2014-2022 ($MILLION)
TABLE 14. NEURO-ENDOSCOPY DEVICES MARKET, BY REGION, 2014-2022 ($MILLION)
TABLE 15. GASTROINTESTINAL ENDOSCOPY MARKET, BY REGION, 2014-2022 ($MILLION)
TABLE 16. OBSTERICS/GYNECOLOGY ENDOSCOPY DEVICES MARKET, BY REGION, 2014-2022 ($MILLION)
TABLE 17. ENT ENDOSCOPY DEVICES MARKET, BY REGION, 2014-2022 ($MILLION)
TABLE 18. OTHER ENDOSCOPY DEVICES APPLICATIONS MARKET, BY REGION, 2014-2022 ($MILLION)
TABLE 19. MEDICAL VIDEOSCOPE MARKET, BY END USER, 2014-2022 ($MILLION)
TABLE 20. HOSPITALS MEDICAL VIDEOSCOPE MARKET, BY REGION, 2014-2022 ($MILLION)
TABLE 21. CLINICS MEDICAL VIDEOSCOPE MARKET, BY REGION, 2014-2022 ($MILLION)
TABLE 22. OTHER END USER MEDICAL VIDEOSCOPE MARKET, BY REGION, 2014-2022 ($MILLION)
TABLE 23. GLOBAL MEDICAL VIDEOSCOPE MARKET, BY REGION, 2014-2022 ($MILLION)
TABLE 24. NORTH AMERICA MEDICAL VIDEOSCOPE MARKET, BY COUNTRY, 2014-2022 ($MILLION)
TABLE 25. NORTH AMERICA MEDICAL VIDEOSCOPE MARKET, BY PRODUCT, 2014-2022 ($MILLION)
TABLE 26. NORTH AMERICA VIDEOSCOPE MARKET, BY PRODUCT TYPE, 2014-2022 ($MILLION)
TABLE 27. NORTH AMERICA VIDEOSCOPY DEVICES MARKET, BY FLEXIBILITY, 2014-2022 ($MILLION)
TABLE 28. NORTH AMERICA VIDEOSCOPY DEVICES MARKET, BY TYPE, 2014-2022 ($MILLION)
TABLE 29. NORTH AMERICA VISUALIZATION AND DOCUMENTATION SYSTEMS MARKET, BY TYPE, 2014-2022 ($MILLION)
TABLE 30. NORTH AMERICA MEDICAL VIDEOSCOPE MARKET, BY APPLICATION, 2014-2022 ($MILLION)
TABLE 31. NORTH AMERICA MEDICAL VIDEOSCOPE MARKET, BY END USER, 2014-2022 ($MILLION)
TABLE 32. EUROPE MEDICAL VIDEOSCOPE MARKET, BY COUNTRY, 2014-2022 ($MILLION)
TABLE 33. EUROPE MEDICAL VIDEOSCOPE MARKET, BY PRODUCT, 2014-2022 ($MILLION)
TABLE 34. EUROPE VIDEOSCOPE MARKET, BY PRODUCT TYPE, 2014-2022 ($MILLION)
TABLE 35. EUROPE VIDEOSCOPY DEVICES MARKET, BY FLEXIBILITY, 2014-2022 ($MILLION)
TABLE 36. EUROPE VIDEOSCOPY DEVICES MARKET, BY TYPE, 2014-2022 ($MILLION)
TABLE 37. EUROPE VISUALIZATION AND DOCUMENTATION SYSTEMS MARKET, BY TYPE, 2014-2022 ($MILLION)
TABLE 38. EUROPE MEDICAL VIDEOSCOPE MARKET, BY APPLICATION, 2014-2022 ($MILLION)
TABLE 39. EUROPE MEDICAL VIDEOSCOPE MARKET, BY END USER, 2014-2022 ($MILLION)
TABLE 40. ASIA-PACIFIC MEDICAL VIDEOSCOPE MARKET, BY COUNTRY, 2014-2022 ($MILLION)
TABLE 41. ASIA-PACIFIC MEDICAL VIDEOSCOPE MARKET, BY PRODUCT, 2014-2022 ($MILLION)
TABLE 42. ASIA-PACIFIC VIDEOSCOPE MARKET, BY PRODUCT TYPE, 2014-2022 ($MILLION)
TABLE 43. ASIA-PACIFIC VIDEOSCOPY DEVICES MARKET, BY FLEXIBILITY, 2014-2022 ($MILLION)
TABLE 44. ASIA_PACIFIC VIDEOSCOPY DEVICES MARKET, BY TYPE, 2014-2022 ($MILLION)
TABLE 45. ASIA-PACIFIC VISUALIZATION AND DOCUMENTATION SYSTEMS MARKET, BY TYPE, 2014-2022 ($MILLION)
TABLE 46. ASIA-PACIFIC MEDICAL VIDEOSCOPE MARKET, BY APPLICATION, 2014-2022 ($MILLION)
TABLE 47. ASIA-PACIFIC MEDICAL VIDEOSCOPE MARKET, BY END USER, 2014-2022 ($MILLION)
TABLE 48. LAMEA MEDICAL VIDEOSCOPE MARKET, BY COUNTRY, 2014-2022 ($MILLION)
TABLE 49. LAMEA MEDICAL VIDEOSCOPE MARKET, BY PRODUCT, 2014-2022 ($MILLION)
TABLE 50. LAMEA VIDEOSCOPE MARKET, BY PRODUCT TYPE, 2014-2022 ($MILLION)
TABLE 51. LAMEA VIDEOSCOPY DEVICES MARKET, BY FLEXIBILITY, 2014-2022 ($MILLION)
TABLE 52. LAMEA VIDEOSCOPY DEVICES MARKET, BY TYPE, 2014-2022 ($MILLION)
TABLE 53. LAMEA VISUALIZATION AND DOCUMENTATION SYSTEMS MARKET, BY TYPE, 2014-2022 ($MILLION)
TABLE 54. LAMEA MEDICAL VIDEOSCOPE MARKET, BY APPLICATION, 2014-2022 ($MILLION)
TABLE 55. LAMEA MEDICAL VIDEOSCOPE MARKET, BY END USER, 2014-2022 ($MILLION)
TABLE 56. CONMED: COMPANY SNAPSHOT
TABLE 57. CONMED: OPERATING SEGMENTS
TABLE 58. FUJIFILM: COMPANY SNAPSHOT
TABLE 59. FUJIFILM: OPERATING SEGMENTS
TABLE 60. HOYA: COMPANY SNAPSHOT
TABLE 61. HOYA: OPERATING SEGMENTS
TABLE 62. KARL STORZ: COMPANY SNAPSHOT
TABLE 63. KARL STORZ: OPERATING SEGMENTS
TABLE 64. OLYMPUS: COMPANY SNAPSHOT
TABLE 65. OLYMPUS: OPERATING SEGMENTS
TABLE 66. RICHARD WOLF: COMPANY SNAPSHOT
TABLE 67. GIGYA INC.: OPERATING SEGMENTS
TABLE 68. SMITH & NEPHEW: COMPANY SNAPSHOT
TABLE 69. STRYKER: COMPANY SNAPSHOT
TABLE 70. STRYKER: OPERATING SEGMENTS
TABLE 71. HILL ROM: COMPANY SNAPSHOT
TABLE 72. HILL ROM: OPERATING SEGMENTS
TABLE 73. XION GMBH: COMPANY SNAPSHOT
TABLE 74. XION GMBH: OPERATING SEGMENTS
 LIST OF FIGURES
FIGURE 1. SUMMARY SNAPSHOT FOR GLOBAL MEDICAL VIDEOSCOPE MARKET
FIGURE 2. GEOGRAPHY SNAPSHOT FOR GLOBAL MEDICAL VIDEOSCOPE MARKET
FIGURE 3. MEDICAL VIDEOSCOPE MARKET SEGMENTATION
FIGURE 4. TOP INVESTMENT POCKETS IN GLOBAL MEDICAL VIDEOSCOPE MARKET
FIGURE 5. TOP WINNING STRATEGIES: PERCENTAGE DISTRIBUTION (2014-2016)
FIGURE 6. TOP WINNING STRATEGIES: NATURE AND TYPE
FIGURE 7. TOP WINNING STRATEGIES: NATURE AND COMPANY
FIGURE 8. BARGAINING POWER OF BUYERS
FIGURE 9. BARGAINING POWER OF SUPPLIERS
FIGURE 10. THREAT OF NEW ENTRANTS
FIGURE 11. THREAT OF SUBSTITUTION
FIGURE 12. COMPETITIVE RIVALRY
FIGURE 13. RESTRAINTS AND DRIVERS: GLOBAL ENDOSCOPY DEVICES MARKET
FIGURE 14. ELDERLY POPULATION (AGED 65 YEARS AND ABOVE), BY REGION, 2015, 2030, AND 2050 (MILLION)
FIGURE 15. MEDICAL VIDEOSCOPE MARKET: PRODUCT SEGMENTATION
FIGURE 16. FLEXIBLE VIDEOSCOPES MARKET, 2014-2022 ($MILLION)
FIGURE 17. RIGID VIDEOSCOPES MARKET, 2014-2022 ($MILLION)
FIGURE 18. CYSTOSCOPES MARKET, 2014-2022 ($MILLION)
FIGURE 19. NEUROENDOSCOPES MARKET, 2014-2022 ($MILLION)
FIGURE 20. UROLOGY ENDOSCOPES MARKET, 2014-2022 ($MILLION)
FIGURE 21. ARTHROSCOPES MARKET, 2014-2022 ($MILLION)
FIGURE 22. LAPAROSCOPES MARKET, 2014-2022 ($MILLION)
FIGURE 23. OBSTETRICS/GYNECOLOGICAL (OB/GN) ENDOSCOPE MARKET, 2014-2022 ($MILLION)
FIGURE 24. OTOSCOPES MARKET, 2014-2022 ($MILLION)
FIGURE 25. LARYNGOSCOPES MARKET, 2014-2022 ($MILLION)
FIGURE 26. NASOPHARYNGOSCOPES MARKET, 2014-2022 ($MILLION)
FIGURE 27. RHINOSCOPES MARKET, 2014-2022 ($MILLION)
FIGURE 28. GASTROSCOPES MARKET, 2014-2022 ($MILLION)
FIGURE 29. COLONOSCOPES MARKET, 2014-2022 ($MILLION)
FIGURE 30. BRONCHOSCOPES MARKET, 2014-2022 ($MILLION)
FIGURE 31. DUODENOSCOPES MARKET, 2014-2022 ($MILLION)
FIGURE 32. SIGMOIDOSCOPES MARKET, 2014-2022 ($MILLION)
FIGURE 33. OTHER ENDOSCOPES MARKET, 2014-2022 ($MILLION)
FIGURE 34. LIGHT SOURCES VISUALIZATION AND DOCUMENTATION SYSTEMS MARKET, 2014-2022 ($MILLION)
FIGURE 35. CAMERA HEADS VISUALIZATION AND DOCUMENTATION SYSTEMS MARKET, 2014-2022 ($MILLION)
FIGURE 36. WIRELESS DISPLAY & MONITORS VISUALIZATION AND DOCUMENTATION SYSTEMS MARKET, 2014-2022 ($MILLION)
FIGURE 37. ENDOSCOPY CAMERAS VISUALIZATION AND DOCUMENTATION SYSTEMS MARKET, 2014-2022 ($MILLION)
FIGURE 38. ENDOSCOPY CARTS VISUALIZATION AND DOCUMENTATION SYSTEMS MARKET, 2014-2022 ($MILLION)
FIGURE 39. DIGITAL DOCUMENTATION VISUALIZATION AND DOCUMENTATION SYSTEMS MARKET, 2014-2022 ($MILLION)
FIGURE 40. VIDEO PROCESSORS & VIDEO CONVERTORS VISUALIZATION AND DOCUMENTATION SYSTEMS MARKET, 2014-2022 ($MILLION)
FIGURE 41. TRANSMITTERS & RECEIVERS VISUALIZATION AND DOCUMENTATION SYSTEMS MARKET FOR, 2014-2022 ($MILLION)
FIGURE 42. OTHER VISUALIZATION AND DOCUMENTATION SYSTEMS MARKET, 2014-2022 ($MILLION)
FIGURE 43. U.S. MEDICAL VIDEOSCOPE MARKET, 2014-2022 ($MILLION)
FIGURE 44. MEXICO MEDICAL VIDEOSCOPE MARKET, 2014-2022 ($MILLION)
FIGURE 45. CANADA MEDICAL VIDEOSCOPE MARKET, 2014-2022 ($MILLION)
FIGURE 46. UK MEDICAL VIDEOSCOPE MARKET, 2014-2022 ($MILLION)
FIGURE 47. FRANCE MEDICAL VIDEOSCOPE MARKET, 2014-2022 ($MILLION)
FIGURE 48. GERMANY MEDICAL VIDEOSCOPE MARKET, 2014-2022 ($MILLION)
FIGURE 49. REST OF EUROPE MEDICAL VIDEOSCOPE MARKET, 2014-2022 ($MILLION)
FIGURE 50. JAPAN MEDICAL VIDEOSCOPE MARKET, 2014-2022 ($MILLION)
FIGURE 51. CHINA MEDICAL VIDEOSCOPE MARKET, 2014-2022 ($MILLION)
FIGURE 52. AUSTRALIA MEDICAL VIDEOSCOPE MARKET, 2014-2022 ($MILLION)
FIGURE 53. INDIA MEDICAL VIDEOSCOPE MARKET, 2014-2022 ($MILLION)
FIGURE 54. REST OF ASIA-PACIFIC MEDICAL VIDEOSCOPE MARKET, 2014-2022 ($MILLION)
FIGURE 55. BRAZIL MEDICAL VIDEOSCOPE MARKET, 2014-2022 ($MILLION)
FIGURE 56. SAUDI ARABIA MEDICAL VIDEOSCOPE MARKET, 2014-2022 ($MILLION)
FIGURE 57. SOUTH AFRICA MEDICAL VIDEOSCOPE MARKET, 2014-2022 ($MILLION)
FIGURE 58. REST OF LAMEA MEDICAL VIDEOSCOPE MARKET, 2014-2022 ($MILLION)
FIGURE 59. CONMED: NET SALES, 2013-2015 ($MILLION)
FIGURE 60. CONMED: REVENUE BY PRODUCT, 2015 (%)
FIGURE 61. CONMED: REVENUE BY GEOGRAPHY, 2015 (%)
FIGURE 62. FUJIFILM: NET SALES, 2014-2016 ($MILLION)
FIGURE 63. FUJIFILM: NET SALES BY SEGMENT, 2016 (%)
FIGURE 64. FUJIFILM: NET SALES BY GEOGRAPHY, 2016 (%)
FIGURE 65. HOYA: REVENUE, 2014-2016 ($MILLION)
FIGURE 66. HOYA: REVENUE BY SEGMENT, 2016 (%)
FIGURE 67. HOYA: REVENUE BY GEOGRAPHY, 2016 (%)
FIGURE 68. OLYMPUS: REVENUE, 2014-2016 ($MILLION)
FIGURE 69. OLYMPUS: REVENUE BY SEGMENT, 2016 (%)
FIGURE 70. OLYMPUS: REVENUE BY GEOGRAPHY, 2016 (%)
FIGURE 71. SMITH & NEPHEW: REVENUE, 2013-2015 ($MILLION)
FIGURE 72. SMITH & NEPHEW: REVENUE BY PRODUCT, 2015 (%)
FIGURE 73. SMITH & NEPHEW: REVENUE BY GEOGRAPHY, 2015 (%)
FIGURE 74. STRYKER: REVENUE, 2013-2015 ($MILLION)
FIGURE 75. STRYKER: REVENUE BY SEGMENT, 2015 (%)
FIGURE 76. STRYKER: REVENUE BY GEOGRAPHY, 2015 (%)
FIGURE 77. HILL ROM: REVENUE, 2014-2016 ($MILLION)
FIGURE 78. HILL ROM: REVENUE BY SEGMENT, 2016 (%)
FIGURE 79. HILL ROM: REVENUE BY GEOGRAPHY, 2016 (%)
Medical videoscopes are expected to witness high adoption rate with increase in cases of varied diseases such as gastrointestinal diseases, colon cancers, and other targeted diseases. The medical videoscope market has gained momentum in the healthcare industry owing to its minimally invasive nature, shorter recovery time, and fewer post-operative complications coupled with lesser hospital stays. Wide use of laparoscopy, gastrointestinal endoscopy, arthroscopy, and ENT endoscopy; and advancements and major developments, such as devices with more throughput and accurate result, drive the market growth. The growth in need for non-invasive devices has increased the demand for innovative technologies and newer versions of endoscopy cameras incorporating advanced technology such as ultrahigh definition, 4-light emitting diode (LED) multi-light, and multi-zoom technology. These devices have become powerful diagnostic tools adopted for the visualization of visceral organs for chronic diseases such as cancer, gall bladder disease, and arthritis. Rise in incidence of gastrointestinal diseases has also contributed for the significant demand for medical videoscopes interventions worldwide.
However, dearth of skilled professionals and high costs associated with medical videoscope restrain the market growth. Currently, hospitals are the largest end users of medical videoscopes, followed by clinics, which are expected to exhibit the highest growth rate throughout the forecast period. However, the number of endoscopy procedures performed are higher in hospitals compared to clinics, as visualization and examination of visceral organs are majorly done in hospitals, which are well equipped with sophisticated videoscopy devices.
Increase in the number of targeted diseases coupled with growth in geriatric population fuels the demand for novel videoscopy devices such as capsule endoscopy and robot-assisted endoscopy, as it is the simple, efficient, minimally invasive, and more accessible approach for the diagnosis of diseases and indications. The employment of technologically advanced videoscopy products is highest in North America, owing to the increase in adoption of novel videoscopy devices, followed by Europe and Asia-Pacific.
Start reading instantly.
This Report and over 68,244+ more Reports, Available with Avenue Library. T&C*.
Enterprise
License/PDF
Library
Membership
*Taxes/Fees, if applicable will be added during checkout. All prices in USD
To ensure high-level data integrity, accurate analysis, and impeccable forecasts
For complete satisfaction
On-demand customization of scope of the report to exactly meet your needs
Targeted market view to provide pertinent information and save time of readers
Get insights on topics that are crucial for your business. Stay abreast of your interest areas.
Get Industry Data AlertsTo ensure high-level data integrity, accurate analysis, and impeccable forecasts
For complete satisfaction
On-demand customization of scope of the report to exactly meet your needs
Targeted market view to provide pertinent information and save time of readers