Report Code: A03385 | Aug 2018 | Pages: 166 | ||
Tables: 63 | Charts: 41 |
|
Pandemic disrupted the entire world and affected many industries.
Get detailed COVID-19 impact analysis on the Pegylated Protein Therapeutics Market
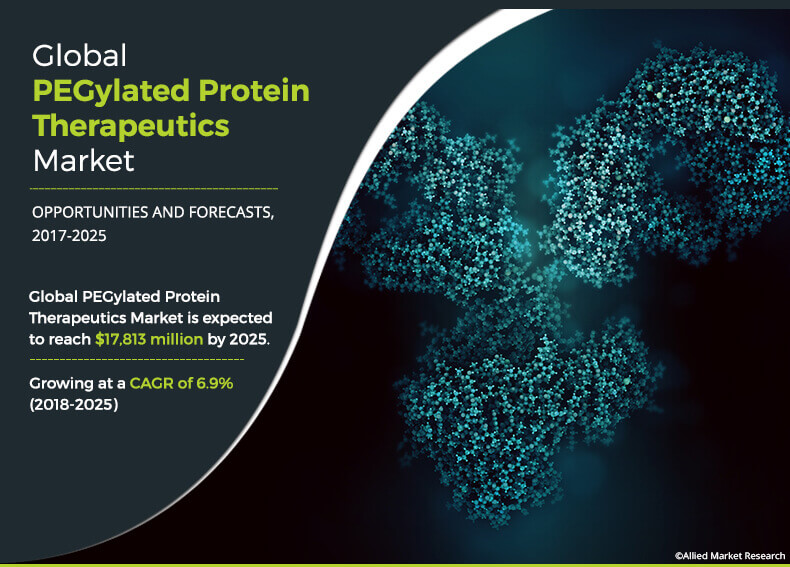
Request Now !The global PEGylated protein therapeutics market was valued at $10,388 million in 2017, and is estimated to reach at $17,813 million by 2025, registering a CAGR of 6.9% from 2018 to 2025.
PEGylation is the process of covalent and non-covalent attachment of polyethylene glycol polymer chains to molecules, such as a drug, therapeutic protein, or vesicle. PEGylated protein therapeutics is estimated to show significant market growth during the forecast period, majorly due to the, growth in demand for PEGylation, rise in number of chronic diseases, and presence of strong pipeline drugs. In addition, PEGylated molecules offer some advantages, such as extended half-life, reduced toxicity, lower immunogenicity, and increase in proteolytic protection, that further support the market growth. On the other side, higher process cost associated with PEGylation and patent expiry of certain drugs are projected to hinder the market growth.
PEGylated Protein Therapeutics Market Segmentation
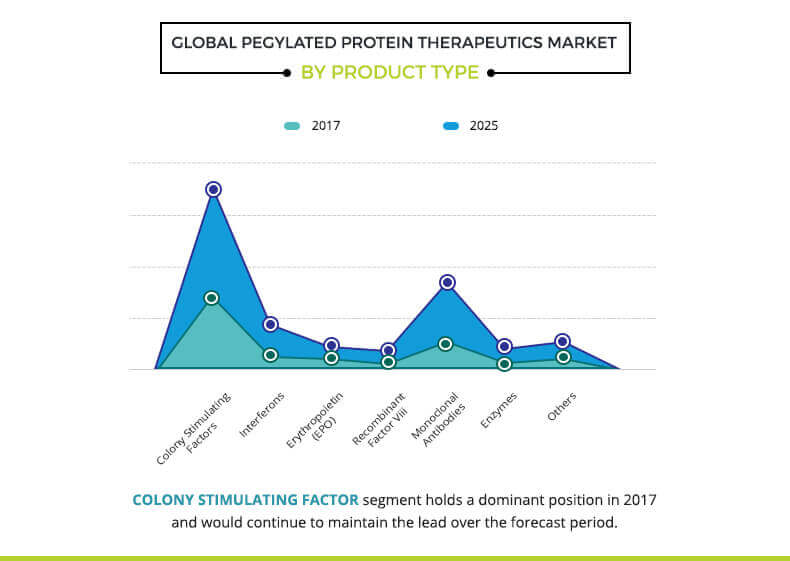
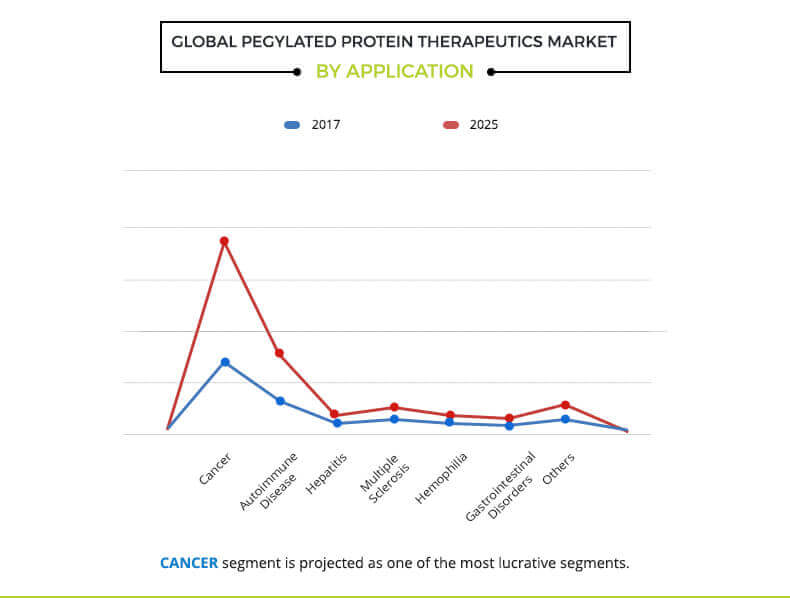
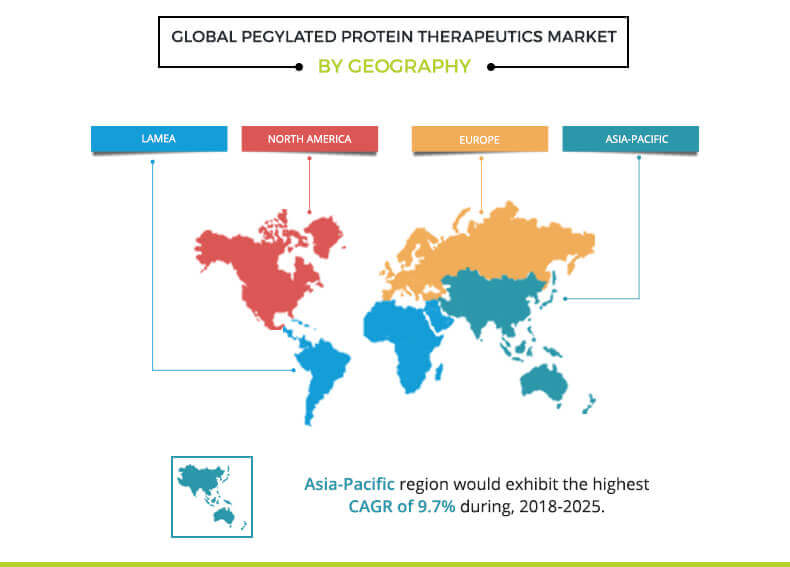
The global PEGylated protein therapeutics market is segmented based on product type, application, sales channel, and region. Based on product type, the market is segmented as colony stimulating factor, interferon, erythropoietin (EPO), recombinant factor VIII, monoclonal antibody, enzyme, and others. Based on application, the market is categorized as cancer, autoimmune disease, hepatitis, multiple sclerosis, hemophilia, gastrointestinal disorder, and others. According to sales channel, the market is divided into hospital pharmacy, online provider, and retail pharmacy. Based on region, the market is studied across North America (U.S. and Rest of North America), Europe (Germany, France, the UK, Italy, Spain, and rest of Europe), Asia-Pacific (Japan, China, Australia, India, South Korea, rest of Asia-Pacific), and LAMEA (Brazil, Saudi Arabia, South Africa, rest of LAMEA).
Segment Review
Based on product type, the colony stimulating factor segment generates the highest revenue, due to high incidence of infection associated with chemotherapy, and developments made by major players. On the other side, the interferon segment is estimated to exhibit fastest market growth during the forecast period, owing to its use in highly prevalent viral infections and low risk of adverse effects.
According to application, the market is dominated by the cancer segment and is anticipated to remain dominant during the forecast period, due to the high prevalence of cancer worldwide. The cancer segment is also expected to exhibit the fastest market growth during the forecast period.Â
Snapshot of Asia-pacific PEGylated Protein Therapeutics Market
Asia-Pacific presents lucrative opportunities for the key players operating in the PEGylated protein therapeutics market, owing to high population base, development in healthcare infrastructure, and rapid rise in prevalence of chronic disease. However, current lack of awareness is estimated to hamper the market growth in Asia-Pacific.
The report provides an extensive competitive analysis and profiles of the key market players, such as Amgen Inc., AstraZeneca PLC, Biogen, Inc., F. Hoffmann-La Roche Ltd. (Genentech, Inc.,), Horizon Pharma plc., Leadiant Biosciences S.p.A., Merck & Co., Inc. (Schering-Plough Corporation), Pfizer Inc., Shire plc (Baxalta), and UCB S.A.
Key Benefits for Stakeholders
PEGylated Protein Therapeutics Market Report Highlights
Aspects | Details |
---|---|
By Product Type |
|
By Application |
|
By Sales Channel |
|
By Region |
|
Key Market Players | Amgen Inc., Biogen Inc., Leadiant Biosciences S.p.A., Shire plc (Baxalta), UCB S.A., Horizon Pharma plc., AstraZeneca PLC, F. Hoffmann-La Roche Ltd. (Genentech, Inc.,), Pfizer Inc., Merck & Co., Inc. (Schering-Plough Corporation) |
CHAPTER 1: INTRODUCTION
1.1. Report Description
1.2. Key Benefits for Stakeholders
1.3. Key Market Segments
1.3.1. List of key players profiled in the report
1.4. Research Methodology
1.4.1. Secondary research
1.4.2. Primary research
1.4.3. Analyst tools and models
CHAPTER 2: EXECUTIVE SUMMARY
2.1. Key Findings of the Study
2.2. CXO Perspective
CHAPTER 3: MARKET OVERVIEW
3.1. Market Definition and Scope
3.2. Key Findings
3.2.1. Top investment pockets
3.3. Top Player Positioning, 2017
3.4. Clinical Trials
3.5. Market Dynamics
3.5.1. Drivers
3.5.1.1. Strong presence of pipeline drugs
3.5.1.2. Advantages offered by PEGylation
3.5.1.3. Rise in the prevalence of chronic diseases
3.5.2. Restraints
3.5.2.1. High costs associated with drug development
3.5.2.2. Expected Launch of generic drugs
3.5.3. Opportunities
3.5.3.1. Untapped emerging economies
3.5.3.2. Growth in adoption of PEGylated protein therapeutics
3.5.4. Impact Analyses
CHAPTER 4: PEGYLATED PROTEIN THERAPEUTICS MARKET, BY PRODUCT TYPE
4.1. Overview
4.1.1. Market size and forecast
4.2. Colony Stimulating Factor
4.2.1. Key market trends, growth factors, and opportunities
4.2.2. Market size and forecast
4.3. Interferon
4.3.1. Key market trends, growth factors, and opportunities
4.3.2. Market size and forecast
4.4. Erythropoietin (EPO)
4.4.1. Key market trends, growth factors, and opportunities
4.4.2. Market size and forecast
4.5. Recombinant Factor VIII
4.5.1. Key market trends, growth factors, and opportunities
4.5.2. Market size and forecast
4.6. Monoclonal Antibody
4.6.1. Key market trends, growth factors, and opportunities
4.6.2. Market size and forecast
4.7. Enzyme
4.7.1. Key market trends, growth factors, and opportunities
4.7.2. Market size and forecast
4.8. Other PEGylated Protein Therapeutics
4.8.1. Key market trends, growth factors, and opportunities
4.8.2. Market size and forecast
CHAPTER 5: PEGYLATED PROTEIN THERAPEUTICS MARKET, BY APPLICATION
5.1. Overview
5.1.1. Market size and forecast
5.2. Cancer
5.2.1. Market size and forecast
5.3. Autoimmune Disease
5.3.1. Market size and forecast
5.4. Hepatitis
5.4.1. Market size and forecast
5.5. Multiple Sclerosis
5.5.1. Market size and forecast
5.6. Hemophilia
5.6.1. Market size and forecast
5.7. Gastrointestinal Disorders
5.7.1. Market size and forecast
5.8. Other Applications
5.8.1. Market size and forecast
CHAPTER 6: PEGYLATED PROTEIN THERAPEUTICS MARKET, BY SALES CHANNEL
6.1. Overview
6.1.1. Market size and forecast
6.2. Hospital Pharmacy
6.2.1. Market size and forecast, by region
6.3. Online Providers
6.3.1. Market size and forecast, by region
6.4. Retail Pharmacy
6.4.1. Market size and forecast, by region
CHAPTER 7: PEGYLATED PROTEIN THERAPEUTICS MARKET, BY REGION
7.1. Overview
7.1.1. Market size and forecast
7.2. North America
7.2.1. Key market trends, growth factors, and opportunities
7.2.2. North America market size and forecast, by country
7.2.2.1. U.S.
7.2.2.2. Rest of North America
7.2.3. North America market size and forecast, by product type
7.2.4. North America market size and forecast, by application
7.2.5. North America market size and forecast, by sales channel
7.3. Europe
7.3.1. Key market trends, growth factors, and opportunities
7.3.2. Europe market size and forecast, by country
7.3.2.1. Germany
7.3.2.2. France
7.3.2.3. UK
7.3.2.4. Rest of Europe
7.3.3. Europe market size and forecast, by product type
7.3.4. Europe market size and forecast, by application
7.3.5. Europe market size and forecast, by sales channel
7.4. Asia-Pacific
7.4.1. Key market trends, growth factors, and opportunities
7.4.2. Asia-Pacific market size and forecast, by country
7.4.2.1. Japan
7.4.2.2. China
7.4.2.3. India
7.4.2.4. Rest of Asia-Pacific
7.4.3. Asia-Pacific market size and forecast, by product type
7.4.4. Asia-Pacific market size and forecast, by application
7.4.5. Asia-Pacific market size and forecast, by sales channel
7.5. LAMEA
7.5.1. Key market trends, growth factors, and opportunities
7.5.2. LAMEA market size and forecast, by country
7.5.2.1. Brazil
7.5.2.2. Rest of LAMEA
7.5.3. LAMEA market size and forecast, by product type
7.5.4. LAMEA market size and forecast, by application
7.5.5. LAMEA market size and forecast, by sales channel
CHAPTER 8: COMPANY PROFILES
8.1. Amgen Inc.
8.1.1. Company overview
8.1.2. Company snapshot
8.1.3. Operating business segments
8.1.4. Product portfolio
8.1.5. Business performance
8.1.6. Key strategic moves and developments
8.2. AstraZeneca PLC
8.2.1. Company overview
8.2.2. Company snapshot
8.2.3. Operating business segments
8.2.4. Product Portfolio
8.2.5. Business performance
8.2.6. Key strategic moves and developments
8.3. Biogen Inc.
8.3.1. Company overview
8.3.2. Company snapshot
8.3.3. Operating business segments
8.3.4. Product portfolio
8.3.5. Business performance
8.4. F. Hoffmann-La Roche Ltd. (Genentech, Inc.,)
8.4.1. Company overview
8.4.2. Company snapshot
8.4.3. Operating business segments
8.4.4. Product portfolio
8.4.5. Business performance
8.5. Horizon Pharma plc.
8.5.1. Company overview
8.5.2. Company snapshot
8.5.3. Operating business segments
8.5.4. Product Portfolio
8.5.5. Business performance
8.6. Leadiant Biosciences S.p.A.
8.6.1. Company overview
8.6.2. Company snapshot
8.6.3. Product Portfolio
8.7. Merck & Co., Inc. (Schering-Plough Corporation)
8.7.1. Company overview
8.7.2. Company snapshot
8.7.3. Operating business segments
8.7.4. Product Portfolio
8.7.5. Business performance
8.8. Pfizer Inc.
8.8.1. Company overview
8.8.2. Company snapshot
8.8.3. Operating business segments
8.8.4. Product Portfolio
8.8.5. Business performance
8.9. Shire plc (Baxalta)
8.9.1. Company overview
8.9.2. Company snapshot
8.9.3. Operating business segments
8.9.4. Product portfolio
8.9.5. Business performance
8.9.6. Key strategic moves and developments
8.10. UCB S.A.
8.10.1. Company overview
8.10.2. Company snapshot
8.10.3. Product Portfolio
8.10.4. Business performance
8.10.5. Key strategic moves and developments
LIST OF TABLES
TABLE 01. COMPLETED CLINICAL TRIALS IN PEGYLATED PROTEIN THERAPEUTICS MARKET, 2013-2018
TABLE 02. GLOBAL PEGYLATED PROTEIN THERAPEUTICS MARKET, BY PRODUCT TYPE, 2017-2025 ($MILLION)
TABLE 03. PEGYLATED COLONY STIMULATING FACTOR MARKET, BY REGION, 2017-2025 ($MILLION)
TABLE 04. PEGYLATED INTERFERONS MARKET, BY REGION, 2017-2025 ($MILLION)
TABLE 05. PEGYLATED ERYTHROPOIETIN MARKET, BY REGION, 2017-2025 ($MILLION)
TABLE 06. PEGYLATED RECOMBINANT FACTOR VIII MARKET, BY REGION, 2017-2025 ($MILLION)
TABLE 07. PEGYLATED MONOCLONAL ANTIBODIES MARKET, BY REGION, 2017-2025 ($MILLION)
TABLE 08. PEGYLATED ENZYMES MARKET, BY REGION, 2017-2025 ($MILLION)
TABLE 09. OTHER PEGYLATED PROTEIN THERAPEUTICS MARKET, BY REGION, 2017-2025 ($MILLION)
TABLE 10. GLOBAL PEGYLATED PROTEIN THERAPEUTICS MARKET, BY APPLICATION, 2017-2025 ($MILLION)
TABLE 11. PEGYLATED PROTEIN THERAPEUTICS MARKET FOR CANCER, BY REGION, 2017-2025 ($MILLION)
TABLE 12. PEGYLATED PROTEIN THERAPEUTICS MARKET FOR AUTOIMMUNE DISEASES, BY REGION, 2017-2025 ($MILLION)
TABLE 13. PEGYLATED PROTEIN THERAPEUTICS MARKET FOR HEPATITIS, BY REGION, 2017-2025 ($MILLION)
TABLE 14. PEGYLATED PROTEIN THERAPEUTICS MARKET FOR MULTIPLE SCLEROSIS, BY REGION, 2017-2025 ($MILLION)
TABLE 15. PEGYLATED PROTEIN THERAPEUTICS MARKET FOR HEMOPHILIA, BY REGION, 2017-2025 ($MILLION)
TABLE 16. PEGYLATED PROTEIN THERAPEUTICS MARKET FOR GASTROINTESTINAL DISORDERS, BY REGION, 2017-2025 ($MILLION)
TABLE 17. PEGYLATED PROTEIN THERAPEUTICS MARKET FOR OTHER APPLICATIONS, BY REGION, 2017-2025 ($MILLION)
TABLE 18. GLOBAL PEGYLATED PROTEIN THERAPEUTICS MARKET, BY SALES CHANNEL, 2017-2025 ($MILLION)
TABLE 19. PEGYLATED PROTEIN THERAPEUTICS MARKET FOR HOSPITAL PHARMACY, BY REGION, 2017-2025 ($MILLION)
TABLE 20. PEGYLATED PROTEIN THERAPEUTICS MARKET FOR ONLINE PROVIDERS, BY REGION, 2017-2025 ($MILLION)
TABLE 21. PEGYLATED PROTEIN THERAPEUTICS MARKET FOR RETAIL PHARMACY, BY REGION, 2017-2025 ($MILLION)
TABLE 22. PEGYLATED PROTEIN THERAPEUTICS MARKET REVENUE, BY REGION, 2017-2025 ($MILLION)
TABLE 23. NORTH AMERICA PEGYLATED PROTEIN THERAPEUTICS MARKET, BY COUNTRY, 2017-2025 ($MILLION)
TABLE 24. NORTH AMERICA PEGYLATED PROTEIN THERAPEUTICS MARKET, BY PRODUCT TYPE, 2017-2025 ($MILLION)
TABLE 25. NORTH AMERICA PEGYLATED PROTEIN THERAPEUTICS MARKET, BY APPLICATION, 2017-2025 ($MILLION)
TABLE 26. NORTH AMERICA PEGYLATED PROTEIN THERAPEUTICS MARKET, BY SALES CHANNEL, 2017-2025 ($MILLION)
TABLE 27. EUROPE PEGYLATED PROTEIN THERAPEUTICS MARKET, BY COUNTRY, 2017-2025 ($MILLION)
TABLE 28. EUROPE PEGYLATED PROTEIN THERAPEUTICS MARKET, BY PRODUCT TYPE, 2017-2025 ($MILLION)
TABLE 29. EUROPE PEGYLATED PROTEIN THERAPEUTICS MARKET, BY APPLICATION, 2017-2025 ($MILLION)
TABLE 30. EUROPE PEGYLATED PROTEIN THERAPEUTICS MARKET, BY SALES CHANNEL, 2017-2025 ($MILLION)
TABLE 31. ASIA-PACIFIC PEGYLATED PROTEIN THERAPEUTICS MARKET, BY COUNTRY, 2017-2025 ($MILLION)
TABLE 32. ASIA-PACIFIC PEGYLATED PROTEIN THERAPEUTICS MARKET, BY PRODUCT TYPE, 2017-2025 ($MILLION)
TABLE 33. ASIA-PACIFIC PEGYLATED PROTEIN THERAPEUTICS MARKET, BY APPLICATION, 2017-2025 ($MILLION)
TABLE 34. ASIA-PACIFIC PEGYLATED PROTEIN THERAPEUTICS MARKET, BY SALES CHANNEL, 2017-2025 ($MILLION)
TABLE 35. LAMEA PEGYLATED PROTEIN THERAPEUTICS MARKET, BY COUNTRY, 2017-2025 ($MILLION)
TABLE 36. LAMEA PEGYLATED PROTEIN THERAPEUTICS MARKET, BY PRODUCT TYPE, 2017-2025 ($MILLION)
TABLE 37. LAMEA PEGYLATED PROTEIN THERAPEUTICS MARKET, BY APPLICATION, 2017-2025 ($MILLION)
TABLE 38. LAMEA PEGYLATED PROTEIN THERAPEUTICS MARKET, BY SALES CHANNEL, 2017-2025 ($MILLION)
TABLE 39. AMGEN: COMPANY SNAPSHOT
TABLE 40. AMGEN: PRODUCT PORTFOLIO
TABLE 41. ASTRAZENECA: COMPANY SNAPSHOT
TABLE 42. ASTRAZENECA: OPERATING SEGMENTS
TABLE 43. ASTRAZENECA: PRODUCT PORTFOLIO
TABLE 44. BIOGEN: COMPANY SNAPSHOT
TABLE 45. BIOGEN: PRODUCT PORTFOLIO
TABLE 46. ROCHE: COMPANY SNAPSHOT
TABLE 47. ROCHE: OPERATING SEGMENTS
TABLE 48. ROCHE: PRODUCT PORTFOLIO
TABLE 49. HORIZON PHARMA: COMPANY SNAPSHOT
TABLE 50. HORIZON PHARMA: BUSINESS UNITS
TABLE 51. HORIZON PHARMA: PRODUCT PORTFOLIO
TABLE 52. LEADIANT BIOSCIENCES: COMPANY SNAPSHOT
TABLE 53. LEADIANT BIOSCIENCES: PRODUCT PORTFOLIO
TABLE 54. MERCK: COMPANY SNAPSHOT
TABLE 55. MERCK: OPERATING SEGMENTS
TABLE 56. MERCK: PRODUCT PORTFOLIO
TABLE 57. PFIZER: COMPANY SNAPSHOT
TABLE 58. PFIZER: OPERATING SEGMENTS
TABLE 59. PFIZER: PRODUCT PORTFOLIO
TABLE 60. SHIRE: COMPANY SNAPSHOT
TABLE 61. SHIRE: PRODUCT PORTFOLIO
TABLE 62. UCB: COMPANY SNAPSHOT
TABLE 63. UCB: PRODUCT PORTFOLIO
LIST OF FIGURES
FIGURE 01. PEGYLATED PROTEIN THERAPEUTICS MARKET SEGMENTATION
FIGURE 02. TOP INVESTMENT POCKETS
FIGURE 03. TOP PLAYER POSITIONING, 2017
FIGURE 04. IMPACT ANALYSES, PEGYLATED PROTEIN THEREPEUTICS MARKET
FIGURE 05. U.S. PEGYLATED PROTEIN THERAPEUTICS MARKET, 2017-2025 ($MILLION)
FIGURE 06. REST OF NORTH AMERICA PEGYLATED PROTEIN THERAPEUTICS MARKET, 2017-2025 ($MILLION)
FIGURE 07. GERMANY PEGYLATED PROTEIN THERAPEUTICS MARKET, 2017-2025 ($MILLION)
FIGURE 08. FRANCE PEGYLATED PROTEIN THERAPEUTICS MARKET, 2017-2025 ($MILLION)
FIGURE 09. UK PEGYLATED PROTEIN THERAPEUTICS MARKET, 2017-2025 ($MILLION)
FIGURE 10. REST OF EUROPE PEGYLATED PROTEIN THERAPEUTICS MARKET, 2017-2025 ($MILLION)
FIGURE 11. JAPAN PEGYLATED PROTEIN THERAPEUTICS MARKET, 2017-2025 ($MILLION)
FIGURE 12. CHINA PEGYLATED PROTEIN THERAPEUTICS MARKET, 2017-2025 ($MILLION)
FIGURE 13. INDIA PEGYLATED PROTEIN THERAPEUTICS MARKET, 2017-2025 ($MILLION)
FIGURE 14. REST OF ASIA-PACIFIC PEGYLATED PROTEIN THERAPEUTICS MARKET, 2017-2025 ($MILLION)
FIGURE 15. BRAZIL PEGYLATED PROTEIN THERAPEUTICS MARKET, 2017-2025 ($MILLION)
FIGURE 16. REST OF LAMEA PEGYLATED PROTEIN THERAPEUTICS MARKET, 2017-2025 ($MILLION)
FIGURE 17. AMGEN: NET SALES, 2015-2017 ($MILLION)
FIGURE 18. AMGEN: REVENUE SHARE BY PRODUCT, 2017 (%)
FIGURE 19. AMGEN: REVENUE SHARE BY GEOGRAPHY, 2017 (%)
FIGURE 20. ASTRAZENECA: REVENUE, 2015-2017 ($MILLION)
FIGURE 21. ASTRAZENECA: REVENUE SHARE BY GEOGRAPHY, 2017 (%)
FIGURE 22. BIOGEN: REVENUE, 2015-2017 ($MILLION)
FIGURE 23. BIOGEN: REVENUE SHARE BY PRODUCT, 2017 (%)
FIGURE 24. BIOGEN: REVENUE SHARE BY GEOGRAPHY, 2017 (%)
FIGURE 25. ROCHE: NET SALES, 2015-2017 ($MILLION)
FIGURE 26. ROCHE: REVENUE SHARE BY SEGMENT, 2017 (%)
FIGURE 27. ROCHE: REVENUE SHARE BY GEOGRAPHY, 2017 (%)
FIGURE 28. HORIZON PHARMA: REVENUE, 2015-2017 ($MILLION)
FIGURE 29. HORIZON PHARMA: REVENUE SHARE BY BUSINESS UNIT, 2017 (%)
FIGURE 30. HORIZON PHARMA: REVENUE SHARE BY GEOGRAPHY, 2017 (%)
FIGURE 31. MERCK: NET SALES, 2015-2017 ($MILLION)
FIGURE 32. MERCK: NET SALES BY SEGMENT, 2017 (%)
FIGURE 33. MERCK: NET SALES BY GEOGRAPHY, 2017 (%)
FIGURE 34. PFIZER: REVENUE, 2015-2017 ($MILLION)
FIGURE 35. PFIZER: REVENUE SHARE BY SEGMENT, 2017 (%)
FIGURE 36. PFIZER: REVENUE SHARE BY GEOGRAPHY, 2017 (%)
FIGURE 37. SHIRE: NET SALES, 2015-2017 ($MILLION)
FIGURE 38. SHIRE: REVENUE SHARE BY PRODUCT, 2017 (%)
FIGURE 39. SHIRE: REVENUE SHARE BY GEOGRAPHY, 2017 (%)
FIGURE 40. UCB: NET SALES, 2015-2017 ($MILLION)
FIGURE 41. UCB: REVENUE SHARE BY GEOGRAPHY, 2017 (%)
PEGylated protein therapeutics are protein drugs which are subjected to PEGylation for pharmacological enhancement. PEGylation of proteins is performed by covalent conjugation of polyethylene glycol (PEG) to increase the molecular weight of proteins. The rise in molecular weight increases the half-life of the drug in plasma causing reduction in dosing frequency. In addition, PEGylation also results in low toxicity and low proteolytic degradation. PEGylated protein therapeutics are indicated in the treatment of diseases such as, hemophilia, rheumatoid arthritis, cancer, and other chronic diseases. The growth of the PEGylated protein therapeutics market is propelled by the escalating number of chronic disease patients and presence of numerous drugs in the pipeline. Furthermore, advantages offered by PEGylation are anticipated to boost the market growth in the forecast period.
The use of PEGylated protein therapeutics is highest in North America, which is attributed to presence of major key players, high purchasing power, and rise in awareness associated with chronic diseases in the region. North America is followed by Europe and Asia-Pacific. In addition, abundance of pipeline products for the treatment of PEGylated protein is anticipated to drive the market growth.
Start reading instantly.
This Report and over 67,068+ more Reports, Available with Avenue Library. T&C*.
Enterprise
License/PDF
Library
Membership
*Taxes/Fees, if applicable will be added during checkout. All prices in USD
To ensure high-level data integrity, accurate analysis, and impeccable forecasts
For complete satisfaction
On-demand customization of scope of the report to exactly meet your needs
Targeted market view to provide pertinent information and save time of readers
Get insights on topics that are crucial for your business. Stay abreast of your interest areas.
Get Industry Data AlertsTo ensure high-level data integrity, accurate analysis, and impeccable forecasts
For complete satisfaction
On-demand customization of scope of the report to exactly meet your needs
Targeted market view to provide pertinent information and save time of readers