Report Code: A04268 | Apr 2018 | Pages: 124 | ||
Tables: 31 | Charts: 37 |
|
Pandemic disrupted the entire world and affected many industries.
Get detailed COVID-19 impact analysis on the U.s. Next Generation Diabetes Therapy And Drug Delivery Market
Request Now !Next generation diabetic therapy and drug delivery systems are used to improve the adherence to insulin in a diabetic patient, which in turn helps reduce the risk of complications related to sudden changes in blood sugar level. As oral and inhalable insulin helps to painlessly manage the blood glucose level, they have the potential to replace injectable insulins. Advanced diabetic therapy in the form of insulin patches, continuous glucose monitoring systems (CGMS), and artificial pancreas help improve management of blood sugar level and reduces the risk of any diabetic-related complications. The U.S. next generation diabetes therapy and drug delivery market was valued at $446 million in 2015, and is estimated to reach $6,510 million by 2023, registering a CAGR of 33.0% from 2017 to 2023.
The U.S. next generation diabetes therapy and drug delivery market growth is attributed to the rise in the number of diabetic patients in the U.S. along with the increase in disposable income among the diabetic patients. The benefits of using these advanced devices over conventional products and rise in the healthcare expenditure are expected to increase the demand for these advanced diabetic products, thus fueling the market growth. However, cost restraints among low and middle-income population and less variability in products are expected to hamper this growth.
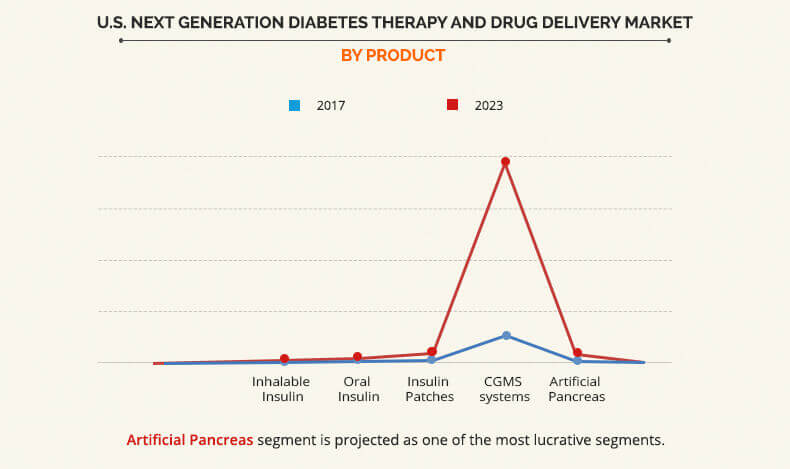
Product segment review
Based on the products, the market is segmented into inhalable insulin, oral insulin, insulin patches, CGM systems, and artificial pancreas. CGM systems segment dominates the market owing to the availability of large number of FDA approved CGM devices leading to high adoption rate of these devices.
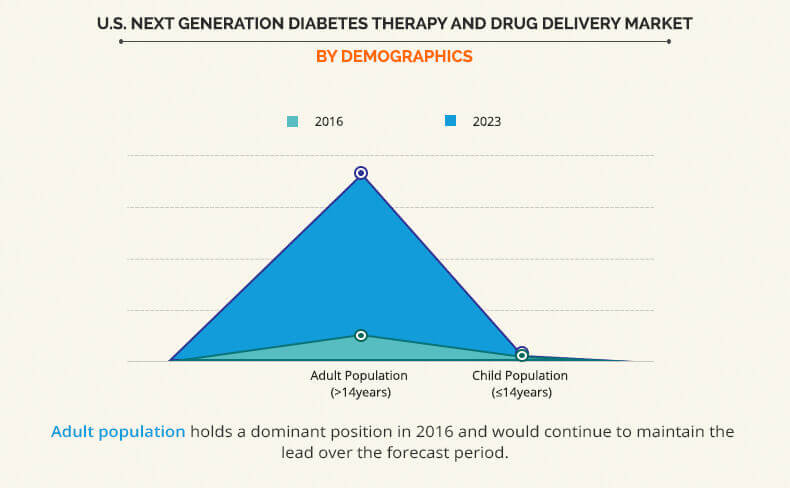
Demographics segment review
Depending on demographics, the market is bifurcated into adult and child population. Adult population is the dominant segment that contributes toward the market growth as almost 90% of the diabetic population in U.S. are above the age of 18 years.
The key players profiled in this report include Abbott Laboratories, Echo Therapeutics, Inc., F. Hoffmann-La Roche Ltd., GlySens Incorporated, Medtronic Plc, Sanofi, Novo Nordisk, MannKind Corporation, Dexcom, Inc., and Senseonics Holding, Inc.
Other players in the value chain include Enteris BioPharma, Synertech, Zosano Pharma Corp., Relmada Therapeutics, Inc., Eli Lilly and Company, and Transdermal Specialties Inc.
Key Benefits
U.S. Next Generation Diabetes Therapy and Drug Delivery Market Report Highlights
Aspects | Details |
---|---|
By Product |
|
By Demographic |
|
By Indication |
|
By End User |
|
Key Market Players | ABBOTT LABORATORIES, F. HOFFMANN-LA ROCHE LTD., SANOFI, GLYSENS INCORPORATED, NOVO NORDISK A/S, MANNKIND CORPORATION, MEDTRONIC PLC., ECHO THERAPEUTICS, INC., DEXCOM, INC., SENSEONICS HOLDINGS, INC. |
CHAPTER 1 INTRODUCTION
1.1. REPORT DESCRIPTION
1.2. KEY BENEFITS
1.3. KEY MARKET SEGMENTS
1.4. RESEARCH METHODOLOGY
1.4.1. Secondary research
1.4.2. Primary research
1.4.3. Analyst tools and models
CHAPTER 2 EXECUTIVE SUMMARY
2.1. CXO PERSPECTIVE
CHAPTER 3 MARKET OVERVIEW
3.1. KEY BENEFITS
3.1.1. Top investment pockets
3.1.2. Top winning strategies
3.2. PATENT ANALYSIS
3.2.1. Patent analysis by year
3.2.2. Patent analysis by product
3.3. GOVERNMENT REGULATIONS
3.3.1. U.S. FDA
3.4. REIMBURSEMENT POLICIES
3.5. INNOVATIONS IN NEXT GENERATION DIABETES THERAPY AND DRUG DELIVERY MARKET
3.5.1. Smart contact lenses for glucose monitoring
3.5.2. iLet bihormonal bionic pancreas
3.5.3. Glucose nanosensors
3.5.4. Beta cell replacement therapy
3.5.5. Glucose-responsive insulin-producing cells
3.6. MARKET DYNAMICS
3.6.1. Drivers
3.6.1.1. Rise in incidence of diabetes
3.6.1.2. Rise in healthcare expenditure & disposable income
3.6.1.3. Benefits of using next generation diabetes products over conventional products
3.6.2. Restraints
3.6.2.1. Cost restrains
3.6.2.2. Lack of awareness
3.6.2.3. Less variability in products
3.6.3. Opportunities
3.6.3.1. Developing products with fewer side effects at affordable costs
3.6.3.2. High undiagnosed diabetic patient population
CHAPTER 4 NEXT GENERATION DIABETES THERAPY AND DRUG DELIVERY MARKET, BY PRODUCT
4.1. OVERVIEW
4.1.1. Market size and forecast
4.2. INHALABLE INSULIN
4.2.1. Key market trends
4.2.2. Key growth factors and opportunities
4.2.3. Market size and forecast
4.3. ORAL INSULIN
4.3.1. Key market trends
4.3.2. Key growth factors and opportunities
4.3.3. Market size and forecast
4.4. INSULIN PATCHES
4.4.1. Key market trends
4.4.2. Key growth factors and opportunities
4.4.3. Market size and forecast
4.5. CGMS
4.5.1. Key market trends
4.5.2. Key growth factors and opportunities
4.5.3. Market size and forecast
4.6. ARTIFICIAL PANCREAS
4.6.1. Key market trends
4.6.2. Key growth factors and opportunities
4.6.3. Market size and forecast
CHAPTER 5 NEXT GENERATION DIABETES THERAPY AND DRUG DELIVERY MARKET, BY DEMOGRAPHICS
5.1. OVERVIEW
5.1.1. Market size and forecast
5.2. ADULT POPULATION (>14YEARS)
5.2.1. Market size and forecast
5.3. CHILD POPULATION (≤14YEARS)
5.3.1. Market size and forecast
CHAPTER 6 NEXT GENERATION DIABETES THERAPY AND DRUG DELIVERY MARKET, BY INDICATION
6.1. OVERVIEW
6.1.1. Market size and forecast
6.2. TYPE I DIABETES
6.2.1. Market size and forecast
6.3. TYPE II DIABETES
6.3.1. Market size and forecast
CHAPTER 7 NEXT GENERATION DIABETES THERAPY AND DRUG DELIVERY MARKET, BY END USER
7.1. OVERVIEW
7.1.1. Market size and forecast
7.2. DIAGNOSTICS/CLINICS
7.2.1. Market size and forecast
7.3. INTENSIVE CARE UNITS (ICU)
7.3.1. Market size and forecast
7.4. HOME HEALTHCARE
7.4.1. Market size and forecast
CHAPTER 8 COMPANY PROFILES
8.1. ABBOTT LABORATORIES
8.1.1. Company overview
8.1.2. Company snapshot
8.1.3. Operating business segments
8.1.4. Product portfolio
8.1.5. Business performance
8.1.6. Key strategic moves and developments
8.2. DEXCOM, INC.
8.2.1. Company overview
8.2.2. Company snapshot
8.2.3. Product portfolio
8.2.4. Business performance
8.2.5. Key strategic moves and developments
8.3. ECHO THERAPEUTICS, INC.
8.3.1. Company overview
8.3.2. Company snapshot
8.3.3. Operating business segments
8.3.4. Product portfolio
8.4. F. HOFFMANN-LA ROCHE LTD.
8.4.1. Company overview
8.4.2. Company snapshot
8.4.3. Operating business segments
8.4.4. Product portfolio
8.4.5. Business performance
8.4.6. Key strategic moves and developments
8.5. GLYSENS INCORPORATED
8.5.1. Company overview
8.5.2. Company snapshot
8.5.3. Product portfolio
8.5.4. Key strategic moves and developments
8.6. MANNKIND CORPORATION
8.6.1. Company overview
8.6.2. Company snapshot
8.6.3. Operating business segments
8.6.4. Product portfolio
8.6.5. Business performance
8.7. MEDTRONIC PLC.
8.7.1. Company overview
8.7.2. Company snapshot
8.7.3. Operating business segments
8.7.4. Product portfolio
8.7.5. Business performance
8.7.6. Key strategic moves and developments
8.8. NOVO NORDISK A/S
8.8.1. Company overview
8.8.2. Company snapshot
8.8.3. Operating business segments
8.8.4. Product portfolio
8.8.5. Business performance
8.9. SANOFI
8.9.1. Company overview
8.9.2. Company snapshot
8.9.3. Operating business segments
8.9.4. Product portfolio
8.9.5. Business performance
8.9.6. Key strategic moves and developments
8.10. SENSEONICS HOLDINGS, INC.
8.10.1. Company overview
8.10.2. Company snapshot
8.10.3. Operating business segments
8.10.4. Product portfolio
8.10.5. Business performance
8.10.6. Key strategic moves and developments
LIST OF TABLES
TABLE 1. U.S. NEXT GENERATION DIABETES THERAPY AND DRUG DELIVERY MARKET, BY PRODUCT, 2014-2023 ($THOUSAND)
TABLE 2. U.S. NEXT GENERATION DIABETES THERAPY AND DRUG DELIVERY MARKET, BY DEMOGRAPHICS, 2014-2023 ($THOUSAND)
TABLE 3. U.S. NEXT GENERATION DIABETES THERAPY AND DRUG DELIVERY MARKET, BY INDICATION, 2014-2023 ($THOUSAND)
TABLE 4. U.S. NEXT GENERATION DIABETES THERAPY AND DRUG DELIVERY MARKET, BY END USER, 2014-2023 ($THOUSAND)
TABLE 5. ABBOTT: COMPANY SNAPSHOT
TABLE 6. ABBOTT: OPERATING SEGMENTS
TABLE 7. ABBOTT: PRODUCT PORTFOLIO
TABLE 8. DEXCOM: COMPANY SNAPSHOT
TABLE 9. DEXCOM: PRODUCT PORTFOLIO
TABLE 10. ECHO THERAPEUTICS: COMPANY SNAPSHOT
TABLE 11. ECHO THERAPEUTICS: OPERATING SEGMENTS
TABLE 12. ECHO THERAPEUTICS: PRODUCT PORTFOLIO
TABLE 13. ROCHE: COMPANY SNAPSHOT
TABLE 14. ROCHE: OPERATING SEGMENTS
TABLE 15. ROCHE: PRODUCT PORTFOLIO
TABLE 16. GLYSENS: COMPANY SNAPSHOT
TABLE 17. GLYSENS: PRODUCT PORTFOLIO
TABLE 18. MANNKIND: COMPANY SNAPSHOT
TABLE 19. MANNKIND: PRODUCT PORTFOLIO
TABLE 20. MEDTRONIC: COMPANY SNAPSHOT
TABLE 21. MEDTRONIC: OPERATING SEGMENTS
TABLE 22. MEDTRONIC: PRODUCT PORTFOLIO
TABLE 23. NOVO NORDISK: COMPANY SNAPSHOT
TABLE 24. NOVO NORDISK: OPERATING SEGMENTS
TABLE 25. NOVO NORDISK: PRODUCT PORTFOLIO
TABLE 26. SANOFI: COMPANY SNAPSHOT
TABLE 27. SANOFI: OPERATING SEGMENTS
TABLE 28. SANOFI: PRODUCT PORTFOLIO
TABLE 29. SENSEONICS: COMPANY SNAPSHOT
TABLE 30. SENSEONICS: PRODUCT SEGMENTS
TABLE 31. SENSEONICS: PRODUCT PORTFOLIO
LIST OF FIGURES
FIGURE 1. U.S. NEXT GENERATION DIABETES THERAPY AND DRUG DELIVERY MARKET: SEGMENTATION
FIGURE 2. TOP INVESTMENT POCKETS, BY PRODUCT
FIGURE 3. TOP WINNING STRATEGIES, BY YEAR, 2015-2018*
FIGURE 4. TOP WINNING STRATEGIES, BY DEVELOPMENT, 2015-2018* (%)
FIGURE 5. TOP WINNING STRATEGIES, BY COMPANY, 2015-2018*
FIGURE 6. PATENT REGISTERED/APPROVED, BY YEAR
FIGURE 7. PATENT REGISTERED/APPROVED, BY PRODUCT
FIGURE 8. NEXT GENERATION DIABETES THERAPY AND DRUG DELIVERY MARKET FOR INHALABLE INSULIN, 2014-2023 ($THOUSAND)
FIGURE 9. NEXT GENERATION DIABETES THERAPY AND DRUG DELIVERY MARKET FOR ORAL INSULIN, 2014-2023 ($THOUSAND)
FIGURE 10. NEXT GENERATION DIABETES THERAPY AND DRUG DELIVERY MARKET FOR INSULIN PATCH, 2014-2023 ($THOUSAND)
FIGURE 11. NEXT GENERATION DIABETES THERAPY AND DRUG DELIVERY MARKET FOR CGM SYSTEMS, 2014-2023 ($THOUSAND)
FIGURE 12. NEXT GENERATION DIABETES THERAPY AND DRUG DELIVERY MARKET FOR ARTIFICIAL PANCREAS, 2014-2023 ($THOUSAND)
FIGURE 13. NEXT GENERATION DIABETES THERAPY AND DRUG DELIVERY MARKET FOR ADULT POPULATION, 2014-2023 ($THOUSAND)
FIGURE 14. NEXT GENERATION DIABETES THERAPY AND DRUG DELIVERY MARKET FOR CHILD POPULATION, 2014-2023 ($THOUSAND)
FIGURE 15. NEXT GENERATION TYPE I DIABETES THERAPY AND DRUG DELIVERY MARKET, 2014-2023 ($THOUSAND)
FIGURE 16. NEXT GENERATION TYPE II DIABETES THERAPY AND DRUG DELIVERY MARKET, 2014-2023 ($THOUSAND)
FIGURE 17. NEXT GENERATION DIABETES THERAPY AND DRUG DELIVERY MARKET FOR DIAGNOSTICS/CLINICS, 2014-2023 ($THOUSAND)
FIGURE 18. NEXT GENERATION DIABETES THERAPY AND DRUG DELIVERY MARKET FOR ICUS, 2014-2023 ($THOUSAND)
FIGURE 19. NEXT GENERATION DIABETES THERAPY AND DRUG DELIVERY MARKET FOR HOME HEALTHCARE, 2014-2023 ($THOUSAND)
FIGURE 20. ABBOTT: NET SALES, 2015-2017 ($MILLION)
FIGURE 21. ABBOTT: REVENUE SHARE BY SEGMENT, 2017 (%)
FIGURE 22. ABBOTT: REVENUE SHARE BY GEOGRAPHY, 2017 (%)
FIGURE 23. DEXCOM: NET SALES, 2015-2017 ($MILLION)
FIGURE 24. DEXCOM: REVENUE SHARE BY GEOGRAPHY, 2017 (%)
FIGURE 25. ROCHE: NET SALES, 2015-2017 ($MILLION)
FIGURE 26. ROCHE: REVENUE SHARE BY SEGMENT, 2017 (%)
FIGURE 27. MANNKIND: NET SALES, 2016-2017 ($MILLION)
FIGURE 28. MEDTRONIC: NET SALES, 2015-2017 ($MILLION)
FIGURE 29. MEDTRONIC: REVENUE SHARE BY SEGMENT, 2017 (%)
FIGURE 30. MEDTRONIC: REVENUE SHARE BY GEOGRAPHY, 2017 (%)
FIGURE 31. NOVO NORDISK: NET SALES, 2015-2017 ($MILLION)
FIGURE 32. NOVO NORDISK: REVENUE SHARE BY SEGMENT, 2017 (%)
FIGURE 33. NOVO NORDISK: REVENUE SHARE BY GEOGRAPHY, 2017 (%)
FIGURE 34. SANOFI: NET SALES, 2015-2017 ($MILLION)
FIGURE 35. SANOFI: REVENUE SHARE BY SEGMENT, 2017 (%)
FIGURE 36. SANOFI: REVENUE SHARE BY GEOGRAPHY, 2017 (%)
FIGURE 37. SENSEONICS: NET SALES, 2015-2017 ($MILLION)
Oral and inhalable insulin reduces the risk of skin irritation due to needles as well as is a painless mode of insulin delivery. This in turn increases the demand in the market. Therefore, they are also expected to replace injectable insulins.
With the advancement in diabetic therapy systems such as insulin patches and artificial pancreas, the amount of insulin that needs to be introduced into the patients’ body is adjusted according to the blood sugar levels using a computer algorithm. The automated version of these systems help the patient lead a normal life and reduce the complications related to hypo- or hyperglycemia. Such advancement in diabetic technology is expected to help boosts the growth of the market.
The use of other advanced diabetic systems such as insulin patch, CGM system, and artificial pancreas help in adherence to medication in diabetic patients and improve the quality of life of diabetic patients. The U.S. next generation diabetes therapy and drug delivery market is expected to experience an exponential growth owing to increase in demand for advanced diabetic products, high incidence of diabetes in U.S., and rise in healthcare expenditure.
Start reading instantly.
This Report and over 67,404+ more Reports, Available with Avenue Library. T&C*.
Enterprise
License/PDF
Library
Membership
*Taxes/Fees, if applicable will be added during checkout. All prices in USD
To ensure high-level data integrity, accurate analysis, and impeccable forecasts
For complete satisfaction
On-demand customization of scope of the report to exactly meet your needs
Targeted market view to provide pertinent information and save time of readers
Get insights on topics that are crucial for your business. Stay abreast of your interest areas.
Get Industry Data AlertsTo ensure high-level data integrity, accurate analysis, and impeccable forecasts
For complete satisfaction
On-demand customization of scope of the report to exactly meet your needs
Targeted market view to provide pertinent information and save time of readers