
Activewear Market Summary
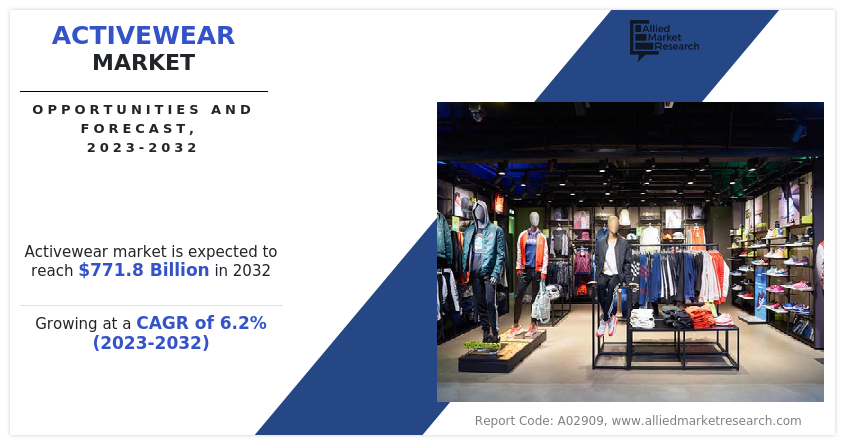
The global Activewear Market size was estimated at USD 425.5 billion in 2022 and is projected to reach USD 771.8 billion by 2032, growing at a CAGR of 6.2 % from 2023 to 2032. The activewear market is growing due to rising health consciousness, increasing participation in fitness and sports activities, growing athleisure trends, and greater availability of stylish, performance-oriented apparel. However, high competition from low-cost brands and fluctuating raw material prices remain key restraints, impacting profit margins and limiting premium activewear adoption despite strong demand driven by social media influencers and lifestyle branding.
The Activewear Market in North America held a significant share of over 40% in 2022.
The Activewear industry in the Canada is expected to grow significantly at a CAGR of 6.7% from 2023 to 2032.
By product type, the Rash Guard, Wet Suit, and Swim Wear segment is expected to be one of the fastest growing segments in the market during the forecast period and accounted for the revenue share of over 7% in 2022.
By fabric, the Polypropylene segment is the fastest growing segment in the market in during the forecast period.
Market Size & Forecast
2022 Market Size: USD 425.5 Billion
2032 Projected Market Size: USD 771.8 Billion
CAGR (2023-2032): 6.2%
North America: Largest market in 2022
Asia Pacific: Fastest growing market during analysis period
Extensive and unique advantages offered by activewear such as breathability, quick drying, static resistance, thermal resistance, and chemical resistance majorly drive the growth of the global activewear industry. In addition, rise in health consciousness among consumers and increase in sports & fitness enthusiasm among customers boost the demand for activewear. Moreover, rise in participation of consumers in sports activities fuels the sales of activewear, which positively impacts market growth. For instance, increase in the participation of customers in walking for fitness is leading to surge in sales of sports shoes and activewear shorts & t-shirts. Moreover, the holistic approach of customers toward athleisure wear is positively impacting the overall market growth. Furthermore, increase in fitness and sports consciousness among the young generation and upsurge in disposable income are some of the notable factors that support the market growth.
However, the volatile cost of raw materials and high cost of designing result in excessive cost of the final product, thereby declining sales of activewear among price-sensitive consumers. Furthermore, the availability of counterfeit brands causes inconvenience & safety issues for customers, which adversely impacts market growth. On the contrary, rise in several promotional activities is anticipated to create product & brand awareness, which accelerates the market growth. In addition, initiatives by various organizations such as rise in the number of activewear-related campaigns and programs are presumed to expand the consumer base. Moreover, the development of green textiles and their use in the formulation of activewear is expected to attract green consumers, which is anticipated to provide lucrative opportunities for market expansion. Large population size coupled with rise in disposable income is among the major factors that boost demand for high-end footwear in developing markets. Increase in sales through online channels, innovative product launches, attractive marketing, and promotional strategies are other factors that propel the overall sales of athletic footwear.
On the other hand, increase in environmental concerns and rise in prices of raw materials are the major challenges for players operating in the market. However, the market is anticipated to unfold attractive business opportunities, owing to changing consumer lifestyles and increasing penetration of online retailing. Consumers are becoming more health conscious due to work-related stress and lifestyle disorders. Thus, increase in the number of health-conscious consumers has created a strong demand for athletic sportswear and footwear, which, in turn, augments the activewear market opportunity for growth. Moreover, rise in the trend of fashionable sports apparel and continuous innovations in sportswear and footwear notably contribute toward the growth of the global market.
The COVID-19 pandemic brought all major sports such as football, cricket, rugby, and hockey to a halt. The outbreak of COVID-19 further forced governments to impose strict lockdowns, social distancing norms, traveling restrictions, and cancellation of all sporting events across the globe. All sports clubs and training centers were closed for a long time and people were forced to stay at home to contain the spread of the coronavirus. Under such circumstances, all stores dealing in athletic footwear, sportswear, accessories, and fitness apparel were shut down, and people were not allowed to involve in any kind of sports activities.
Increase in participation of kids and the geriatric population in outdoor sports is a key driver of the market. Playing outdoor sports has a low impact on joints and muscles, which makes it popular among geriatrics. Various health benefits associated with outdoor sports are improved aerobic fitness, muscular fitness, anaerobic endurance, and flexibility. Outdoor sports such as tennis further help in developing cognitive abilities such as attentional focus, eye-hand coordination, and anticipation. These benefits encourage parents to make their children participate in tennis. Moreover, schools and colleges promote playing tennis by organizing tennis tournaments. This encourages and boosts tennis participation among kids. These factors are responsible for the growth of the market. Moreover, increase in sales through online channels, innovative product launches, attractive marketing, and promotional strategies are other factors that propel the overall growth of the activewear market.
Segmental Overview
The global activewear market is segmented into product type, fabric, gender, distribution channel, and region. By product type, the market is classified into ready-to-wear; fashion outer, pants, & t-shirts; rash guard, wet suit, & swim wear; sports shoes, aqua shoes, & aqua socks; and fashion brand. On the basis of the fabric, it is categorized into polyester, nylon, neoprene, polypropylene, spandex, cotton, and others. By gender, the market is classified into men, women, and kids. Depending on the distribution channel, it is bifurcated into offline and online. Region wise, the market is analyzed across North America (the U.S., Canada, and Mexico), Europe (UK, Germany, France, Spain, Italy, and the rest of Europe), Asia-Pacific (China, Japan, India, South Korea, Australia, and the rest of Asia-Pacific), and LAMEA (Brazil, South Africa, Saudi Arabia, and rest of LAMEA).
By Product Type
According to the activewear market demand, on the basis of product type, the fashion outer, pants, & T-shirts segment gained a major share of the global market in 2022, and is expected to sustain its market share during the forecast period. With novel developments and advancements, the market for fashionable outerwear, pants, and clothing is growing at a rapid rate. Furthermore, there has been an increasing demand for stylish activewear that might be worn both inside and outside of the gym, alongside an emphasis on flexible layouts is offering additional choices to the consumers, which is expected to increase the overall sales.

By Fabric
On the basis of fabric, the polyester segment was the major share contributor in 2022 and is expected to continue this trend during the forecast period. Polyester has seen a significant increase in popularity as a raw material in the activewear industry due to its strong moisture-wicking characteristics, making it ideal for activewear. It effectively pulls perspiration away from the skin's surface, allowing for rapid evaporation while keeping the individual dry and comfortable throughout strenuous physical activity.

By Gender
On the basis of gender, the women segment was the major share contributor in 2022 and is expected to continue this trend during the forecast period. Surge in participation of women in outdoor activities and sports such as trekking, hiking, football, biking, and tennis has contributed toward the growth of the women's activewear market. The key players such as Adidas and Puma are continuously launching new and innovative products with new designs, vibrant colors, and styles to offer a wide range of choices to strengthen their product portfolio. This has encouraged female consumers to spend on these products, thereby fueling revenue generation.

By Distribution Channel
According to the distribution channel, the offline segment dominated the market in 2022, and is expected to sustain its market share during the activewear market forecast period. Offline stores have activewear of different price ranges that are not often accessible in online stores, making it easier for customers to locate and purchase the product. Customers benefit from the availability of several variants of activewear, discounts on certain brands, the aid of sales executives, and simple checkouts at offline stores.

By Region
Region wise, North America dominated the activewear market in 2022 and is expected to be dominant during the forecast period. The ongoing trend of having a fit body and a healthy lifestyle are some of the major factors driving the growth of the market in North America. In addition, increase in participation of baby boomers in fitness and physical activities has positively impacted the market growth. Thus, increase in interest of American youth in sports and stronger participation of this population in sports and fitness activities drive the activewear market growth in this region.

Competition Analysis
Players operating in the global market have adopted various developmental strategies to expand their activewear market share, increase profitability, and remain competitive in the market. The key players profiled in this report include Dick's Sporting Goods, INC., V.F. Corporation, Columbia Sporting Company, LULULEMON ATHLETICA INC., Puma SE, NIKE, INC., Adidas AG, Under Armour, Inc., Skechers U.S.A., INC., ASICS Corporation, PVH CORP., and The GAP, INC.
Some Examples of Acquisition in The Market
In February 2023, DICKS Sporting Goods, Inc., acquired Moosejaw, which is e-commerce retailer from Walmart. With this acquisition it will expand its retail presence in outdoor market, and will further enhance its digital channels and develop new relation with vendors.
In November 2021, ASICS corporation acquired Registration Logic Pty Ltd, a race registration which operates register now, a race register site. This will help in expanding consumer reach in the market.
In August 2021, The Gap, Inc., acquired Drapr, which is a e-commerce startup which allows customers to try on clothing virtually. With his acquisition it will help retailers reduce unnecessary returns and will further enhance customer experience.
In February 2021, Nike, Inc. acquired Datalogue to integrate data from all sources including the company's app ecosystem, supply chain, and enterprise data in a fast, seamless, easily accessible and standardized platform for their products.
In December 2020, V.F. Corporation acquired Supreme, which is a leading apparel and footwear brand. With this acquisition it has expanded its current product offering and has strengthened its business presence.
Some Examples of Expansion in The Market
In March 2023, Puma SE established Puma Nitro lab athlete testing facility in Frankfurt, Germany, developed in partnership with Hartmann Orthopedics & Sports. This will enable the company to develop customized products for its customers.
In January 2023, V.F. Corporation established new regional office in Harajuku district, Tokyo. With this it expand its innovative product design and support capabilities for its business in Asia-Pacific.
In January 2023, Adidas AG opened its concept store in Bengaluru, India. With this expansion it will strengthen its retail presence in the country.
In December 2022, Asics Corporation launched Asics retail stores in Gulf Cooperation Council (GCC), including countries Qatar, Bahrain. Under this expansion it will partner with Apparel Group, which is a leading apparel and fashion retailer in the region.
In December 2022, Adidas AG expanded its headquarters space in North America, with the objective of addressing the increasing growth of the company.
What are the Key Benefits for Stakeholders
- This report provides a quantitative analysis of the market segments, current trends, estimations, and dynamics of the activewear market analysis from 2022 to 2032 to identify the prevailing activewear market opportunities.
- The market research is offered along with information related to key drivers, restraints, and opportunities.
- Porter's five forces analysis highlights the potency of buyers and suppliers to enable stakeholders make profit-oriented business decisions and strengthen their supplier-buyer network.
- In-depth analysis of the activewear market segmentation assists to determine the prevailing market opportunities.
- Major countries in each region are mapped according to their revenue contribution to the global market.
- Market player positioning facilitates benchmarking and provides a clear understanding of the present position of the market players.
- The report includes the analysis of the regional as well as global activewear market trends, key players, market segments, application areas, and market growth strategies.
Activewear Market Report Highlights
| Aspects | Details |
| Market Size By 2032 | USD 771.8 billion |
| Growth Rate | CAGR of 6.2% |
| Forecast period | 2022 - 2032 |
| Report Pages | 320 |
| By Product Type |
|
| By Fabric |
|
| By Gender |
|
| By Distributional Channel |
|
| By Region |
|
| Key Market Players | The Gap, Inc., Under Armour, Inc., PVH Corp., Nike, Inc., V.F. Corporation, Puma SE, ASICS Corporation, DICKS Sporting Goods, Inc, lululemon athletica inc, Adidas AG, Skechers USA, Inc., Columbia Sportswear Company |
Analyst Review
As per the perspective of top-level CXOs, Asia-Pacific serves as the potential market for activewear, owing to the presence of large population base and high involvement of consumers in sports activities in countries such as India and China. Various kinds of athletic footwear include sports shoes (tennis, cricket, soccer, and similar other sports), running & walking shoes, hiking & backpacking shoes, and shoes worn for aerobics and gym. Within different types of sports shoes as mentioned above, tennis shoes are anticipated to witness greater adoption across the world, owing to their increasing usage as lifestyle and fashion footwear in countries such as the U.S. and Canada. Moreover, in emerging countries such as India and China, the adoption of sports shoes is expected to increase as a result of increasing participation in sports such as soccer and basketball. Government initiatives in these emerging economies have helped in popularizing various kinds of sports, leading to increase in demand for activewear and athletic footwear in Asia-Pacific. The demand for high-quality activewear is relatively lower in developing countries as compared to developed markets due to price sensitivity. Owing to implementation of stringent government regulations to curb pollution and increase in consciousness toward health and environmental sustainability, manufacturers are looking for ways to move their production units toward industrial areas. In addition, players have adopted product launch and acquisition as their growth strategies to further strengthen their foothold in the activewear market.
The activewear market size was valued at $425,514.3 million in 2022 and is projected to reach $771,781.5 million by 2032, growing at a CAGR of 6.2% from 2022 to 2031.
The global activewear market registered a CAGR of 6.2% from 2023 to 2032.
Raise the query and paste the link of the specific report and our sales executive will revert with the sample.
The forecast period in the activewear market report is from 2023 to 2032.
The top companies that hold the market share in the activewear market include Puma SE, Nike, Inc., Adidas AG, Under Armour, Inc., Skechers U.S.A., Inc, and others.
The activewear market report has 4 segments. The segments are product type, fabric, gender, and sales channel.
The emerging countries in the activewear market are likely to grow at a CAGR of more than 11.0% from 2023 to 2032.
Post-COVID-19, the activewear market is seeing new heights of growth as consumers use products as a regular exercise regimen to preserve their health, and the activewear manufacturers are likely to recover their losses in the next 1-2 years as demand for the products increases.
North America will dominate the activewear market by the end of 2032.
Loading Table Of Content...
Loading Research Methodology...

