Report Code: A03663 | Sep 2021 | Pages: 244 | ||
Tables: 137 | Charts: 66 |
|
Pandemic disrupted the entire world and affected many industries.
Get detailed COVID-19 impact analysis on the Adaptive Robotics Market
Request Now !
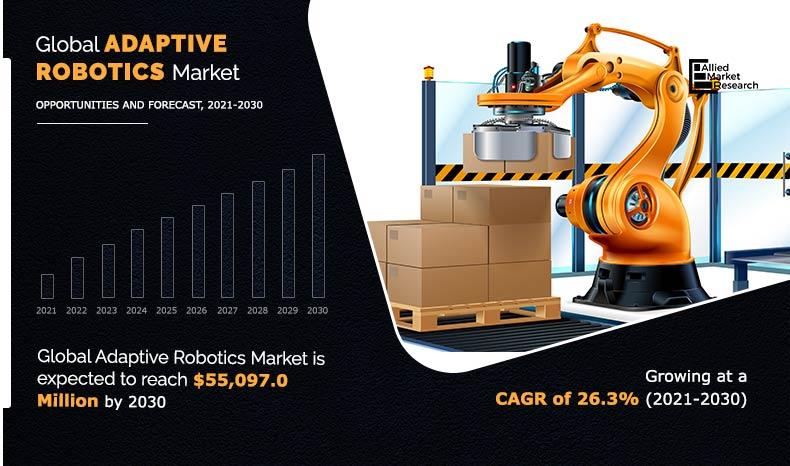
The adaptive robotics market size was valued at $4,974.3 million in 2020, and is expected to reach $ 55,097.0 million by 2030, registering a CAGR of 26.3% from 2021 to 2030. Adaptive robots are the advanced robots being used to reduce human efforts, maximize productivity, and quick decision maker. Adaptive robots are intelligent robots that use artificial intelligence (AI) and other industry 4.0 technologies to sense the data as per environment and take appropriate decision. In addition, they have the ability to learn from their surroundings and experience. They can build on competences on the basis of feedback database. These robots gain almost human-like intelligence without being overtly programmed. Further, they are used in various sectors such as electrical & electronics, chemical, rubber, automotive, and food & beverages industry.
The COVID-19 outbreak had affected the manufacturing of adaptive robotic systems in the first and second quarter of 2020. However, owing to adoption of touch-less operations in industries such as automotive, food & beverage and electronics the demand for adaptive robotics increased in the third and fourth quarter of 2020.
Increase in application of collaborative robots and industrial robots in various industries such as automotive and medical fuels the global adaptive robotics market growth. Adaptive robots interact with the surrounding and operate accordingly. They adopt change of path or direction of operation as per the changes in the working condition. In addition, rise in trend of automation in the manufacturing industry to carry out activities at faster pace has led to increase in demand for adaptive robotics. However, robotic systems that are deployed with robot end effectors are costly. Moreover, their installation in manufacturing industries incur additional cost. In addition, they are highly prone to damage while operating in heavy industries, wherein their replacement or repairing can cost a huge amount. Thus, all these factors act as the key deterrent factors of the global adaptive robotics market.
Rise in awareness regarding adopting adaptive robots in manufacturing sectors drives the growth of the global adaptive robotics market. Robotics technology is largely adopted in medical devices applications, automotive, and defense applications, which notably contributes toward the market growth. In addition, increase in spending on information and telecommunication spending in Italy grew by 21.7% from 2018 to 2020. Rapid industrialization and increase in government spending on infrastructural, and development of the robotics industry foster the growth of the global adaptive robot market. For instance, Thailand announced infrastructure plan over the period of 2016 to 2020. It further aims to spend $58.5 billion on new infrastructural developments by 2025. In addition, urbanization boosts renovation and reconstruction projects, which, in turn, is expected to boost the demolition industry. Therefore, use of automation and robotics is anticipated to propel growth of the global adaptive robotics market. Furthermore, integration of Internet of Things (IoT) is rapidly being adopted in the automation industry, which is anticipated to open new avenues for the adaptive robotics market.
During the outbreak of the COVID-19 pandemic, construction, manufacturing, hotel, and tourism industries were majorly affected. Manufacturing activities were halted or restricted. Construction and transportation activities, along with their supply chains, were hampered on a global level. This led to decline in manufacturing of robots as well as their demand in the market, thereby restraining the growth of the global adaptive robotics market. Conversely, industries are gradually resuming their regular manufacturing and services. This is expected to lead to re-initiation of adaptive robotics manufacturing companies at their full-scale capacities, which is likely to help the adaptive robotics market to recover by end of 2021.
The global adaptive robotics market is segmented into application, component, end user and region. By application, the market is segregated into handling, assembling, welding, and others. The handling segment dominated the market in 2020. On the basis of component, the market is segregated into hardware and software. Software segment dominates the market in 2020. Depending on end user, the market is fragmented into automotive, electronics, pharma, metal & machinery, and others. Automotive segment dominates the market in 2020.
Region wise, the global adaptive robotics market is analyzed across North America (U.S., Canada, and Mexico), Europe (Germany, France, Spain, Italy, and rest of Europe), Asia-Pacific (China, Japan, India, Indonesia, and rest of Asia-Pacific), and LAMEA (Latin America, the Middle East, and Africa). North America is expected to dominate the market throughout the forecast period.
The key players profiled in this report include ABB, Kuka AG, Robotiq Inc., SCHMALZ, Soft Robotics Inc., Weiss Robotics GmbH & Co Kg, Universal Robots A/S, Yaskawa Electric Corporation, SoftBank Group Corp, and Rethink Robotics GmbH.
Major players are adopting product launch and partnership as a key developmental strategies to improve the product portfolio of adaptive robotics products. For instance, in September 2021, Soft Robotics Inc. entered into a partnership with JMP Solutions, which deals in robotics and automation solutions. The partnership is aimed to improve the product portfolio of robotics solutions for food and beverages industry.
Key Benefits For Stakeholders
Adaptive Robotics Market Report Highlights
Aspects | Details |
---|---|
By Component |
|
By Application |
|
By End User |
|
By Geography |
|
Key Market Players | ABB, Universal Robots A/S, Flexiv Robotics Inc, Fanuc Corporation, SoftBank Group Corp, Mujin Inc, Rethink Robotics GmbH, SCHMALZ, Yaskawa Electric Corporation, KUKA AG, WEISS ROBOTICS GMBH & CO. KG, Soft Robotics Inc, Teradyne Inc (Energid Technologies Corporation), Robotiq Inc |
CHAPTER 1:INTRODUCTION
1.1.Report description
1.2.Key benefits for stakeholders
1.3.Key market segments
1.4.Key Market Players
1.5.Research methodology
1.5.1.Secondary research
1.5.2.Primary research
1.5.3.Analyst tools & models
CHAPTER 2:EXECUTIVE SUMMARY
2.1.Key Findings:
2.2.CXO perspective
CHAPTER 3:MARKET OVERVIEW
3.1.Market definition and scope
3.2.Key findings
3.2.1.Top investment pockets
3.2.2.Top winning strategies
3.3.Porter's five forces analysis
3.4.Market share analysis, 2020
3.5.Market dynamics
3.5.1.Drivers
3.5.1.1.Increase in applications of collaborative robots
3.5.1.2.Adoption of automation in manufacturing industries
3.5.1.3.Rapid industrialization and Automation
3.5.2.Restraints
3.5.2.1.High Cost of Robots
3.5.2.2.High Labor cost and Lack of Skilled Workforce
3.5.3.Opportunity
3.5.3.1.Integration of Internet of Things (IoT)
3.6.COVID-19 Impact analysis
CHAPTER 4:ADAPTIVE ROBOTICS MARKET, BY COMPONENT
4.1.Market overview
4.1.1.Market size and forecast, by component
4.2.Hardware
4.2.1.Key market trends, growth factors, and opportunities
4.2.2.Market size and forecast, by region
4.2.3.Market size and forecast, by type
4.2.4.Market analysis, by country
4.3.Software
4.3.1.Key market trends, growth factors, and opportunities
4.3.2.Market size and forecast, by region
4.3.3.Market size and forecast, by type
4.3.4.Market analysis, by country
CHAPTER 5:ADAPTIVE ROBOTICS MARKET, BY APPLICATION
5.1.Market overview
5.1.1.Market size and forecast, by application
5.2.Handling
5.2.1.Key market trends, growth factors, and opportunities
5.2.2.Market size and forecast, by region
5.2.3.Market analysis, by country
5.3.Assembling
5.3.1.Key market trends, growth factors, and opportunities
5.3.2.Market size and forecast, by region
5.3.3.Market analysis, by country
5.4.Welding
5.4.1.Key market trends, growth factors, and opportunities
5.4.2.Market size and forecast, by region
5.4.3.Market analysis, by country
5.5.Others
5.5.1.Key market trends, growth factors, and opportunities
5.5.2.Market size and forecast, by region
5.5.3.Market analysis, by country
CHAPTER 6:ADAPTIVE ROBOTICS MARKET, BY END USER
6.1.Market overview
6.1.1.Market size and forecast, by end user
6.2.Automotive
6.2.1.Key market trends, growth factors, and opportunities
6.2.2.Market size and forecast, by region
6.2.3.Market analysis, by country
6.3.Electronics
6.3.1.Key market trends, growth factors, and opportunities
6.3.2.Market size and forecast, by region
6.3.3.Market analysis, by country
6.4.Pharma
6.4.1.Key market trends, growth factors, and opportunities
6.4.2.Market size and forecast, by region
6.4.3.Market analysis, by country
6.5.Metal & machinery
6.5.1.Key market trends, growth factors, and opportunities
6.5.2.Market size and forecast, by region
6.5.3.Market analysis, by country
6.6.Others
6.6.1.Key market trends, growth factors, and opportunities
6.6.2.Market size and forecast, by region
6.6.3.Market analysis, by country
CHAPTER 7:ADAPTIVE ROBOTICS MARKET, BY REGION
7.1.Market overview
7.1.1.Market size and forecast, by region
7.1.2.North America
7.1.3.Key market trends, growth factors, and opportunities
7.1.4.Market size and forecast, by component
7.1.4.1.North America market size and forecast for hardware, by type
7.1.4.2.North America market size and forecast for software, by type
7.1.5.Market size and forecast, by application
7.1.6.Market size and forecast, by end user
7.1.7.Market size and forecast, by country
7.1.7.1.U.S.
7.1.7.1.1.Market size and forecast, by component
7.1.7.1.2.Market size and forecast, by application
7.1.7.1.3.Market size and forecast, by end user
7.1.7.2.Canada
7.1.7.2.1.Market size and forecast, by component
7.1.7.2.2.Market size and forecast, by application
7.1.7.2.3.Market size and forecast, by end user
7.1.7.3.Mexico
7.1.7.3.1.Market size and forecast, by component
7.1.7.3.2.Market size and forecast, by application
7.1.7.3.3.Market size and forecast, by end user
7.2.Europe
7.2.1.Key market trends, growth factors, and opportunities
7.2.2.Market size and forecast, by component
7.2.2.1.Europe market size and forecast for hardware, by type
7.2.2.2.Europe market size and forecast for software, by type
7.2.3.Market size and forecast, by application
7.2.4.Market size and forecast, by end user
7.2.5.Market size and forecast, by country
7.2.5.1.Germany
7.2.5.1.1.Market size and forecast, by component
7.2.5.1.2.Market size and forecast, by application
7.2.5.1.3.Market size and forecast, by end user
7.2.5.2.France
7.2.5.2.1.Market size and forecast, by component
7.2.5.2.2.Market size and forecast, by application
7.2.5.2.3.Market size and forecast, by end user
7.2.5.3.Italy
7.2.5.3.1.Market size and forecast, by component
7.2.5.3.2.Market size and forecast, by application
7.2.5.3.3.Market size and forecast, by end user
7.2.5.4.Spain
7.2.5.4.1.Market size and forecast, by component
7.2.5.4.2.Market size and forecast, by application
7.2.5.4.3.Market size and forecast, by end user
7.2.5.5.Rest of Europe
7.2.5.5.1.Market size and forecast, by component
7.2.5.5.2.Market size and forecast, by application
7.2.5.5.3.Market size and forecast, by end user
7.3.Asia-Pacific
7.3.1.Key market trends, growth factors, and opportunities
7.3.2.Market size and forecast, by component
7.3.2.1.Asia-Pacific market size and forecast for hardware, by type
7.3.2.2.Asia-Pacific market size and forecast for software, by type
7.3.3.Market size and forecast, by application
7.3.4.Market size and forecast, by end user
7.3.5.Market size and forecast, by country
7.3.5.1.China
7.3.5.1.1.Market size and forecast, by component
7.3.5.1.2.Market size and forecast, by application
7.3.5.1.3.Market size and forecast, by end user
7.3.5.2.Japan
7.3.5.2.1.Market size and forecast, by component
7.3.5.2.2.Market size and forecast, by application
7.3.5.2.3.Market size and forecast, by end user
7.3.5.3.South Korea
7.3.5.3.1.Market size and forecast, by component
7.3.5.3.2.Market size and forecast, by application
7.3.5.3.3.Market size and forecast, by end user
7.3.5.4.India
7.3.5.4.1.Market size and forecast, by component
7.3.5.4.2.Market size and forecast, by application
7.3.5.4.3.Market size and forecast, by end user
7.3.5.5.Rest of Asia-Pacific
7.3.5.5.1.Market size and forecast, by component
7.3.5.5.2.Market size and forecast, by application
7.3.5.5.3.Market size and forecast, by end user
7.4.LAMEA
7.4.1.Key market trends, growth factors, and opportunities
7.4.2.Market size and forecast, by component
7.4.2.1.LAMEA market size and forecast for hardware, by type
7.4.2.2.LAMEA market size and forecast for software, by type
7.4.3.Market size and forecast, by application
7.4.4.Market size and forecast, by end user
7.4.5.Market size and forecast, by country
7.4.5.1.Latin America
7.4.5.1.1.Market size and forecast, by component
7.4.5.1.2.Market size and forecast, by application
7.4.5.1.3.Market size and forecast, by end user
7.4.5.2.Middle East
7.4.5.2.1.Market size and forecast, by component
7.4.5.2.2.Market size and forecast, by application
7.4.5.2.3.Market size and forecast, by end user
7.4.5.3.Africa
7.4.5.3.1.Market size and forecast, by component
7.4.5.3.2.Market size and forecast, by application
7.4.5.3.3.Market size and forecast, by end user
CHAPTER 8:COMPANY PROFILES
8.1.ABB
8.1.1.Company overview
8.1.2.Key executives
8.1.3.Company snapshot
8.1.4.Operating business categories
8.1.5.Product portfolio
8.1.6.R&D expenditure
8.1.7.Business performance
8.1.8.Key strategic moves and developments
8.2.Fanuc Corporation
8.2.1.Company overview
8.2.2.Key executives
8.2.3.Company snapshot
8.2.4.Operating business segments
8.2.5.Product portfolio
8.2.6.R&D expenditure
8.2.7.Business performance
8.2.8.Key strategic moves and developments
8.3.Flexiv Robotics Inc
8.3.1.Company overview
8.3.2.Key executives
8.3.3.Company snapshot
8.3.4.Product portfolio
8.3.5.Key strategic moves and developments
8.4.KUKA AG
8.4.1.Company overview
8.4.2.Key executives
8.4.3.Company snapshot
8.4.4.Operating business segments
8.4.5.Product portfolio
8.4.6.R&D expenditure
8.4.7.Business performance
8.5.Mujin Inc
8.5.1.Company overview
8.5.2.Key executives
8.5.3.Company snapshot
8.5.4.Product portfolio
8.6.Rethink Robotics GmbH
8.6.1.Company overview
8.6.2.Key executives
8.6.3.Company snapshot
8.6.4.Product portfolio
8.7.Robotiq Inc
8.7.1.Company overview
8.7.2.Key executives
8.7.3.Company snapshot
8.7.4.Product portfolio
8.7.5.Key strategic moves and developments
8.8.SCHMALZ
8.8.1.Company overview
8.8.2.Key executives
8.8.3.Company snapshot
8.8.4.Product portfolio
8.9.Soft Robotics Inc
8.9.1.Company overview
8.9.2.Key executives
8.9.3.Company snapshot
8.9.4.Product portfolio
8.9.5.Key strategic moves and developments
8.10.SoftBank Group Corp
8.10.1.Company overview
8.10.2.Key executives
8.10.3.Company snapshot
8.10.4.Operating business segments
8.10.5.Product portfolio
8.10.6.R&D expenditure
8.10.7.Business performance
8.11.Teradyne Inc (Energid Technologies Corporation)
8.11.1.Company overview
8.11.2.Key executives
8.11.3.Company snapshot
8.11.4.Operating business segments
8.11.5.Product portfolio
8.11.6.Business performance
8.12.Universal Robots A/S
8.12.1.Company overview
8.12.2.Key executives
8.12.3.Company snapshot
8.12.4.Product portfolio
8.13.WEISS ROBOTICS GMBH & CO. KG
8.13.1.Company overview
8.13.2.Key executive
8.13.3.Company snapshot
8.13.4.Product portfolio
8.14.Yaskawa Electric Corporation
8.14.1.Company overview
8.14.2.Key executives
8.14.3.Company snapshot
8.14.4.Operating business segments
8.14.5.Product portfolio
8.14.6.R&D expenditure
8.14.7.Business performance
8.14.8.Key strategic moves and developments
LIST OF TABLES
TABLE 01.ADAPTIVE ROBOTICS MARKET REVENUE, BY COMPONENT, 2020-2030 ($MILLION)
TABLE 02.ADAPTIVE ROBOTICS MARKET REVENUE FOR HARDWARE, BY REGION, 2020-2030 ($MILLION)
TABLE 03.ADAPTIVE ROBOTICS MARKET REVENUE FOR HARDWARE, BY TYPE, 2020–2030 ($MILLION)
TABLE 04.ADAPTIVE ROBOTICS MARKET REVENUE FOR SOFTWARE, BY REGION, 2020-2030 ($MILLION)
TABLE 05.ADAPTIVE ROBOTICS MARKET REVENUE FOR SOFTWARE, BY TYPE, 2020–2030 ($MILLION)
TABLE 06.ADAPTIVE ROBOTICS MARKET REVENUE, BY APPLICATION, 2020-2030 ($MILLION)
TABLE 07.ADAPTIVE ROBOTICS MARKET REVENUE FOR HANDLING, BY REGION, 2020-2030 ($MILLION)
TABLE 08.ADAPTIVE ROBOTICS MARKET REVENUE FOR ASSEMBLING, BY REGION, 2020-2030 ($MILLION)
TABLE 09.ADAPTIVE ROBOTICS MARKET REVENUE FOR WELDING, BY REGION, 2020-2030 ($MILLION)
TABLE 10.ADAPTIVE ROBOTICS MARKET REVENUE FOR OTHERS, BY REGION, 2020-2030 ($MILLION)
TABLE 11.ADAPTIVE ROBOTICS MARKET REVENUE, BY END USER, 2020-2030 ($MILLION)
TABLE 12.ADAPTIVE ROBOTICS MARKET REVENUE FOR AUTOMOTIVE, BY REGION, 2020-2030 ($MILLION)
TABLE 13.ADAPTIVE ROBOTICS MARKET REVENUE FOR ELECTRONICS, BY REGION, 2020-2030 ($MILLION)
TABLE 14.ADAPTIVE ROBOTICS MARKET REVENUE FOR FOOD & BEVERAGE, BY REGION, 2020-2030 ($MILLION)
TABLE 15.ADAPTIVE ROBOTICS MARKET REVENUE FOR METAL & MACHINERY, BY REGION, 2020-2030 ($MILLION)
TABLE 16.ADAPTIVE ROBOTICS MARKET REVENUE FOR OTHERS, BY REGION, 2020-2030 ($MILLION)
TABLE 17.ADAPTIVE ROBOTICS MARKET, BY REGION, 2020-2030 ($MILLION)
TABLE 18.NORTH AMERICA ADAPTIVE ROBOTICS MARKET, BY TYPE, 2020-2030 ($MILLION)
TABLE 19.NORTH AMERICA ADAPTIVE ROBOTICS MARKET REVENUE FOR HARDWARE, BY TYPE, 2020–2030 ($MILLION)
TABLE 20.NORTH AMERICA ADAPTIVE ROBOTICS MARKET REVENUE FOR SOFTWARE, BY TYPE, 2020–2030 ($MILLION)
TABLE 21.NORTH AMERICA ADAPTIVE ROBOTICS MARKET, BY APPLICATION, 2020-2030 ($MILLION)
TABLE 22.NORTH AMERICA ADAPTIVE ROBOTICS MARKET, BY END USER, 2020-2030 ($MILLION)
TABLE 23.NORTH AMERICA ADAPTIVE ROBOTICS MARKET, BY COUNTRY, 2020-2030 ($MILLION)
TABLE 24.U.S. ADAPTIVE ROBOTICS MARKET, BY COMPONENT, 2020-2030 ($MILLION)
TABLE 25.U.S. ADAPTIVE ROBOTICS MARKET, BY APPLICATION, 2020-2030 ($MILLION)
TABLE 26.U.S. ADAPTIVE ROBOTICS MARKET, BY END USER, 2020-2030 ($MILLION)
TABLE 27.CANADA ADAPTIVE ROBOTICS MARKET, BY COMPONENT, 2020-2030 ($MILLION)
TABLE 28.CANADA ADAPTIVE ROBOTICS MARKET, BY APPLICATION, 2020-2030 ($MILLION)
TABLE 29.CANADA ADAPTIVE ROBOTICS MARKET, BY END USER, 2020-2030 ($MILLION)
TABLE 30.MEXICO ADAPTIVE ROBOTICS MARKET, BY COMPONENT, 2020-2030 ($MILLION)
TABLE 31.MEXICO ADAPTIVE ROBOTICS MARKET, BY APPLICATION, 2020-2030 ($MILLION)
TABLE 32.MEXICO ADAPTIVE ROBOTICS MARKET, BY END USER, 2020-2030 ($MILLION)
TABLE 33.EUROPE ADAPTIVE ROBOTICS MARKET, BY TYPE, 2020-2030 ($MILLION)
TABLE 34.EUROPE ADAPTIVE ROBOTICS MARKET REVENUE FOR HARDWARE, BY TYPE, 2020–2030 ($MILLION)
TABLE 35.EUROPE ADAPTIVE ROBOTICS MARKET REVENUE FOR SOFTWARE, BY TYPE, 2020–2030 ($MILLION)
TABLE 36.EUROPE ADAPTIVE ROBOTICS MARKET, BY APPLICATION, 2020-2030 ($MILLION)
TABLE 37.EUROPE ADAPTIVE ROBOTICS MARKET, BY END USER, 2020-2030 ($MILLION)
TABLE 38.EUROPE ADAPTIVE ROBOTICS MARKET, BY COUNTRY, 2020-2030 ($MILLION)
TABLE 39.GERMANY ADAPTIVE ROBOTICS MARKET, BY COMPONENT, 2020-2030 ($MILLION)
TABLE 40.GERMANY ADAPTIVE ROBOTICS MARKET, BY APPLICATION, 2020-2030 ($MILLION)
TABLE 41.GERMANY ADAPTIVE ROBOTICS MARKET, BY END USER, 2020-2030 ($MILLION)
TABLE 42.FRANCE ADAPTIVE ROBOTICS MARKET, BY COMPONENT, 2020-2030 ($MILLION)
TABLE 43.FRANCE ADAPTIVE ROBOTICS MARKET, BY APPLICATION, 2020-2030 ($MILLION)
TABLE 44.FRANCE ADAPTIVE ROBOTICS MARKET, BY END USER, 2020-2030 ($MILLION)
TABLE 45.ITALY ADAPTIVE ROBOTICS MARKET, BY COMPONENT, 2020-2030 ($MILLION)
TABLE 46.ITALY ADAPTIVE ROBOTICS MARKET, BY APPLICATION, 2020-2030 ($MILLION)
TABLE 47.ITALY ADAPTIVE ROBOTICS MARKET, BY END USER, 2020-2030 ($MILLION)
TABLE 48.SPAIN ADAPTIVE ROBOTICS MARKET, BY COMPONENT, 2020-2030 ($MILLION)
TABLE 49.SPAIN ADAPTIVE ROBOTICS MARKET, BY APPLICATION, 2020-2030 ($MILLION)
TABLE 50.SPAIN ADAPTIVE ROBOTICS MARKET, BY END USER, 2020-2030 ($MILLION)
TABLE 51.REST OF EUROPE ADAPTIVE ROBOTICS MARKET, BY COMPONENT, 2020-2030 ($MILLION)
TABLE 52.REST OF EUROPE ADAPTIVE ROBOTICS MARKET, BY APPLICATION, 2020-2030 ($MILLION)
TABLE 53.REST OF EUROPE ADAPTIVE ROBOTICS MARKET, BY END USER, 2020-2030 ($MILLION)
TABLE 54.ASIA-PACIFIC ADAPTIVE ROBOTICS MARKET, BY TYPE, 2020-2030 ($MILLION)
TABLE 55.ASIA-PACIFIC ADAPTIVE ROBOTICS MARKET REVENUE FOR HARDWARE, BY TYPE, 2020–2030 ($MILLION)
TABLE 56.ASIA-PACIFIC ADAPTIVE ROBOTICS MARKET REVENUE FOR SOFTWARE, BY TYPE, 2020–2030 ($MILLION)
TABLE 57.ASIA-PACIFIC ADAPTIVE ROBOTICS MARKET, BY APPLICATION, 2020-2030 ($MILLION)
TABLE 58.ASIA-PACIFIC ADAPTIVE ROBOTICS MARKET, BY END USER, 2020-2030 ($MILLION)
TABLE 59.ASIA-PACIFIC ADAPTIVE ROBOTICS MARKET, BY COUNTRY, 2020-2030 ($MILLION)
TABLE 60.CHINA ADAPTIVE ROBOTICS MARKET, BY COMPONENT, 2020-2030 ($MILLION)
TABLE 61.CHINA ADAPTIVE ROBOTICS MARKET, BY APPLICATION, 2020-2030 ($MILLION)
TABLE 62.CHINA ADAPTIVE ROBOTICS MARKET, BY END USER, 2020-2030 ($MILLION)
TABLE 63.JAPAN ADAPTIVE ROBOTICS MARKET, BY COMPONENT, 2020-2030 ($MILLION)
TABLE 64.JAPAN ADAPTIVE ROBOTICS MARKET, BY APPLICATION, 2020-2030 ($MILLION)
TABLE 65.JAPAN ADAPTIVE ROBOTICS MARKET, BY END USER, 2020-2030 ($MILLION)
TABLE 66.SOUTH KOREA ADAPTIVE ROBOTICS MARKET, BY COMPONENT, 2020-2030 ($MILLION)
TABLE 67.SOUTH KOREA ADAPTIVE ROBOTICS MARKET, BY APPLICATION, 2020-2030 ($MILLION)
TABLE 68.SOUTH KOREA ADAPTIVE ROBOTICS MARKET, BY END USER, 2020-2030 ($MILLION)
TABLE 69.INDIA ADAPTIVE ROBOTICS MARKET, BY COMPONENT, 2020-2030 ($MILLION)
TABLE 70.INDIA ADAPTIVE ROBOTICS MARKET, BY APPLICATION, 2020-2030 ($MILLION)
TABLE 71.INDIA ADAPTIVE ROBOTICS MARKET, BY END USER, 2020-2030 ($MILLION)
TABLE 72.REST OF ASIA-PACIFIC ADAPTIVE ROBOTICS MARKET, BY COMPONENT, 2020-2030 ($MILLION)
TABLE 73.REST OF ASIA-PACIFIC ADAPTIVE ROBOTICS MARKET, BY APPLICATION, 2020-2030 ($MILLION)
TABLE 74.REST OF ASIA-PACIFIC ADAPTIVE ROBOTICS MARKET, BY END USER, 2020-2030 ($MILLION)
TABLE 75.LAMEA ADAPTIVE ROBOTICS MARKET, BY TYPE, 2020-2030 ($MILLION)
TABLE 76.LAMEA ADAPTIVE ROBOTICS MARKET REVENUE FOR HARDWARE, BY TYPE, 2020–2030 ($MILLION)
TABLE 77.LAMEA ADAPTIVE ROBOTICS MARKET REVENUE FOR SOFTWARE, BY TYPE, 2020–2030 ($MILLION)
TABLE 78.LAMEA ADAPTIVE ROBOTICS MARKET, BY APPLICATION, 2020-2030 ($MILLION)
TABLE 79.LAMEA ADAPTIVE ROBOTICS MARKET, BY END USER, 2020-2030 ($MILLION)
TABLE 80.LAMEA ADAPTIVE ROBOTICS MARKET, BY COUNTRY, 2020-2030 ($MILLION)
TABLE 81.LATIN AMERICA ADAPTIVE ROBOTICS MARKET, BY COMPONENT, 2020-2030 ($MILLION)
TABLE 82.LATIN AMERICA ADAPTIVE ROBOTICS MARKET, BY APPLICATION, 2020-2030 ($MILLION)
TABLE 83.LATIN AMERICA ADAPTIVE ROBOTICS MARKET, BY END USER, 2020-2030 ($MILLION)
TABLE 84.MIDDLE EAST ADAPTIVE ROBOTICS MARKET, BY COMPONENT, 2020-2030 ($MILLION)
TABLE 85.MIDDLE EAST ADAPTIVE ROBOTICS MARKET, BY APPLICATION, 2020-2030 ($MILLION)
TABLE 86.MIDDLE EAST ADAPTIVE ROBOTICS MARKET, BY END USER, 2020-2030 ($MILLION)
TABLE 87.AFRICA ADAPTIVE ROBOTICS MARKET, BY COMPONENT, 2020-2030 ($MILLION)
TABLE 88.AFRICA ADAPTIVE ROBOTICS MARKET, BY APPLICATION, 2020-2030 ($MILLION)
TABLE 89.AFRICA ADAPTIVE ROBOTICS MARKET, BY END USER, 2020-2030 ($MILLION)
TABLE 90.ABB: KEY EXECUTIVES
TABLE 91.ABB: COMPANY SNAPSHOT
TABLE 92.ABB: CATEGORIES SEGMENTS
TABLE 93.ABB: PRODUCT PORTFOLIO
TABLE 94.FANUC CORPORATION: KEY EXECUTIVES
TABLE 95.FANUC CORPORATION: COMPANY SNAPSHOT
TABLE 96.FANUC CORPORATION: OPERATING SEGMENTS
TABLE 97.FANUC CORPORATION: PRODUCT PORTFOLIO
TABLE 98.FLEXIV ROBOTICS CORPORATION: KEY EXECUTIVES
TABLE 99.FLEXIV ROBOTICS INC: COMPANY SNAPSHOT
TABLE 100.FLEXIV ROBOTICS INC: PRODUCT PORTFOLIO
TABLE 101.KUKA AG: KEY EXECUTIVES
TABLE 102.KUKA AG: COMPANY SNAPSHOT
TABLE 103.KUKA AG: OPERATING SEGMENTS
TABLE 104.KUKA AG: PRODUCT PORTFOLIO
TABLE 105.MUJIN INC: KEY EXECUTIVES
TABLE 106.MUJIN INC: COMPANY SNAPSHOT
TABLE 107.MUJIN INC: PRODUCT PORTFOLIO
TABLE 108.RETHINK ROBOTICS GMBH: KEY EXECUTIVES
TABLE 109.RETHINK ROBOTICS GMBH: COMPANY SNAPSHOT
TABLE 110.RETHINK ROBOTICS GMBH: PRODUCT PORTFOLIO
TABLE 111.ROBOTIQ INC: KEY EXECUTIVES
TABLE 112.ROBOTIQ INC: COMPANY SNAPSHOT
TABLE 113.ROBOTIQ INC: PRODUCT PORTFOLIO
TABLE 114.SCHMALZ: KEY EXECUTIVES
TABLE 115.SCHMALZ: COMPANY SNAPSHOT
TABLE 116.SCHMALZ: PRODUCT PORTFOLIO
TABLE 117.SOFT ROBOTICS INC: KEY EXECUTIVES
TABLE 118.SOFT ROBOTICS INC: COMPANY SNAPSHOT
TABLE 119.SOFT ROBOTICS INC: PRODUCT PORTFOLIO
TABLE 120.SOFTBANK GROUP CORP: KEY EXECUTIVES
TABLE 121.SOFTBANK GROUP CORP: COMPANY SNAPSHOT
TABLE 122.SOFTBANK GROUP CORP: OPERATING SEGMENTS
TABLE 123.SOFTBANK GROUP CORP: PRODUCT PORTFOLIO
TABLE 124.TERADYNE INC: KEY EXECUTIVES
TABLE 125.TERADYNE INC: COMPANY SNAPSHOT
TABLE 126.TERADYNE INC: OPERATING SEGMENTS
TABLE 127.ENERGID TECHNOLOGIES CORPORATION: PRODUCT PORTFOLIO
TABLE 128.UNIVERSAL ROBOTS A/S: KEY EXECUTIVES
TABLE 129.UNIVERSAL ROBOTS A/S: COMPANY SNAPSHOT
TABLE 130.UNIVERSAL ROBOTS A/S: PRODUCT PORTFOLIO
TABLE 131.WEISS ROBOTICS GMBH & CO. KG: KEY EXECUTIVE
TABLE 132.WEISS ROBOTICS GMBH & CO. KG: COMPANY SNAPSHOT
TABLE 133.WEISS ROBOTICS GMBH & CO. KG: PRODUCT PORTFOLIO
TABLE 134.YASKAWA ELECTRIC CORPORATION: KEY EXECUTIVES
TABLE 135.YASKAWA ELECTRIC CORPORATION: COMPANY SNAPSHOT
TABLE 136.YASKAWA ELECTRIC CORPORATION: OPERATING SEGMENTS
TABLE 137.YASKAWA ELECTRIC CORPORATION: PRODUCT PORTFOLIO
LIST OF FIGURES
FIGURE 01.KEY MARKET SEGMENTS
FIGURE 02.EXECUTIVE SUMMARY
FIGURE 03.TOP INVESTMENT POCKET
FIGURE 04.TOP WINNING STRATEGIES, BY YEAR, 2018-2021
FIGURE 05.TOP WINNING STRATEGIES, BY DEVELOPMENT, 2018-2021
FIGURE 06.TOP WINNING STRATEGIES, BY COMPANY, 2018-2021
FIGURE 07.MODERATE-TO-HIGH BARGAINING POWER OF SUPPLIERS
FIGURE 08.MODERATE-TO-HIGH BARGAINING POWER OF BUYERS
FIGURE 09.MODERATE-TO-HIGH THREAT OF SUBSTITUTES
FIGURE 10.MODERATE-TO-HIGH THREAT OF NEW ENTRANTS
FIGURE 11.MODERATE-TO-HIGH COMPETITIVE RIVALRY
FIGURE 12.MARKET SHARE ANALYSIS
FIGURE 13.GLOBAL ADAPTIVE ROBOTICS MARKET: MARKET DYNAMICS
FIGURE 14.GLOBAL ADAPTIVE ROBOTICS MARKET, BY COMPONENT, 2020-2030
FIGURE 15.COMPARATIVE SHARE ANALYSIS OF ADAPTIVE MARKET FOR HARDWARE, BY COUNTRY, 2020 & 2030 (%)
FIGURE 16.COMPARATIVE SHARE ANALYSIS OF ADAPTIVE ROBOTS MARKET FOR SOFTWARE, BY COUNTRY, 2020 & 2030 (%)
FIGURE 17.ADAPTIVE ROBOTICS MARKET, BY APPLICATION, 2020-2030
FIGURE 18.COMPARATIVE SHARE ANALYSIS OF ADAPTIVE ROBOTICS MARKET FOR HANDLING, BY COUNTRY, 2020 & 2030 (%)
FIGURE 19.COMPARATIVE SHARE ANALYSIS OF ADAPTIVE ROBOTICS MARKET FOR ASSEMBLING, BY COUNTRY, 2020 & 2030 (%)
FIGURE 20.COMPARATIVE SHARE ANALYSIS OF ADAPTIVE ROBOTICS MARKET FOR WELDING, BY COUNTRY, 2020 & 2030 (%)
FIGURE 21.COMPARATIVE SHARE ANALYSIS OF ADAPTIVE ROBOTICS MARKET FOR OTHERS, BY COUNTRY, 2020 & 2030 (%)
FIGURE 22.GLOBAL ADAPTIVE ROBOTICS MARKET, BY END USER, 2020-2030
FIGURE 23.COMPARATIVE SHARE ANALYSIS OF ADAPTIVE ROBOTICS MARKET FOR AUTOMOTIVE, BY COUNTRY, 2020 & 2030 (%)
FIGURE 24.COMPARATIVE SHARE ANALYSIS OF ADAPTIVE ROBOTICS MARKET FOR ELECTRONICS, BY COUNTRY, 2020 & 2030 (%)
FIGURE 25.COMPARATIVE SHARE ANALYSIS OF ADAPTIVE ROBOTICS MARKET FOR FOOD & BEVERAGE, BY COUNTRY, 2020 & 2030 (%)
FIGURE 26.COMPARATIVE SHARE ANALYSIS OF ADAPTIVE ROBOTICS MARKET FOR METAL & MACHINERY, BY COUNTRY, 2020 & 2030 (%)
FIGURE 27.COMPARATIVE SHARE ANALYSIS OF ADAPTIVE ROBOTICS MARKET FOR OTHERS, BY COUNTRY, 2020 & 2030 (%)
FIGURE 28.ADAPTIVE ROBOTICS MARKET, BY REGION, 2020-2030
FIGURE 29.U.S. ADAPTIVE ROBOTICS MARKET REVENUE, 2020-2030 ($MILLION)
FIGURE 30.CANADA ADAPTIVE ROBOTICS MARKET REVENUE, 2020-2030 ($MILLION)
FIGURE 31.MEXICO ADAPTIVE ROBOTICS MARKET REVENUE, 2020-2030 ($MILLION)
FIGURE 32.GERMANY ADAPTIVE ROBOTICS MARKET REVENUE, 2020-2030 ($MILLION)
FIGURE 33.FRANCE ADAPTIVE ROBOTICS MARKET REVENUE, 2020-2030 ($MILLION)
FIGURE 34.ITALY ADAPTIVE ROBOTICS MARKET REVENUE, 2020-2030 ($MILLION)
FIGURE 35.SPAIN ADAPTIVE ROBOTICS MARKET REVENUE, 2020-2030 ($MILLION)
FIGURE 36.REST OF EUROPE ADAPTIVE ROBOTICS MARKET REVENUE, 2020-2030 ($MILLION)
FIGURE 37.CHINA ADAPTIVE ROBOTICS MARKET REVENUE, 2020-2030 ($MILLION)
FIGURE 38.JAPAN ADAPTIVE ROBOTICS MARKET REVENUE, 2020-2030 ($MILLION)
FIGURE 39.SOUTH KOREA ADAPTIVE ROBOTICS MARKET REVENUE, 2020-2030 ($MILLION)
FIGURE 40.INDIA ADAPTIVE ROBOTICS MARKET REVENUE, 2020-2030 ($MILLION)
FIGURE 41.REST OF ASIA-PACIFIC ADAPTIVE ROBOTICS MARKET REVENUE, 2020-2030 ($MILLION)
FIGURE 42.LATIN AMERICA ADAPTIVE ROBOTICS MARKET REVENUE, 2020-2030 ($MILLION)
FIGURE 43.MIDDLE EAST ADAPTIVE ROBOTICS MARKET REVENUE, 2020-2030 ($MILLION)
FIGURE 44.AFRICA ADAPTIVE ROBOTICS MARKET REVENUE, 2020-2030 ($MILLION)
FIGURE 45.ABB: R&D EXPENDITURE, 2018–2020 ($MILLION)
FIGURE 46.ABB: NET SALES, 2018–2020 ($MILLION)
FIGURE 47.ABB: REVENUE SHARE BY SEGMENT, 2020 (%)
FIGURE 48.ABB: REVENUE SHARE BY REGION, 2020 (%)
FIGURE 49.FANUC CORPORATION: R&D EXPENDITURE, 2018–2020 ($MILLION)
FIGURE 50.FANUC CORPORATION: NET SALES, 2018–2020 ($MILLION)
FIGURE 51.FANUC CORPORATION: REVENUE SHARE BY SEGMENT, 2020 (%)
FIGURE 52.FANUC CORPORATION: REVENUE SHARE BY REGION, 2020 (%)
FIGURE 53.KUKA AG: R&D EXPENDITURE, 2018–2020 ($MILLION)
FIGURE 54.KUKA AG: NET SALES, 2018–2020 ($MILLION)
FIGURE 55.KUKA AG: REVENUE SHARE BY SEGMENT, 2020 (%)
FIGURE 56.KUKA AG: REVENUE SHARE BY REGION, 2020 (%)
FIGURE 57.SOFTBANK GROUP CORP: R&D EXPENDITURE, 2019–2021 ($MILLION)
FIGURE 58.SOFTBANK GROUP CORP: NET SALES, 2019–2021 ($MILLION)
FIGURE 59.SOFTBANK GROUP CORP: REVENUE SHARE BY SEGMENT, 2021 (%)
FIGURE 60.SOFTBANK GROUP CORP: REVENUE SHARE BY REGION, 2021 (%)
FIGURE 61.TERADYNE INC: NET SALES, 2018–2020 ($MILLION)
FIGURE 62.TERADYNE INC: REVENUE SHARE BY SEGMENT, 2020 (%)
FIGURE 63.YASKAWA ELECTRIC CORPORATION: R&D EXPENDITURE, 2019–2021 ($MILLION)
FIGURE 64.YASKAWA ELECTRIC CORPORATION: NET SALES, 2019–2021 ($MILLION)
FIGURE 65.YASKAWA ELECTRIC CORPORATION: REVENUE SHARE BY SEGMENT, 2021 (%)
FIGURE 66.YASKAWA ELECTRIC CORPORATION: REVENUE SHARE BY REGION, 2021 (%)
The adaptive robotics market was valued at $4,974.3 million in 2020, and is expected to reach $ 55,097.0 million by 2030, registering a CAGR of 26.3% from 2021 to 2030.
Rise in demand for artificial intelligence (AI), and Internet of Things (IoT)-enabled robots, owing to perform hazardous task in various industry verticals such as automotive, pharma, food & beverages, and manufacturing industries fuels the growth of the global adaptive robotics market. Increase in automation will enable manufacturers to adopt industrial robots and adaptive robots to automation in the manufacturing sectors, which fosters the growth of the global adaptive robotics market. For instance, in 2020, according to Robotics Industries Association, more than 250,000 industrial robots were installed in the U.S alone.
Moreover, increase in demand for adaptive robots for automotive industry to maximize production drives the growth of the global adaptive robotics market. For instance, according to Mexican Automotive Association (AMIA), vehicle production increased by 3.9% from May 2018 to May 2019.
However, high initial setup cost of robot end effectors acts as a major restraint of the adaptive robotics market.
On the contrary, rapid integration of IoT in manufacturing industries is expected to create opportunities for growth of the adaptive robotics market during the forecast period.
A. The adaptive robotics market was valued at $4,974.3 million in 2020, and is expected to reach $ 55,097.0 million by 2030, registering a CAGR of 26.3% from 2021 to 2030.
A. The forecast period considered for the global adaptive robotics market is 2021 to 2030, wherein, 2020 is the base year, 2021 is the estimated year, and 2030 is the forecast year.
A. To get latest version of global adaptive robotics market report can be obtained on demand from the website.
A. The base year considered in the global adaptive robotics market report is 2020.
A. The top companies holding the market share in the global adaptive robotics market report include ABB, SoftBank Group Corp, Kuka AG, Robotiq Inc, Schmalz, Weiss Robotics GmbH & Co. KG, Yaskawa Electric Corporation.
A. The top ten market players are selected based on two key attributes - competitive strength and market positioning
A. By component, the harware segment dominated the global adaptive robotics market, in terms of revenue and is expected to maintain this trend during the forecast period.
A. By end-user, the automotive segment is the highest share holder of global adaptive robotics market.
A. The report contains an exclusive company profile section, where leading 10 companies in the market are profiled. These profiles typically cover company overview, geographical presence, market dominance (in terms of revenue and volume sales), various strategies and recent developments.
A. The market value of the global adaptive robotics market is $6,755.3 million in 2021.
Start reading instantly.
This Report and over 66,804+ more Reports, Available with Avenue Library. T&C*.
Enterprise
License/PDF
Library
Membership
*Taxes/Fees, if applicable will be added during checkout. All prices in USD
To ensure high-level data integrity, accurate analysis, and impeccable forecasts
For complete satisfaction
On-demand customization of scope of the report to exactly meet your needs
Targeted market view to provide pertinent information and save time of readers
Get insights on topics that are crucial for your business. Stay abreast of your interest areas.
Get Industry Data AlertsTo ensure high-level data integrity, accurate analysis, and impeccable forecasts
For complete satisfaction
On-demand customization of scope of the report to exactly meet your needs
Targeted market view to provide pertinent information and save time of readers