
Adhesion Barrier Market Overview
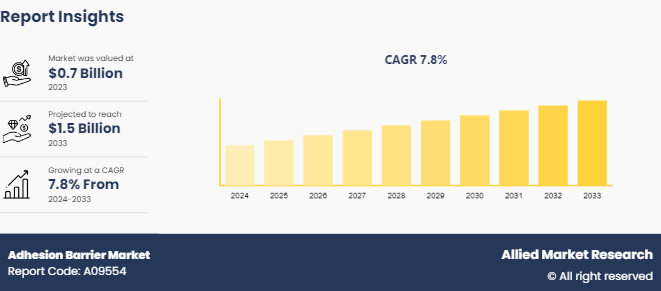
The global adhesion barrier market size was valued at $0.7 billion in 2023, and is projected to reach $1.5 billion by 2033, growing at a CAGR of 7.8% from 2024 to 2033. The growth of the adhesion barrier market is driven by the increasing number of surgeries worldwide, particularly in gynecology, orthopedics, and general surgery, where post-operative adhesions are common. Rising awareness among healthcare professionals about the complications associated with surgical adhesions is fueling the adoption of adhesion barrier products.
Market Size & Future Outlook
- 2023 Market Size: $700 million
- 2033 Projected Market Size: $1,478.85 million
- CAGR (2024-2033): 7.77%
- North America: Largest market in 2023
- Asia Pacific: Fastest growing market
The major factors driving the growth of the adhesion barrier market are rise in number of the surguries performed globally, increase in awareness among healthcare professionals about the complications associated with adhesions, and rise in research and development to develope innovative adhesion barrier products.
Adhesion Barrier Market Introduction and Definition
Adhesion barrier is a medical device used during surgeries to prevent the formation of adhesions, which are abnormal connections between tissues or organs that can occur after surgery. Adhesion barriers are composed of biocompatible materials such as films, gels, or fabrics that are placed between the tissues being operated on to act as a physical barrier. The primary purpose of adhesion barriers is to reduce the risk of adhesion-related complications, such as bowel obstructions, infertility, and chronic pain, which can arise when tissues become stuck together during the healing process. Adhesion barriers work by creating a temporary barrier between tissues, preventing them from sticking together as they heal. Adhesion barriers are particularly useful in surgeries involving the abdomen, pelvis, and other areas where tissues are prone to adhere.
Key Takeaways
- The adhesion barrier market share study covers 20 countries. The research includes a segment analysis of each country in terms of value for the projected period 2024-2032.
- More than 1, 500 product literatures, industry releases, annual reports, and other such documents of major energy storage system industry participants along with authentic industry journals, trade associations' releases, and government websites have been reviewed for generating high-value industry insights.
- The study integrated high-quality data, professional opinions and analysis, and critical independent perspectives. The research approach is intended to provide a balanced view of global markets and to assist stakeholders in making educated decisions to achieve their most ambitious growth objectives
Key Market Dynamics
Key factors driving adhesion barrier market growth are rise in number of surgeries, increase in awareness among healthcare professionals about the complications associated with adhesions, and development of innovative adhesion barrier products. As medical procedures become more prevalent, particularly in areas such as abdominal and pelvic surgeries, the risk of post-operative adhesions naturally rises. Surgical interventions are increasingly employed for various medical conditions, ranging from routine procedures to complex interventions, leading to a higher likelihood of tissue trauma and subsequent adhesion formation during the healing process. For instance, according to 2024 article published by the National Library of Medicine, it was reported that adhesions are a form of internal scar tissue that develop in 70–90% of patients undergoing abdominal surgery. As a result, surgeons and healthcare professionals are increasingly adopting adhesion barriers to reduce the risk of post-surgical adhesion and improve patient outcome. Thus, the rise in number of abdominal surguries and higher risk of tissue adhesion after abdominal surgury is expected to drive the adhesion barrier market size.
In addition, according to adhesion barrier market forecast analysis rise in awareness among the healthcare professionals about the complication of post-operative adhesion is expected to drive the growth of the market. Physicians, surgeons, and other healthcare providers are becoming more proactive in addressing the issue of adhesion formation after surgical procedures. Healthcare professionals are incorporating strategies such as the use of adhesion barriers into their surgical protocols to minimize the risk of adhesion-related complications. Medical societies and healthcare organizations play a crucial role in spreading awareness and establishing guidelines regarding the prevention and management of adhesions, further contributing to increased awareness among healthcare professionals. Thus, rise in awareness among the healthcare professionals is expected to drive the growth of the market.
Surgical Procedure Data
Surge in the number of surgeries has emerged as a significant catalyst propelling the growth of the adhesion barrier market. This rise can be attributed to several factors, including an aging population requiring more medical interventions, advancements in surgical techniques leading to increased surgical procedures, and growing prevalence of chronic diseases necessitating surgical interventions for treatment. As surgical procedures become more commonplace for various medical conditions, the risk of post-operative complications such as adhesions also escalates. Adhesions, which are abnormal tissue attachments that can develop between organs or tissues after surgery, often lead to complications such as bowel obstructions, infertility, and chronic pain. Consequently, there has been a heightened demand for adhesion barriers among surgeons and healthcare providers to mitigate these complications and enhance patient outcomes. The increasing adoption of minimally invasive surgical procedures, which are associated with lower rates of adhesion formation compared to traditional open surgeries, has further propelled the need for effective adhesion prevention products.

Adhesion Barrier Market Segmentation
The global adhesion barrier industry is segmented into product type, application, end user, and region. By product type, the market is divided into synthetic adhesion barrier and natural adhesion barrier. On the basis of application, it is segregated into general/abdominal surgeries, gynecological surgeries, cardiovascular surgeries, orthopedic surgeries, neurological surgeries, and other applications. Depending on end user, it is segregated into hospitals, specialty clinics, and ambulatory surgical centers. Region wise, the market is analyzed across North America, Europe, Asia-Pacific, and LAMEA
Regional/Country Market Outlook
North America dominated the adhesion barrier market share in 2023, primarily driven by advanced healthcare facilities, high adoption rates of innovative medical technologies, and a significant number of surgical procedures performed annually. The region's stringent regulatory environment ensures the quality and safety of adhesion barrier products, fostering confidence among healthcare providers and patients. Moreover, growing aging population with a higher incidence of chronic diseases contributes to the demand for adhesion barriers to prevent post-operative complications.
According to the adhesion barrier market opportunity analysis the developing regions such Asia-Pacific is expected to register fastest growth during the forecast period. This is attributed to rising healthcare expenditure, improving healthcare infrastructure, and increasing access to surgical interventions. The countries such as China, India, and Japan are witnessing a surge in surgical procedures due to demographic shifts, urbanization, and lifestyle changes. As awareness about adhesion-related complications grows in the region, there is a growing interest in preventive measures such as adhesion barriers among healthcare providers and patients.
Industry Trends
- According to 2021 article by World Health Organization, it was reported that caesarean section use continues to rise globally, now accounting for more than 1 in 5 (21%) of all childbirths.
- In a 2024 article published by the National Library of Medicine, it was reported that bioresorbable barriers is the most extensively researched adhesion barrier type, exhibiting promising results in colorectal surgery
- According to 2022 article by the National Library of Medicine, natural adhesion barriers such as oxidized regenerated cellulose, carboxymethylcellulose/hyaluronic acid and synthetic barriers such as polylactic acid/polyethylene glycol and poloxamer 407/alginate were successful in adhesion reduction in animal and human studies demonstrated adequate ability to adhere to traumatized tissue.
- According to the data published by the British Heart Foundation in December 2021, an estimated 32, 938 completed heart operations and other heart procedures were performed in England in October 2021.
- According to the data published by the National Safety Council (NSC) for the United States in 2021, bicycling accounted for about 375, 797 injuries, and exercise accounted for about 409, 224 injuries
Competitive Landscape
The major players operating in the adhesion barrier industry include Anika Therapeutics, Baxter International, Leader Biomedical, Betatech Medical, FzioMed, Integra LifeSciences Holdings Corporation, Johnson & Johnson, CGBio Inc., Atrium Medical Corporation and Toray Industries Inc. Other players in Adhesion barrier market include Normedi Nordic, Mast Biosurgery, C. R. Bard, Innocoll Holdings PLC., and Sanofi
What are the Recent Key Strategies and Developments
- In June 2022, CGBIO launched Mediclore, an anti-adhesion agent in Indonesia. Mediclore inhibits adhesion by changing from sol to gel form by body temperature when applied to the body.
- In January 2021, Integra LifeSciences Holdings Corporation announced the acquisition of the Acell Inc.
- In October 2021, Toray Industry Inc. entered into a partnership with ASKA Pharmaceuticals Co., Ltd. to develop and commercialize adhesion barrier. Under the agreement, Toray and ASKA will jointly develop the product to obtain a marketing approval of the product in Japan. Upon the approval, Toray will manufacture the product, as ASKA will exclusively market it in Japan.
Key Sources Referred
- World Health Organization
- Ministry of Health, India
- Center of Disease Control and Prevention
- National Library of Medicine
- American College of Surgeons
- Indian Renal Foundation
- National Family Health Survey, India
- British Heart Foundation
What are the Key Benefits for Stakeholders
- This report provides a quantitative analysis of the market segments, current trends, estimations, and dynamics of the adhesion barrier market analysis to identify the prevailing adhesion barrier market opportunities.
- The market research is offered along with information related to key drivers, restraints, and opportunities.
- Porter's five forces analysis highlights the potency of buyers and suppliers to enable stakeholders make profit-oriented business decisions and strengthen their supplier-buyer network.
- In-depth analysis of the adhesion barrier market segmentation assists to determine the prevailing market opportunities.
- Major countries in each region are mapped according to their revenue contribution to the global market.
- Market player positioning facilitates benchmarking and provides a clear understanding of the present position of the market players.
- The report includes the analysis of the regional as well as global adhesion barrier market trends, key players, market segments, application areas, and market growth strategies.
Adhesion Barrier Market Report Highlights
| Aspects | Details |
| Market Size By 2033 | USD 1.5 Billion |
| Growth Rate | CAGR of 7.8% |
| Forecast period | 2024 - 2033 |
| Report Pages | 280 |
| By Type |
|
| By Application |
|
| By End User |
|
| By Region |
|
| Key Market Players | CGBio Inc, leader biomedical, Atrium Medical Corporation, fziomed, inc., Johnson & Johnson, Toray Industries Inc., Betatech Medical, Anika Therapeutics Inc., Baxter International Inc., Integra LifeSciences Holdings Corporation |
Analyst Review
The adhesion barrier market is poised for substantial growth driven by increasing surgical procedures worldwide and the rising awareness of postoperative complications associated with adhesions. Adhesion barriers, designed to prevent the formation of fibrous bands between tissues and organs post-surgery, are witnessing heightened demand as healthcare providers and patients seek to minimize the risk of adhesion-related complications. Technological advancements and the introduction of new, biocompatible, and efficient adhesion barrier products are also fueling market expansion. The market is characterized by a diverse range of products, including films, gels, and liquids, each tailored to specific surgical needs. Regulatory approvals and favorable reimbursement policies in developed regions are further supporting market growth.
The forecast period for Adhesion Barrier Market is 2024-2033.
The total market value of Adhesion Barrier Market is $0.7 billion in 2023.
The market value of Adhesion Barrier Market is projected to reach $1.5 billion by 2033
The base year is 2023 in Adhesion Barrier Market
Major key players that operate in the Adhesion Barrier Market are Integra LifeSciences Holdings Corporation, Johnson & Johnson, CGBio Inc., and Atrium Medical Corporation
Loading Table Of Content...

