Report Code: A04244 | Mar 2018 | Pages: 175 | ||
Tables: 96 | Charts: 62 |
|
Pandemic disrupted the entire world and affected many industries.
Get detailed COVID-19 impact analysis on the Advanced High-strength Steel Market
Request Now !The global advanced high-strength steel market size was valued at $13,147 million in 2016 and is anticipated to reach $29,151 million by 2023 at a CAGR of 12.2% during the forecast period.
Advanced high-strength steels are complex sophisticated materials containing multiphase microstructures and chemical compositions resulting from precisely controlled cooling and heating processes. These steels possess a yield strength of 550 MPa and tensile strength of 780 MPa. They offer high strength and optimized formability, which allows weight reduction and design freedom for various types of crash components and structural reinforcements.
Increase in penetration of lightweight components, particularly in automobiles, growth in consciousness toward decreasing the GHG and CO2 emission levels, and the rapid growth in automotive industry drive the global advanced high-strength steel market. In addition, fast growing aerospace industry and accelerating urbanization and industrialization in developing economies is projected to create lucrative opportunities for vessel manufacturers to integrate AHSS grades in the industry. However, availability of substitutes and lack of awareness of the new steel across other industries is projected to impede the global advanced high-strength steel market.
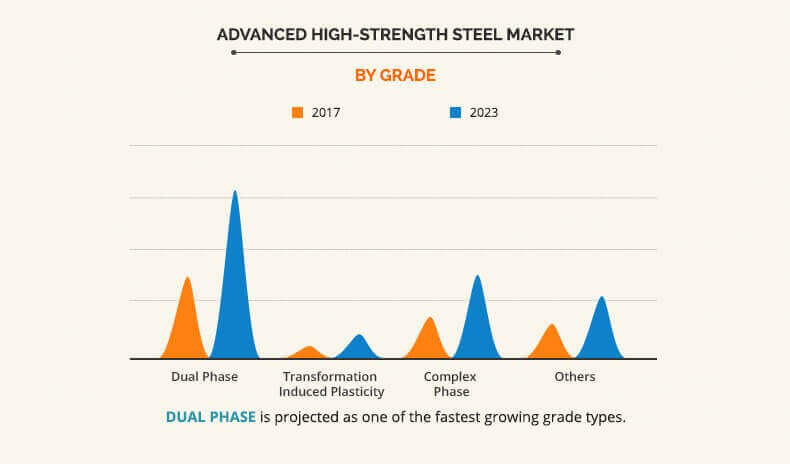
The report segments the advanced high-strength steel market based on grade, end user, and region. Based on grade, it is divided into dual phase (DP), complex-phase (CP), transformation-induced plasticity (TRIP), and others. DP steel is increasingly used by carmakers in the present car models. For instance, as of 2011, Chevrolet Volt's upper body and lower structure is around 6% and 15% dual phase by mass, respectively, which includes reinforcement of rocker outer panel.
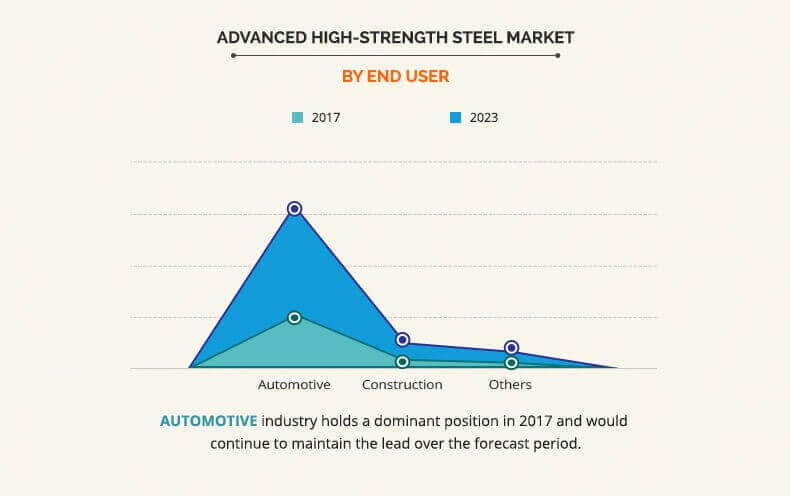
Based on end user, it is classified into automotive, construction, and others (power generation and shipbuilding). The automotive industry generated the maximum revenue in 2016.
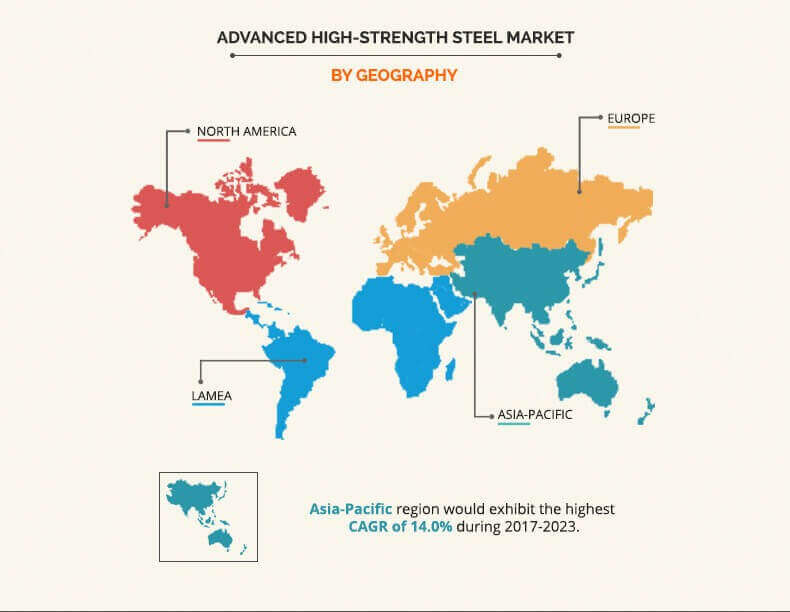
By region, advanced high-strength steel industry is analyzed across North America, Europe, Asia-Pacific, and LAMEA. North America accounted for the highest revenue in 2016, owing to upsurge in demand for lightweight vehicles and rise in efforts to conform to the fuel economy standards. For instance, Nucor Corporation is working on developing third-generation AHSS for automotive application. These new grades are stronger and are used in lesser quantity, thereby saving maximum weight.
The prominent players operating in the global advanced high-strength steel market have strategically focused on product launch as their key strategy to gain significant share in the market. The key players profiled in the report include Tata Steel Limited, ArcelorMittal S.A., NanoSteel, AK Steel Corporation, Nucor Corporation, MTL Advanced Ltd., United States Steel Corporation, Baoshan Iron and Steel Co. Ltd., Kobe Steel Ltd., and SSAB AB.
Advanced High-strength Steel Market Report Highlights
Aspects | Details |
---|---|
By Grade |
|
By End User |
|
By Region |
|
Key Market Players | SSAB AB, Kobe Steel, Ltd., Baoshan Iron & Steel Company Limited, Nucor Corporation, United States Steel Corporation, AK STEEL HOLDING CORPORATION, Tata Steel Limited, The NanoSteel Company, ArcelorMittal South Africa Limited, WEC Group Ltd. (MTL Advanced Ltd.) |
CHAPTER 1: INTRODUCTION
1.1. Report description
1.2. Key benefits for stakeholders
1.3. Key market segments
1.4. Research methodology
1.4.1. Primary research
1.4.2. Secondary research
1.4.3. Analyst tools and models
CHAPTER 2: EXECUTIVE SUMMARY
2.1. Market snapshot
2.2. CXO perspective
CHAPTER 3: MARKET OVERVIEW
3.1. Market definition and scope
3.2. Key findings
3.2.1. Top investment pockets
3.2.2. Top winning strategies
3.3. Porter's five forces analysis
3.3.1. Bargaining power of suppliers
3.3.2. Bargaining power of buyers
3.3.3. Threat of new entrants
3.3.4. Threat of substitutes
3.3.5. Intensity of competitive rivalry
3.4. Key player positioning, 2016
3.5. Product benchmarking by companies
3.5.1. Grades
3.5.2. Mechanical Properties
3.5.3. Application
3.5.4. Price range
3.6. Price trend analysis
3.6.1. By year
3.6.2. By country
3.7. Market dynamics
3.7.1. Drivers
3.7.1.1. Rise in penetration of lightweight components
3.7.1.2. Increase in need to curb CO2 emissions
3.7.1.3. Development of the automotive industry
3.7.2. Restraints
3.7.2.1. Availability of substitutes in the market
3.7.2.2. Lack of usage in other industries
3.7.3. Opportunities
3.7.3.1. Growth of the aerospace industry
3.7.3.2. Increase in industrialization and urbanization in the developing economies
CHAPTER 4: ADVANCED HIGH-STRENGTH STEEL MARKET, BY GRADE
4.1. Overview
4.1.1. Market size and forecast
4.2. Dual phase (DP)
4.2.1. Key market trends, growth factors, and opportunities
4.2.2. Market size and forecast
4.2.3. Market analysis, by country
4.3. Transformation-induced plasticity (TRIP)
4.3.1. Key market trends, growth factors, and opportunities
4.3.2. Market size and forecast
4.3.3. Market analysis, by country
4.4. Complex phase (CP)
4.4.1. Key market trends, growth factors, and opportunities
4.4.2. Market size and forecast
4.4.3. Market analysis, by country
4.5. Others
4.5.1. Key market trends, growth factors, and opportunities
4.5.2. Market size and forecast
4.5.3. Market analysis, by country
CHAPTER 5: ADVANCED HIGH-STRENGTH STEEL MARKET, BY END USER
5.1. Overview
5.1.1. Market size and forecast
5.2. Automotive
5.2.1. Key market trends, growth factors, and opportunities
5.2.2. Market size and forecast
5.2.3. Market analysis, by country
5.3. Construction
5.3.1. Key market trends, growth factors, and opportunities
5.3.2. Market size and forecast
5.3.3. Market analysis, by country
5.4. Others
5.4.1. Key market trends, growth factors, and opportunities
5.4.2. Market size and forecast
5.4.3. Market analysis, by country
CHAPTER 6: ADVANCED HIGH-STRENGTH STEEL MARKET, BY REGION
6.1. Overview
6.1.1. Market size and forecast
6.2. North America
6.2.1. Key market trends, growth factors, and opportunities
6.2.2. Market size and forecast, by grade
6.2.3. Market size and forecast, by end user
6.2.4. Market size and forecast, by country
6.2.5. U.S.
6.2.5.1. Market size and forecast, by grade
6.2.5.2. Market size and forecast, by end user
6.2.6. Canada
6.2.6.1. Market size and forecast, by grade
6.2.6.2. Market size and forecast, by end user
6.2.7. Mexico
6.2.7.1. Market size and forecast, by grade
6.2.7.2. Market size and forecast, by end user
6.3. Europe
6.3.1. Key market trends, growth factors, and opportunities
6.3.2. Market size and forecast, by grade
6.3.3. Market size and forecast, by end user
6.3.4. Market size and forecast, by country
6.3.5. Germany
6.3.5.1. Market size and forecast, by grade
6.3.5.2. Market size and forecast, by end user
6.3.6. France
6.3.6.1. Market size and forecast, by grade
6.3.6.2. Market size and forecast, by end user
6.3.7. UK
6.3.7.1. Market size and forecast, by grade
6.3.7.2. Market size and forecast, by end user
6.3.8. Italy
6.3.8.1. Market size and forecast, by grade
6.3.8.2. Market size and forecast, by end user
6.3.9. Spain
6.3.9.1. Market size and forecast, by grade
6.3.9.2. Market size and forecast, by end user
6.3.10. Rest of Europe
6.3.10.1. Market size and forecast, by grade
6.3.10.2. Market size and forecast, by end user
6.4. Asia-Pacific
6.4.1. Key market trends, growth factors, and opportunities
6.4.2. Market size and forecast, by grade
6.4.3. Market size and forecast, by end user
6.4.4. Market size and forecast, by country
6.4.5. Japan
6.4.5.1. Market size and forecast, by grade
6.4.5.2. Market size and forecast, by end user
6.4.6. China
6.4.6.1. Market size and forecast, by grade
6.4.6.2. Market size and forecast, by end user
6.4.7. South Korea
6.4.7.1. Market size and forecast, by grade
6.4.7.2. Market size and forecast, by end user
6.4.8. India
6.4.8.1. Market size and forecast, by grade
6.4.8.2. Market size and forecast, by end user
6.4.9. Rest of Asia-Pacific
6.4.9.1. Market size and forecast, by grade
6.4.9.2. Market size and forecast, by end user
6.5. LAMEA
6.5.1. Key market trends, growth factors, and opportunities
6.5.2. Market size and forecast, by grade
6.5.3. Market size and forecast, by end user
6.5.4. Market size and forecast, by country
6.5.5. Brazil
6.5.5.1. Market size and forecast, by grade
6.5.5.2. Market size and forecast, by end user
6.5.6. Argentina
6.5.6.1. Market size and forecast, by grade
6.5.6.2. Market size and forecast, by end user
6.5.7. Africa
6.5.7.1. Market size and forecast, by grade
6.5.7.2. Market size and forecast, by end user
6.5.8. Saudi Arabia
6.5.8.1. Market size and forecast, by grade
6.5.8.2. Market size and forecast, by end user
6.5.9. UAE
6.5.9.1. Market size and forecast, by grade
6.5.9.2. Market size and forecast, by end user
6.5.10. Rest of LAMEA
6.5.10.1. Market size and forecast, by grade
6.5.10.2. Market size and forecast, by end user
CHAPTER 7: COMPANY PROFILES
7.1. AK STEEL HOLDING CORPORATION
7.1.1. Company overview
7.1.2. Company snapshot
7.1.3. Operating business segments
7.1.4. Product portfolio
7.1.5. Business performance
7.1.6. Key strategic moves and developments
7.2. ArcelorMittal South Africa Limited
7.2.1. Company overview
7.2.2. Company snapshot
7.2.3. Operating business segments
7.2.4. Product portfolio
7.2.5. Business performance
7.2.6. Key strategic moves and developments
7.3. Baoshan Iron & Steel Company Limited
7.3.1. Company overview
7.3.2. Company snapshot
7.3.3. Operating business segments
7.3.4. Product portfolio
7.3.5. Business performance
7.4. Kobe Steel, Ltd.
7.4.1. Company overview
7.4.2. Company snapshot
7.4.3. Operating business segments
7.4.4. Product portfolio
7.4.5. Business performance
7.4.6. Key strategic moves and developments
7.5. WEC Group Ltd. (MTL Advanced Ltd.)
7.5.1. Company overview
7.5.2. Company snapshot
7.5.3. Operating business segments
7.5.4. Product portfolio
7.6. The NanoSteel Company
7.6.1. Company overview
7.6.2. Company snapshot
7.6.3. Operating business segments
7.6.4. Product portfolio
7.7. Nucor Corporation
7.7.1. Company overview
7.7.2. Company snapshot
7.7.3. Operating business segments
7.7.4. Product portfolio
7.7.5. Business performance
7.7.6. Key strategic moves and developments
7.8. SSAB AB
7.8.1. Company overview
7.8.2. Company snapshot
7.8.3. Operating business segments
7.8.4. Product portfolio
7.8.5. Business performance
7.9. Tata Steel Limited
7.9.1. Company overview
7.9.2. Company snapshot
7.9.3. Operating business segments
7.9.4. Product portfolio
7.9.5. Business performance
7.9.6. Key strategic moves and developments
7.10. United States Steel Corporation
7.10.1. Company overview
7.10.2. Company snapshot
7.10.3. Operating business segments
7.10.4. Product portfolio
7.10.5. Business performance
7.10.6. Key strategic moves and developments
LIST OF TABLES
TABLE 01. DUAL PHASE PRICE TREND ANALYSIS, BY COUNTRY, 2014–2023 ($/CWT)
TABLE 02. TRANSFORMATION INDUCED PLASTICITY PRICE TREND ANALYSIS, BY COUNTRY, 2014–2023 ($/CWT)
TABLE 03. MARTENSITIC STEEL PRICE TREND ANALYSIS, BY COUNTRY, 2014–2023 ($/CWT)
TABLE 04. COMPLEX PHASE PRICE TREND ANALYSIS, BY COUNTRY, 2014–2023 ($/CWT)
TABLE 05. GLOBAL ADVANCED HIGH-STRENGTH STEEL MARKET, BY GRADE, 2016–2023 ($MILLION)
TABLE 06. DUAL PHASE ADVANCED HIGH-STRENGTH STEEL MARKET, BY REGION, 2016–2023 ($MILLION)
TABLE 07. TRANSFORMATION INDUCED PLASTICITY ADVANCED HIGH-STRENGTH STEEL MARKET, BY REGION, 2016–2023 ($MILLION)
TABLE 08. COMPLEX PHASE ADVANCED HIGH-STRENGTH STEEL MARKET, BY REGION, 2016–2023 ($MILLION)
TABLE 09. OTHERS ADVANCED HIGH-STRENGTH STEEL MARKET, BY REGION, 2016–2023 ($MILLION)
TABLE 10. GLOBAL ADVANCED HIGH-STRENGTH STEEL MARKET REVENUE, BY END USER, 2016–2023 ($MILLION)
TABLE 11. ADVANCED HIGH-STRENGTH STEEL MARKET FOR AUTOMOTIVE INDUSTRY, BY REGION, 2016–2023 ($MILLION)
TABLE 12. ADVANCED HIGH-STRENGTH STEEL MARKET FOR CONSTRUCTION INDUSTRY, BY REGION, 2016–2023 ($MILLION)
TABLE 13. ADVANCED HIGH-STRENGTH STEEL MARKET FOR OTHER INDUSTRIES, BY REGION, 2016–2023 ($MILLION)
TABLE 14. ADVANCED HIGH-STRENGTH STEEL MARKET REVENUE, BY REGION, 2016–2023 ($MILLION)
TABLE 15. NORTH AMERICA ADVANCED HIGH-STRENGTH STEEL MARKET, BY GRADE, 2016–2023 ($MILLION)
TABLE 16. NORTH AMERICA ADVANCED HIGH-STRENGTH STEEL MARKET, BY END USER, 2016–2023 ($MILLION)
TABLE 17. NORTH AMERICA ADVANCED HIGH-STRENGTH STEEL MARKET, BY COUNTRY, 2016–2023 ($MILLION)
TABLE 18. U.S. ADVANCED HIGH-STRENGTH STEEL MARKET, BY GRADE, 2016–2023 ($MILLION)
TABLE 19. U.S. ADVANCED HIGH-STRENGTH STEEL MARKET, BY END USER, 2016–2023 ($MILLION)
TABLE 20. CANADA ADVANCED HIGH-STRENGTH STEEL MARKET, BY GRADE, 2016–2023 ($MILLION)
TABLE 21. CANADA ADVANCED HIGH-STRENGTH STEEL MARKET, BY END USER, 2016–2023 ($MILLION)
TABLE 22. MEXICO ADVANCED HIGH-STRENGTH STEEL MARKET, BY GRADE, 2016–2023 ($MILLION)
TABLE 23. MEXICO ADVANCED HIGH-STRENGTH STEEL MARKET, BY END USER, 2016–2023 ($MILLION)
TABLE 24. EUROPE ADVANCED HIGH-STRENGTH STEEL MARKET, BY GRADE, 2016–2023 ($MILLION)
TABLE 25. EUROPE ADVANCED HIGH-STRENGTH STEEL MARKET, BY END USER, 2016–2023 ($MILLION)
TABLE 26. EUROPE ADVANCED HIGH-STRENGTH STEEL MARKET, BY COUNTRY, 2016–2023 ($MILLION)
TABLE 27. GERMANY ADVANCED HIGH-STRENGTH STEEL MARKET, BY GRADE, 2016–2023 ($MILLION)
TABLE 28. GERMANY ADVANCED HIGH-STRENGTH STEEL MARKET, BY END USER, 2016–2023 ($MILLION)
TABLE 29. FRANCE ADVANCED HIGH-STRENGTH STEEL MARKET, BY GRADE, 2016–2023 ($MILLION)
TABLE 30. FRANCE ADVANCED HIGH-STRENGTH STEEL MARKET, BY END USER, 2016–2023 ($MILLION)
TABLE 31. UK ADVANCED HIGH-STRENGTH STEEL MARKET, BY GRADE, 2016–2023 ($MILLION)
TABLE 32. UK ADVANCED HIGH-STRENGTH STEEL MARKET, BY END USER, 2016–2023 ($MILLION)
TABLE 33. ITALY ADVANCED HIGH-STRENGTH STEEL MARKET, BY GRADE, 2016–2023 ($MILLION)
TABLE 34. ITALY ADVANCED HIGH-STRENGTH STEEL MARKET, BY END USER, 2016–2023 ($MILLION)
TABLE 35. SPAIN ADVANCED HIGH-STRENGTH STEEL MARKET, BY GRADE, 2016–2023 ($MILLION)
TABLE 36. SPAIN ADVANCED HIGH-STRENGTH STEEL MARKET, BY END USER, 2016–2023 ($MILLION)
TABLE 37. REST OF EUROPE ADVANCED HIGH-STRENGTH STEEL MARKET, BY GRADE, 2016–2023 ($MILLION)
TABLE 38. REST OF EUROPE ADVANCED HIGH-STRENGTH STEEL MARKET, BY END USER, 2016–2023 ($MILLION)
TABLE 39. ASIA-PACIFIC ADVANCED HIGH-STRENGTH STEEL MARKET, BY GRADE, 2016–2023 ($MILLION)
TABLE 40. ASIA-PACIFIC ADVANCED HIGH-STRENGTH STEEL MARKET, BY END USER, 2016–2023 ($MILLION)
TABLE 41. ASIA-PACIFIC ADVANCED HIGH-STRENGTH STEEL MARKET, BY COUNTRY, 2016–2023 ($MILLION)
TABLE 42. JAPAN ADVANCED HIGH-STRENGTH STEEL MARKET, BY GRADE, 2016–2023 ($MILLION)
TABLE 43. JAPAN ADVANCED HIGH-STRENGTH STEEL MARKET, BY END USER, 2016–2023 ($MILLION)
TABLE 44. CHINA ADVANCED HIGH-STRENGTH STEEL MARKET, BY GRADE, 2016–2023 ($MILLION)
TABLE 45. CHINA ADVANCED HIGH-STRENGTH STEEL MARKET, BY END USER, 2016–2023 ($MILLION)
TABLE 46. SOUTH KOREA ADVANCED HIGH-STRENGTH STEEL MARKET, BY GRADE, 2016–2023 ($MILLION)
TABLE 47. SOUTH KOREA ADVANCED HIGH-STRENGTH STEEL MARKET, BY END USER, 2016–2023 ($MILLION)
TABLE 48. INDIA ADVANCED HIGH-STRENGTH STEEL MARKET, BY GRADE, 2016–2023 ($MILLION)
TABLE 49. INDIA ADVANCED HIGH-STRENGTH STEEL MARKET, BY END USER, 2016–2023 ($MILLION)
TABLE 50. REST OF ASIA-PACIFIC ADVANCED HIGH-STRENGTH STEEL MARKET, BY GRADE, 2016–2023 ($MILLION)
TABLE 51. REST OF ASIA-PACIFIC ADVANCED HIGH-STRENGTH STEEL MARKET, BY END USER, 2016–2023 ($MILLION)
TABLE 52. LAMEA ADVANCED HIGH-STRENGTH STEEL MARKET, BY GRADE, 2016–2023 ($MILLION)
TABLE 53. LAMEA ADVANCED HIGH-STRENGTH STEEL MARKET, BY END USER, 2016–2023 ($MILLION)
TABLE 54. LAMEA ADVANCED HIGH-STRENGTH STEEL MARKET, BY COUNTRY, 2016–2023 ($MILLION)
TABLE 55. BRAZIL ADVANCED HIGH-STRENGTH STEEL MARKET, BY GRADE, 2016–2023 ($MILLION)
TABLE 56. BRAZIL ADVANCED HIGH-STRENGTH STEEL MARKET, BY END USER, 2016–2023 ($MILLION)
TABLE 57. ARGENTINA ADVANCED HIGH-STRENGTH STEEL MARKET, BY GRADE, 2016–2023 ($MILLION)
TABLE 58. ARGENTINA ADVANCED HIGH-STRENGTH STEEL MARKET, BY END USER, 2016–2023 ($MILLION)
TABLE 59. AFRICA ADVANCED HIGH-STRENGTH STEEL MARKET, BY GRADE, 2016–2023 ($MILLION)
TABLE 60. AFRICA ADVANCED HIGH-STRENGTH STEEL MARKET, BY END USER, 2016–2023 ($MILLION)
TABLE 61. SAUDI ARABIA ADVANCED HIGH-STRENGTH STEEL MARKET, BY GRADE, 2016–2023 ($MILLION)
TABLE 62. SAUDI ARABIA ADVANCED HIGH-STRENGTH STEEL MARKET, BY END USER, 2016–2023 ($MILLION)
TABLE 63. UAE ADVANCED HIGH-STRENGTH STEEL MARKET, BY GRADE, 2016–2023 ($MILLION)
TABLE 64. UAE ADVANCED HIGH-STRENGTH STEEL MARKET, BY END USER, 2016–2023 ($MILLION)
TABLE 65. REST OF LAMEA ADVANCED HIGH-STRENGTH STEEL MARKET, BY GRADE, 2016–2023 ($MILLION)
TABLE 66. REST OF LAMEA ADVANCED HIGH-STRENGTH STEEL MARKET, BY END USER, 2016–2023 ($MILLION)
TABLE 67. AK HOLDING: COMPANY SNAPSHOT
TABLE 68. AK HOLDING: OPERATING SEGMENTS
TABLE 69. AK HOLDING: PRODUCT PORTFOLIO
TABLE 70. ARCELORMITTAL: COMPANY SNAPSHOT
TABLE 71. ARCELORMITTAL: OPERATING SEGMENTS
TABLE 72. ARCELORMITTAL: PRODUCT PORTFOLIO
TABLE 73. BAOSTEEL GROUP: COMPANY SNAPSHOT
TABLE 74. BAOSTEEL GROUP: OPERATING SEGMENTS
TABLE 75. BAOSTEEL GROUP: PRODUCT PORTFOLIO
TABLE 76. KOBELCO: COMPANY SNAPSHOT
TABLE 77. KOBELCO: OPERATING SEGMENTS
TABLE 78. KOBELCO: PRODUCT PORTFOLIO
TABLE 79. WEC GROUP: COMPANY SNAPSHOT
TABLE 80. WEC GROUP: OPERATING SEGMENTS
TABLE 81. WEC GROUP: PRODUCT PORTFOLIO
TABLE 82. NANOSTEEL: COMPANY SNAPSHOT
TABLE 83. NANOSTEEL: OPERATING SEGMENTS
TABLE 84. NANOSTEEL: PRODUCT PORTFOLIO
TABLE 85. NUCOR: COMPANY SNAPSHOT
TABLE 86. NUCOR: OPERATING SEGMENTS
TABLE 87. NUCOR: PRODUCT PORTFOLIO
TABLE 88. SSAB: COMPANY SNAPSHOT
TABLE 89. SSAB: OPERATING SEGMENTS
TABLE 90. SSAB: PRODUCT PORTFOLIO
TABLE 91. TATA STEEL: COMPANY SNAPSHOT
TABLE 92. TATA STEEL: OPERATING SEGMENTS
TABLE 93. TATA STEEL: PRODUCT PORTFOLIO
TABLE 94. U.S. STEEL: COMPANY SNAPSHOT
TABLE 95. U.S. STEEL: OPERATING SEGMENTS
TABLE 96. U.S. STEEL: PRODUCT PORTFOLIO
LIST OF FIGURES
FIGURE 01. KEY MARKET SEGMENTS
FIGURE 02. EXECUTIVE SUMMARY
FIGURE 03. TOP INVESTMENT POCKETS, 2016
FIGURE 04. TOP WINNING STRATEGIES, BY YEAR, 2015–2017
FIGURE 05. TOP WINNING STRATEGIES, BY DEVELOPMENT, 2015–2017
FIGURE 06. TOP WINNING STRATEGIES, BY COMPANY, 2014–2018*
FIGURE 07. HIGH BARGAINING POWER OF SUPPLIERS
FIGURE 08. LOW BARGAINING POWER OF BUYERS
FIGURE 09. LOW THREAT OF NEW ENTRANTS
FIGURE 10. MODERATE TO HIGH THREAT OF SUBSTITUTES
FIGURE 11. HIGH COMPETITIVE RIVALRY
FIGURE 12. TOP PLAYER POSITIONING, 2016
FIGURE 13. ADVANCED HIGH-STRENGTH STEEL MARKET, BY GRADE, 2016 (%)
FIGURE 14. COMPARATIVE SHARE ANALYSIS OF DUAL PHASE ADVANCED HIGH-STRENGTH STEEL MARKET, BY COUNTRY, 2016 & 2023 (%)
FIGURE 15. COMPARATIVE SHARE ANALYSIS OF TRANSFORMATION INDUCED PLASTICITY ADVANCED HIGH-STRENGTH STEEL MARKET, BY COUNTRY, 2016 & 2023 (%)
FIGURE 16. COMPARATIVE SHARE ANALYSIS OF COMPLEX PHASE ADVANCED HIGH-STRENGTH STEEL MARKET, BY COUNTRY, 2016 & 2023 (%)
FIGURE 17. COMPARATIVE SHARE ANALYSIS OF OTHERS ADVANCED HIGH-STRENGTH STEEL MARKET, BY COUNTRY, 2016 & 2023 (%)
FIGURE 18. ADVANCED HIGH-STRENGTH STEEL MARKET, BY END USER, 2016 (%)
FIGURE 19. COMPARATIVE SHARE ANALYSIS OF ADVANCED HIGH-STRENGTH STEEL MARKET FOR AUTOMOTIVE INDUSTRY, BY COUNTRY, 2016 & 2023 (%)
FIGURE 20. COMPARATIVE SHARE ANALYSIS OF ADVANCED HIGH-STRENGTH STEEL MARKET FOR CONSTRUCTION INDUSTRY, BY COUNTRY, 2016 & 2023 (%)
FIGURE 21. COMPARATIVE SHARE ANALYSIS OF ADVANCED HIGH-STRENGTH STEEL MARKET FOR OTHER INDUSTRIES, BY COUNTRY, 2016 & 2023 (%)
FIGURE 22. ADVANCED HIGH-STRENGTH STEEL MARKET, BY REGION, 2016 (%)
FIGURE 23. U.S. ADVANCED HIGH-STRENGTH STEEL MARKET, 2016–2023 ($MILLION)
FIGURE 24. CANADA ADVANCED HIGH-STRENGTH STEEL MARKET, 2016–2023 ($MILLION)
FIGURE 25. MEXICO ADVANCED HIGH-STRENGTH STEEL MARKET, 2016–2023 ($MILLION)
FIGURE 26. GERMANY ADVANCED HIGH-STRENGTH STEEL MARKET, 2016–2023 ($MILLION)
FIGURE 27. FRANCE ADVANCED HIGH-STRENGTH STEEL MARKET, 2016–2023 ($MILLION)
FIGURE 28. UK ADVANCED HIGH-STRENGTH STEEL MARKET, 2016–2023 ($MILLION)
FIGURE 29. ITALY ADVANCED HIGH-STRENGTH STEEL MARKET, 2016–2023 ($MILLION)
FIGURE 30. SPAIN ADVANCED HIGH-STRENGTH STEEL MARKET, 2016–2023 ($MILLION)
FIGURE 31. REST OF EUROPE ADVANCED HIGH-STRENGTH STEEL MARKET, 2016–2023 ($MILLION)
FIGURE 32. JAPAN ADVANCED HIGH-STRENGTH STEEL MARKET, 2016–2023 ($MILLION)
FIGURE 33. CHINA ADVANCED HIGH-STRENGTH STEEL MARKET, 2016–2023 ($MILLION)
FIGURE 34. SOUTH KOREA ADVANCED HIGH-STRENGTH STEEL MARKET, 2016–2023 ($MILLION)
FIGURE 35. INDIA ADVANCED HIGH-STRENGTH STEEL MARKET, 2016–2023 ($MILLION)
FIGURE 36. REST OF ASIA-PACIFIC ADVANCED HIGH-STRENGTH STEEL MARKET, 2016–2023 ($MILLION)
FIGURE 37. BRAZIL ADVANCED HIGH-STRENGTH STEEL MARKET, 2016–2023 ($MILLION)
FIGURE 38. ARGENTINA ADVANCED HIGH-STRENGTH STEEL MARKET, 2016–2023 ($MILLION)
FIGURE 39. AFRICA ADVANCED HIGH-STRENGTH STEEL MARKET, 2016–2023 ($MILLION)
FIGURE 40. SAUDI ARABIA ADVANCED HIGH-STRENGTH STEEL MARKET, 2016–2023 ($MILLION)
FIGURE 41. UAE ADVANCED HIGH-STRENGTH STEEL MARKET, 2016–2023 ($MILLION)
FIGURE 42. REST OF LAMEA ADVANCED HIGH-STRENGTH STEEL MARKET, 2016–2023 ($MILLION)
FIGURE 43. AK HOLDING: NET SALES, 2015–2017 ($MILLION)
FIGURE 44. AK HOLDING: REVENUE SHARE BY GEOGRAPHY, 2017 (%)
FIGURE 45. ARCELORMITTAL: NET SALES, 2015–2017 ($MILLION)
FIGURE 46. ARCELORMITTAL: REVENUE SHARE BY SEGMENT, 2017 (%)
FIGURE 47. BAOSTEEL GROUP: NET SALES, 2014–2016 ($MILLION)
FIGURE 48. BAOSTEEL GROUP: REVENUE SHARE BY SEGMENT, 2016 (%)
FIGURE 49. BAOSTEEL GROUP: REVENUE SHARE BY GEOGRAPHY, 2016 (%)
FIGURE 50. KOBELCO: NET SALES, 2015–2017 ($MILLION)
FIGURE 51. KOBELCO: REVENUE SHARE BY SEGMENT, 2017 (%)
FIGURE 52. KOBELCO: REVENUE SHARE BY GEOGRAPHY, 2017 (%)
FIGURE 53. NUCOR: NET SALES, 2015–2017 ($MILLION)
FIGURE 54. NUCOR: REVENUE SHARE BY SEGMENT, 2017 (%)
FIGURE 55. SSAB: NET SALES, 2015–2017 ($MILLION)
FIGURE 56. SSAB: REVENUE SHARE BY SEGMENT, 2017 (%)
FIGURE 57. TATA STEEL: NET SALES, 2015–2017 ($MILLION)
FIGURE 58. TATA STEEL: REVENUE SHARE BY SEGMENT, 2017 (%)
FIGURE 59. TATA STEEL: REVENUE SHARE BY GEOGRAPHY, 2017 (%)
FIGURE 60. U.S. STEEL: NET SALES, 2015–2017 ($MILLION)
FIGURE 61. U.S. STEEL: REVENUE SHARE BY SEGMENT, 2017 (%)
FIGURE 62. U.S. STEEL: REVENUE SHARE BY GEOGRAPHY, 2017 (%)
The demand for advanced high-strength steel is on an increase in the automobile industry, as these are much stronger than the conventional steel and offer high work hardening and bake capabilities that further increase formability of part geometries. In addition, according to the leading executives, multiple steel organizations focus on R&D activities to improve technologies that are necessary for manufacturing of AHSS. This would spur the growth of the advanced high-strength steel market.
A German supplier, Continental Automotive estimates growth in the global production of cars and light trucks during the forecast period. The increase in sales is being witnessed significantly in North America, Asia-Pacific, and LAMEA, while moderate growth is witnessed in Europe. Although penetration of these automobiles into households has increased over the past decade, there is scope for further gains due to the growth of the middle income group population in these countries.
Based on grade types in the global advanced high-strength steel industry, dual phase (DP) steel is widely used in the global advanced high-strength steel market, owing to its high durability and ductility properties. In vehicles, these new steels play a significant role in the crash zones, which are designed to absorb the energy from the impact during a collision. Therefore, dual phase generated the highest revenue in 2016, and is anticipated to remain dominant throughout the analysis period.
Start reading instantly.
This Report and over 67,068+ more Reports, Available with Avenue Library. T&C*.
Enterprise
License/PDF
Library
Membership
*Taxes/Fees, if applicable will be added during checkout. All prices in USD
To ensure high-level data integrity, accurate analysis, and impeccable forecasts
For complete satisfaction
On-demand customization of scope of the report to exactly meet your needs
Targeted market view to provide pertinent information and save time of readers
Get insights on topics that are crucial for your business. Stay abreast of your interest areas.
Get Industry Data AlertsTo ensure high-level data integrity, accurate analysis, and impeccable forecasts
For complete satisfaction
On-demand customization of scope of the report to exactly meet your needs
Targeted market view to provide pertinent information and save time of readers