
Aerospace Service Robotics Market Research, 2033
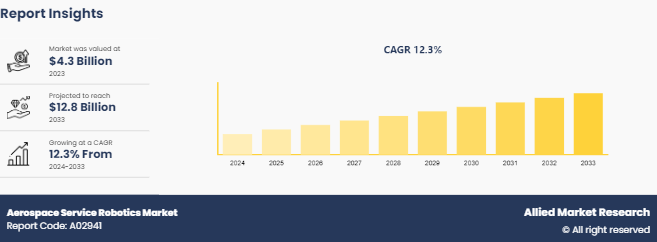
The global aerospace service robotics market was valued at $4.3 billion in 2023, and is projected to reach $12.8 billion by 2033, growing at a CAGR of 12.3% from 2024 to 2033.
Market Introduction and Definition
Aerospace service robotics refers to the specialized field within robotics dedicated to designing, developing, and deploying robotic systems tailored for tasks in the aerospace industry. These robotic systems are engineered to operate in various aerospace environments, including space stations, spacecraft, satellites, and aircraft. They are designed to perform a wide range of functions such as maintenance, repair, inspection, assembly, and servicing of aerospace vehicles and infrastructure. Aerospace service robots often incorporate advanced technologies such as artificial intelligence, autonomous navigation, precision manipulation, and sensor integration to execute their tasks efficiently and safely in the challenging and demanding conditions of space and aviation.
The escalating demand for efficiency increasing the global sales of aerospace service robotics. In today's competitive landscape, businesses are fervently seeking avenues to optimize operations and streamline processes. This quest for efficiency extends across diverse sectors, from manufacturing to service industries, compelling organizations to seek innovative solutions. By embracing technologies that promise to enhance productivity and reduce operational costs, businesses can gain a competitive edge in the aerospace service robotics industry. Consequently, rise in demand for efficiency fuels the adoption of advanced solutions, propelling sales and fostering a culture of continuous improvement and optimization within enterprises.
The burgeoning commercial aerospace sector emerges as a significant catalyst driving sales growth. With the rapid expansion of air travel and increase in demand for commercial flights, aerospace companies are under pressure to innovate and streamline their operations. This growth trajectory creates an opportunity for cutting-edge solutions that enhance efficiency, safety, and performance. From aircraft manufacturing to maintenance and passenger services, there is rising need for advanced technologies that can meet the evolving demands of the industry. Consequently, the growing commercial aerospace sector presents lucrative opportunities for companies offering innovative products and services, spurring aerospace service robotics market share.
Key Takeaways
The aerospace service robotics market industry covers 20 countries. The research includes a segment analysis of each country in terms of value ($Billion) for the projected period 2024-2033.
More than 1,500 product literatures, industry releases, annual reports, and other such documents of major aerospace service robotics industry participants along with authentic industry journals, trade associations' releases, and government websites have been reviewed for generating high-value industry insights.
The study integrated high-quality data, professional opinions and analysis, and critical independent perspectives. The research approach is intended to provide a balanced view of global markets and to assist stakeholders in making educated decisions in order to achieve their most ambitious growth objectives.
Recent Key Strategies and Developments
In February 2022, the Confirm Smart Manufacturing Research Centre at Limerick University integrated KUKA industrial robots into their research activities. Confirm employs industry-leading ultrasonic welding equipment to support advanced joining development. Additionally, they are pioneering advancements in the latest safety arc composite materials. As part of this development, it is crucial to understand the joining processes for these composites. The KUKA industrial robot in the joining cell is utilized by Confirm to join composite aircraft materials, which could potentially be adopted by major aircraft manufacturers.
In March 2022, Oceaneering Mobile Robotics unveiled three new mobile robots for the North American market: the UniMover D 100, UniMover O 600, and MaxMover CB D 2000. These robots have navigation technology, reducing the need for additional infrastructure and enabling easier & more flexible deployment. As with all Oceaneering mobile robots, these new models can operate together as a mixed fleet, offering a versatile solution to meet diverse client needs.
Key Market Dynamics
The global aerospace service robotics market growth has been seen due to increase in demand for efficiency, continuous advancements in robotics technology, and growth in the commercial aerospace sector. However, complexity of integration, and limited accessibility are expected to hinder the market growth. Moreover, space exploration expansion, autonomous aircraft maintenance to create lucrative opportunities in the global aerospace service robotics market.
The rising wave of space exploration initiatives is a key driver boosting sales. With a renewed global interest in venturing beyond Earth's confines, space agencies, and private enterprises are intensifying their efforts to explore the cosmos. This increased activity is driving a growing demand for advanced technologies and solutions tailored to space exploration. From satellite deployment to lunar missions and beyond, there's a strong appetite for innovations that can push the boundaries of what's possible in space. As a result, the thriving space exploration landscape offers a prime opportunity for companies to showcase their expertise and capitalize on lucrative opportunities, driving increase in aerospace service robotics market size.
The emergence of autonomous aircraft maintenance heralds a paradigm shift, unlocking vast opportunities in the market. With advancements in artificial intelligence and robotics, the aviation industry is witnessing a transformative evolution towards autonomous maintenance solutions. These innovative technologies promise to revolutionize traditional maintenance practices by enabling unmanned aircraft inspections, repairs, and diagnostics. The potential benefits are immense, including enhanced operational efficiency, reduced downtime, and improved safety. As the demand for more cost-effective and reliable maintenance solutions grows, the adoption of autonomous aircraft maintenance presents a compelling opportunity for companies to capitalize on this burgeoning market, driving substantial aerospace service robotics market forecast.
The expanding constellation of satellites orbiting the Earth has catalyzed a burgeoning demand for servicing and maintenance solutions. With an increasing reliance on satellite technology for communication, navigation, and Earth observation, the need to ensure the operational integrity and longevity of these assets is paramount. This surge in satellite deployments, coupled with the finite lifespan of onboard components, underscores the lucrative aerospace service robotics market opportunity. From refueling and component replacement to deorbiting and end-of-life disposal, the market for satellite servicing presents a compelling avenue for innovation and growth, driven by the imperative of sustaining and optimizing satellite functionality in orbit.
Intellectual Property (IP) Trends of Global Aerospace Service Robotics Market
The aerospace organizations have relied on trade secrets and know-how to safeguard their intellectual property (IP) . However, over the past decade, there has been a notable shift towards using patents internationally. Patents provide legal protection and create a lasting competitive advantage. The shift towards patents is influenced by national policies, corporate incentives, and market dynamics. For instance, changes in the U.S. IP law have led to increased patent filings, while China’s patent quota system has encouraged high volumes of applications, although conversion to publications remains low. In Europe, aerospace companies are increasingly recognizing the significance of the aviation market and the competitive threat posed by indigenous industries. Consequently, patent activity is on the rise, reflecting technological advancements and market maturity. Companies involved in interactive robotics should strategically use IP rights to promote investments and maximize profits. A well-defined IP protection and enforcement strategy can greatly benefit firms in this field.
Market Segmentation
The aerospace service robotics market is segmented into component, application, payload, and region. On the basis of component, the market is divided into controller, sensor, drive, and end effector. As per application, the market is segregated into drilling, welding, sealing, assembling and disassembling, and others. By payload, it is classified into up to 50 Kg, 51 to 100 Kg, and Above 100 Kg. Region wise, the market is analyzed across North America, Europe, Asia-Pacific, and LAMEA.
Regional/Country Market Outlook
In the U.S., the trajectory of aerospace service robotics sales is expected to witness significant growth, propelled by several compelling factors. Firstly, with the country's robust aerospace industry accounting for approximately 48% of global aerospace manufacturing, there exists a substantial demand for cutting-edge robotics solutions to enhance operational efficiency and competitiveness. Additionally, stringent safety regulations and the need for precision in aerospace operations drive the adoption of robotics technology. Furthermore, the rising trend of space exploration initiatives and the burgeoning commercial aerospace sector create an ideal environment for the deployment of aerospace service robots. As companies prioritize automation to meet the increasing demands of the market, the U.S. emerges as a lucrative landscape ripe with opportunities for the growth of aerospace service robotics sales.
In June 2022, Mitsubishi Electric announced plans to establish a new factory in India dedicated to manufacturing factory automation control system products. The two-floor facility, spanning 15, 400 square meters, is expected to be constructed on a 40, 000 square-meter site near Pune. This new factory aims to enhance Mitsubishi Electric's production capabilities to meet the growing local demand for its products and will also support the Indian government's Make in India initiative.
In December 2023, Honeybee Robotics was selected for DARPA’s 10-Year Lunar Architecture (LunA-10) Capability Study to develop and integrate its innovative LUNARSABER technology (Lunar Utility Navigation with Advanced Remote Sensing and Autonomous Beaming for Energy Redistribution) . The proposed LUNARSABER, standing over 100 meters tall, is a deployable structure that combines solar power, power storage and transfer, communications, mesh networking, PNT (Position, Navigation, and Timing) , and surveillance into a single infrastructure.
Competitive Landscape
The major players operating in the aerospace service robotics market include ABB, AV&R, Electroimpact Inc., Fanuc Corporation, JH Robotics, Inc., KUKA AG, Mitsubishi Electric Corporation, OC Robotics, Universal Robots A/S, and Yaskawa Electric Corporation.
Other players in the aerospace service robotics market include Honeybee Robotics, Oceaneering International, Inc., Intuitive Machines, and so on.
Industry Trends:
In March 2024, Boeing announced significant investments in several Québec-based enterprises. The plan includes a $110 million anchor investment to establish an Aerospace Development Centre in the new Espace Aéro Innovation Zone, a $95 million investment in Wisk Aero’s (Mountain View, Calif., U.S.) autonomous, electric, four-passenger eVTOL (electric vertical takeoff and landing) aircraft development, and $35 million towards advanced landing gear research with Héroux-Devtek (Longueuil, Canada) .
In March 2024, Rolls-Royce announced plans to invest in expanding engine assembly, testing, and maintenance capacity at its UK and Germany sites to meet the increasing demand for Trent engine services. The British engine manufacturer confirmed $70.1 million investment, targeting two key locations: its headquarters in Derby, East Midlands, UK, and its facility in Dahlewitz, south of Berlin, Germany. This strategic investment aims to enhance Rolls-Royce’s network capacity and support its growing customer base.
Key Sources Referred
UK Space Agency
German Aerospace Center
Satellite Industry Association
Aerospace and Defence Industries Association of Europe
Aerospace Industries Association (AIA)
Key Benefits For Stakeholders
- This report provides a quantitative analysis of the market segments, current trends, estimations, and dynamics of the aerospace service robotics market analysis from 2024 to 2033 to identify the prevailing aerospace service robotics market opportunities.
- The market research is offered along with information related to key drivers, restraints, and opportunities.
- Porter's five forces analysis highlights the potency of buyers and suppliers to enable stakeholders make profit-oriented business decisions and strengthen their supplier-buyer network.
- In-depth analysis of the aerospace service robotics market segmentation assists to determine the prevailing market opportunities.
- Major countries in each region are mapped according to their revenue contribution to the global market.
- Market player positioning facilitates benchmarking and provides a clear understanding of the present position of the market players.
- The report includes the analysis of the regional as well as global aerospace service robotics market trends, key players, market segments, application areas, and market growth strategies.
Aerospace Service Robotics Market Report Highlights
| Aspects | Details |
| Market Size By 2033 | USD 12.8 Billion |
| Growth Rate | CAGR of 12.3% |
| Forecast period | 2024 - 2033 |
| Report Pages | 280 |
| By Component |
|
| By Application |
|
| By Payload |
|
| By Region |
|
| Key Market Players | OC Robotics, KUKA AG, AV&R, JH Robotics, Inc., Mitsubishi Electric Corporation, Fanuc Corporation, Universal Robots A/S, Electroimpact Inc., Yaskawa Electric Corporation, ABB |
Increased Use of AI and Machine Learning, Automation in Aircraft Maintenance, and Robotics in Manufacturing Processes are the upcoming trends of Aerospace Service Robotics Market in the globe
Assembling and Disassembling is the leading application of Aerospace Service Robotics Market
North America is the largest regional market for Aerospace Service Robotics
The estimated industry size of Aerospace Service Robotics is $ 12.8 billion in 2033
Sensor is the leading component of Aerospace Service Robotics Market
Loading Table Of Content...

