0
2021
Africa, Australia And New Zealand Dewatering Pumps Market

Africa, Australia and New Zealand Dewatering Pumps Market

by Type (Submersible dewatering pumps and Non-submersible dewatering pumps) and Application (Construction and Agriculture, Oil and Gas, Municipal, Mineral & Mining and Others): Opportunity Analysis and Industry Forecast, 2020-2027

Report Code: A10545
Mar 2021 | Pages: 100
Tables: 40
Charts: 48
  • Formats*:

  • pdf

    Single User License, Five User
    License & Enterprise User License

  • xls

    Data Pack Excel License

  • ppt

    It comes with the additional cost
    of $2500.00 contact sales.


COVID-19

Pandemic disrupted the entire world and affected many industries.

Get detailed COVID-19 impact analysis on the Africa, Australia And New Zealand Dewatering Pumps Market

Request Now !

Africa, Australia and New Zealand Dewatering Pumps Market Outlook- 2027:

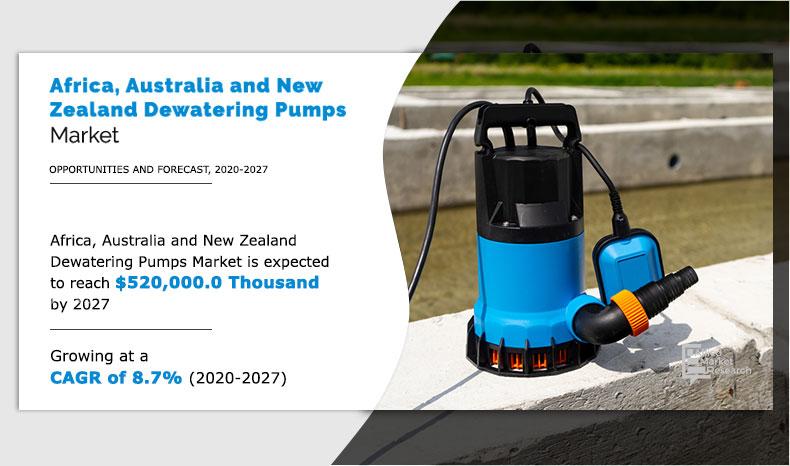
The Africa, Australia and New Zealand dewatering pumps market size was valued at $303,709.9 thousand in 2019, and is expected to reach $520,000.0 thousand by 2027, registering a CAGR of 8.7% from 2020 to 2027. Dewatering pumps are used to remove water from places such as construction sites, mines, tunnels and drainage systems. These pumps are used to maintain the water level or remove unwanted water from underground places. The motor in the pumps helps in suction of the water through inlet and throw it out from the other end. 

The Africa, Australia and New Zealand Dewatering Pumps Market was hampered owing to restriction in construction activities , in addition to decline in sales through distributors and retail stores.

Urbanization and industrialization in developing countries is majorly driving the dewatering pump market. Increase in demand for construction & infrastructure developments largely drives the Africa, Australia and New Zealand dewatering pumps market growth. Rise in industrialization in developing countries has augmented the requirement of dewatering pump. Industries such as mining, construction, powerhouses and wastewater management, require dewatering pump that can pump out the water from base of the infrastructures. In addition, the dewatering pumps are also available in different sizes and capacity or power.

Africa,-Australia-and-New-Zealand-Dewatering-Pumps-Market,-2020-2027

Further, the installation of these dewatering pumps is an easy process and does not require a lot of effort. Moreover, the cost of the dewatering pumps is also not very high. Therefore, factors such as availability of wide range and standards, easy installation and operation of dewatering pumps drives the Africa, Australia and New Zealand dewatering pumps market scope. However, submersible pumps work under water under adverse conditions such as unstable pressure, temperature, vibrations and several other factors in the industry that physically damage the submersible dewatering pumps. This leads to rise in expenditure in maintenance and monitoring of the dewatering pump. Thus, this act as a restraint factor to the dewatering pump market. 

In addition, during the outbreak of COVID-19, construction, manufacturing, hotel, and tourism industries were majorly affected. Construction and mining activities were also stopped or restricted to a huge extent.

Manufacturing and transportation activities, along with their supply chains were hampered on a global level. This led to decline in construction activities, which directly hindered the Africa, Australia and New Zealand dewatering pumps market. However, gradually all industries are resuming their regular manufacturing and services. This is further expected to lead to re-initiation of dewatering pumps companies at their full-scale capacities, which is expected to help the market to start to recover by start of 2022. On the contrary, rise in demand for wastewater management treatment plants is a major opportunity to boost the dewatering pump market during the forecast period. 

The Africa, Australia and New Zealand dewatering pumps market is segmented on the basis of type, application, and region. On the basis of type, the market is divided into submersible dewatering pumps and non-submersible dewatering pumps. Depending on application, it is classified into construction and agriculture, oil and gas, municipal, mineral & mining and others. By country, it is analyzed across South Africa, Nigeria, New Zealand, Australia and rest of Africa.

Africa, Australia and New Zealand Dewatering Pumps Market
By Type

Your browser does not support the canvas element.

Non-submersible segment holds the largest share in Africa, Australia and New Zealand Dewatering Pumps market

By type, in 2019, the non-submersible segment dominated the Africa, Australia and New Zealand dewatering pumps market, in terms of revenue and the submersible segment is expected to witness growth at the highest CAGR during the forecast period. On the basis of application, the construction and agriculture segment led the market in 2019, in terms of revenue and municipal segment is anticipated to register highest CAGR during the forecast period. 

Africa, Australia and New Zealand Dewatering Pumps Market
By Application

Your browser does not support the canvas element.

Construction and agriculture segment holds dominant position in 2019

Competition analysis

The major players profiled in the Africa, Australia and New Zealand dewatering pumps market share include Atlas Copco/Varisco, Allight Sykes, Andrew Sykes, BBA Pumps (Bruin Buizen Apeldoorn BV), Clasal Pumps, Cornell Pumps, Godwin (part of Xylem), Gorman Rupp, Hidrostal, Impulse Pumps, Pioneer (A Franklin Electric company), and Selwood. The companies adopted strategies such as product launch and business expansion, to expand their portfolio and to offer service in new regions.

Africa, Australia and New Zealand Dewatering Pumps Market
By Country

2027
Rest Of Africa 
South Africa
Nigeria
New Zealand
Australia

Rest of Africa holds a dominant position in 2019 and Nigeria is expected to grow at a highest rate during the forecast period.

Key Benefits For Stakeholders

  • The report provides an extensive analysis of the current and emerging Africa, Australia and New Zealand dewatering pumps market trends and dynamics. 
  • In-depth Africa, Australia and New Zealand dewatering pumps market analysis is conducted by estimations for the key segments between 2020 and 2027. 
  • Extensive analysis of the market is conducted by following key product positioning and monitoring of top competitors within the market framework.
  • A comprehensive analysis of four major regions is provided to determine the prevailing opportunities in Africa, Australia and New Zealand dewatering pumps market.
  • The market forecast analysis from 2020 to 2027 is included in the report.
  • The key players operating in the Africa, Australia and New Zealand dewatering pumps market are profiled in this report and their strategies are analyzed thoroughly, which help understand the competitive outlook of the market industry.

Africa, Australia And New Zealand Dewatering Pumps Market: Key Segments

By Type

  • Submersible dewatering pumps
  • Non-submersible dewatering pumps

By Application 

  • Construction and Agriculture
  • Oil and Gas
  • Municipal
  • Mineral & Mining
  • Others

By Region

  • South Africa
  • Nigeria
  • New Zealand
  • Australia
  • Rest of Africa

Africa, Australia and New Zealand Dewatering Pumps Market Report Highlights

Aspects Details
By TYPE
  • Submersible dewatering pumps
  • Non-submersible dewatering pumps
By APPLICATION
  • Construction & agriculture
  • Oil & gas
  • Municipal
  • Mineral & mining
  • Others
By COUNTRY
  • South Africa
  • Nigeria
  • New Zealand
  • Australia
  • Rest of Africa
Key Market Players XYLEM, INC. (GODWIN), ANDREW SYKES GROUP PLC., BBA PUMPS BV, GORMAN-RUPP COMPANY, CLASAL, HIDROSTAL HOLDING AG, SEVEN GROUP HOLDINGS LIMITED, ATLAS COPCO AB, ROPER TECHNOLOGIES INC.(CORNELL PUMP COMPANY), WORKDRY INTERNATIONAL LIMITED (SELWOOD LTD.), PIONEER (A FRANKLIN ELECTRIC COMPANY)
 

CHAPTER 1:INTRODUCTION

1.1.Report description
1.2.Key market segments
1.3.Research methodology

1.3.1.Secondary research
1.3.2.Primary research
1.3.3.Analyst tools & models

CHAPTER 2:EXECUTIVE SUMMARY

2.2.CXO perspective

CHAPTER 3:MARKET OVERVIEW

3.1.Market definition and scope
3.2.Top investment pockets
3.3.Top winning strategies

3.3.1.Top winning strategies, by year
3.3.2.Top winning strategies, by development
3.3.3.Top winning strategies, by company
3.3.4.Market player positioning, 2019

3.4.Key forces shaping dewatering pumps industry
3.5.Market dynamics

3.5.1.Drivers

3.5.1.1.Industrialization and rapid urbanization in emerging economies
3.5.1.2.Cost-effective and easy handling

3.5.2.Restraint

3.5.2.1.Identifying corrosion and working status for submersible pumps

3.5.3.Opportunity

3.5.3.1.Rise in demand for wastewater management

3.6.COVID-19 impact analysis

CHAPTER 4:AFRICA, AUSTRALIA AND NEW ZEALAND DEWATERING PUMPS MARKET, BY TYPE

4.1.Market overview

4.1.1.Market size and forecast, by type

4.2.Submersible dewatering pumps

4.2.1.Key market trends, growth factors, and opportunities
4.2.2.Market size and forecast, by country

4.3.Non-submersible dewatering pumps

4.3.1.Key market trends, growth factors, and opportunities
4.3.2.Market size and forecast, by country

CHAPTER 5:AFRICA, AUSTRALIA, AND NEW ZEALAND DEWATERING PUMPS MARKET, BY APPLICATION

5.1.Overview

5.1.1.Market size and forecast, by application

5.2.Construction & agriculture

5.2.1.Key market trends, growth factors, and opportunities
5.2.2.Market size and forecast by country

5.3.Oil & gas

5.3.1.Key market trends, growth factors, and opportunities
5.3.2.Market size and forecast

5.4.Municipal

5.4.1.Key market trends, growth factors, and opportunities
5.4.2.Market size and forecast

5.5.Mineral & mining

5.5.1.Key market trends, growth factors, and opportunities
5.5.2.Market size and forecast

5.6.Others

5.6.1.Key market trends, growth factors, and opportunities
5.6.2.Market size and forecast

CHAPTER 6:AFRICA, AUSTRALIA, AND NEW ZEALAND DEWATERING PUMPS MARKET, BY COUNTRY

6.1.Overview

6.1.1.Market size and forecast, by country

6.2.South Africa

6.2.1.Key market trends, growth factors, and opportunities
6.2.2.Market size and forecast by type
6.2.3.Market size and forecast by application

6.3.Nigeria

6.3.1.Key market trends, growth factors, and opportunities
6.3.2.Market size and forecast by type
6.3.3.Market size and forecast by application

6.4.New Zealand

6.4.1.Key market trends, growth factors, and opportunities
6.4.2.Market size and forecast by type
6.4.3.Market size and forecast by application

6.5.Australia

6.5.1.Key market trends, growth factors, and opportunities
6.5.2.Market size and forecast by type
6.5.3.Market size and forecast by application

6.6.Rest of Africa

6.6.1.Key market trends, growth factors, and opportunities
6.6.2.Market size and forecast by type
6.6.3.Market size and forecast by application

CHAPTER 7:COMPANY PROFILES

7.1.ANDREW SYKES GROUP PLC.

7.1.1.Company overview
7.1.2.Key Executives
7.1.3.Company snapshot
7.1.4.Operating business segments
7.1.5.Product portfolio
7.1.6.Business performance

7.2.ATLAS COPCO AB

7.2.1.Company overview
7.2.2.Key Executives
7.2.3.Company snapshot
7.2.4.Operating business segments
7.2.5.Product portfolio
7.2.6.R&D Expenditure
7.2.7.Business performance
7.2.8.Key strategic moves and developments

7.3.BBA PUMPS BV

7.3.1.Company overview
7.3.2.Key Executives
7.3.3.Company snapshot
7.3.4.Operating business segments
7.3.5.Product portfolio
7.3.6.Key strategic moves and developments

7.4.CLASAL

7.4.1.Company overview
7.4.2.Company snapshot
7.4.3.Product portfolio

7.5.ROPER TECHNOLOGIES INC.(CORNELL PUMP COMPANY)

7.5.1.Company overview
7.5.2.Key Executives
7.5.3.Company snapshot
7.5.4.Operating business segments
7.5.5.Product portfolio
7.5.6.R&D Expenditure
7.5.7.Business performance

7.6.XYLEM, INC. (GODWIN)

7.6.1.Company overview
7.6.2.Key Executives
7.6.3.Company snapshot
7.6.4.Operating business segments
7.6.5.Product portfolio
7.6.6.R&D Expenditure
7.6.7.Business performance
7.6.8.Key strategic moves and developments

7.7.GORMAN-RUPP COMPANY

7.7.1.Company overview
7.7.2.Key Executives
7.7.3.Company snapshot
7.7.4.Operating business segments
7.7.5.Product portfolio
7.7.6.Business performance
7.7.7.Key strategic moves and developments

7.8.HIDROSTAL HOLDING AG

7.8.1.Company overview
7.8.2.Key Executives
7.8.3.Company snapshot
7.8.4.Product portfolio
7.9.IMPULSE PUMPS B.V.
7.9.1.Company overview
7.9.2.Company snapshot
7.9.3.Product portfolio

7.10.PIONEER (A FRANKLIN ELECTRIC COMPANY)

7.10.1.Company overview
7.10.2.Key Executives
7.10.3.Company snapshot
7.10.4.Operating business segments
7.10.5.Product portfolio
7.10.6.Business performance
7.10.7.R&D Expenditure
7.10.8.Key strategic moves and developments

7.11.WORKDRY INTERNATIONAL LIMITED (SELWOOD LTD.)

7.11.1.Company overview
7.11.2.Company snapshot
7.11.3.Product portfolio
7.11.4.Key strategic moves and developments

7.12.SEVEN GROUP HOLDINGS LIMITED

7.12.1.Company overview
7.12.2.Key Executives
7.12.3.Company snapshot
7.12.4.Operating business segments
7.12.5.Product portfolio
7.12.6.Business performance

LIST OF TABLES

TABLE 01.AFRICA, AUSTRALIA AND NEW ZEALAND DEWATERING PUMPS MARKET REVENUE, BY TYPE, 2019-2027 ($THOUSAND)
TABLE 02.AFRICA, AUSTRALIA AND NEW ZEALAND DEWATERING PUMPS MARKET REVENUE FOR SUBMERSIBLE DEWATERING PUMPS, BY COUNTRY, 2019-2027 ($THOUSAND)
TABLE 03.AFRICA, AUSTRALIA AND NEW ZEALAND DEWATERING PUMPS MARKET REVENUE FOR NON-SUBMERSIBLE DEWATERING PUMPS, BY COUNTRY, 2019-2027 ($THOUSAND)
TABLE 04.AFRICA, AUSTRALIA, AND NEW ZEALAND DEWATERING PUMPS MARKET, BY APPLICATION, 2019-2027 ($THOUSAND)
TABLE 05.AFRICA, AUSTRALIA, AND NEW ZEALAND DEWATERING PUMPS MARKET REVENUE FOR CONSTRUCTION & AGRICULTURE, BY COUNTRY 2019–2027 ($THOUSAND)
TABLE 06.AFRICA, AUSTRALIA, AND NEW ZEALAND DEWATERING PUMPS MARKET REVENUE FOR OIL & GAS, BY COUNTRY 2019–2027($THOUSAND)
TABLE 07.AFRICA, AUSTRALIA, AND NEW ZEALAND DEWATERING PUMPS MARKET REVENUE FOR MUNICIPAL, BY COUNTRY 2019–2027($THOUSAND)
TABLE 08.AFRICA, AUSTRALIA, AND NEW ZEALAND DEWATERING PUMPS MARKET REVENUE FOR MINERAL & MINING, BY COUNTRY 2019–2027($THOUSAND)
TABLE 09.AFRICA, AUSTRALIA, AND NEW ZEALAND DEWATERING PUMPS MARKET REVENUE FOR OTHERS, BY COUNTRY 2019–2027($THOUSAND)
TABLE 10.AFRICA, AUSTRALIA, AND NEW ZEALAND DEWATERING PUMPS MARKET REVENUE, BY COUNTRY, 2019-2027 ($THOUSAND)
TABLE 11.AFRICA, AUSTRALIA, AND NEW ZEALAND DEWATERING PUMPS MARKET REVENUE FOR SOUTH AFRICA, BY TYPE, 2019–2027($THOUSAND)
TABLE 12.AFRICA, AUSTRALIA, AND NEW ZEALAND DEWATERING PUMPS MARKET REVENUE FOR SOUTH AFRICA, BY APPLICATION, 2019–2027($THOUSAND)
TABLE 13.AFRICA, AUSTRALIA, AND NEW ZEALAND DEWATERING PUMPS MARKET REVENUE FOR NIGERIA, BY TYPE, 2019–2027($THOUSAND)
TABLE 14.AFRICA, AUSTRALIA, AND NEW ZEALAND DEWATERING PUMPS MARKET REVENUE FOR NIGERIA, BY APPLICATION, 2019–2027($THOUSAND)
TABLE 15.AFRICA, AUSTRALIA, AND NEW ZEALAND DEWATERING PUMPS MARKET REVENUE FOR NEW ZEALAND, BY TYPE, 2019–2027($THOUSAND)
TABLE 16.AFRICA, AUSTRALIA, AND NEW ZEALAND DEWATERING PUMPS MARKET REVENUE FOR NEW ZEALAND, BY APPLICATION, 2019–2027($THOUSAND)
TABLE 17.AFRICA, AUSTRALIA, AND NEW ZEALAND DEWATERING PUMPS MARKET REVENUE FOR AUSTRALIA, BY TYPE, 2019–2027($THOUSAND)
TABLE 18.AFRICA, AUSTRALIA, AND NEW ZEALAND DEWATERING PUMPS MARKET REVENUE FOR AUSTRALIA, BY APPLICATION,  2019–2027($THOUSAND)
TABLE 19.AFRICA, AUSTRALIA, AND NEW ZEALAND DEWATERING PUMPS MARKET REVENUE FOR REST OF AFRICA, BY TYPE, 2019–2027($THOUSAND)
TABLE 20.AFRICA, AUSTRALIA, AND NEW ZEALAND DEWATERING PUMPS MARKET REVENUE FOR REST OF AFRICA, BY APPLICATION, 2019–2027($THOUSAND)
TABLE 21.ANDREW SYKES: KEY EXECUTIVES
TABLE 22.ANDREW SYKES: COMPANY SNAPSHOT
TABLE 23.ANDREW SYKES: OPERATING SEGMENTS
TABLE 24.ANDREW SYKES: PRODUCT PORTFOLIO
TABLE 25.ATLAS COPCO: KEY EXECUTIVES
TABLE 26.ATLAS COPCO: COMPANY SNAPSHOT
TABLE 27.ATLAS COPCO: OPERATING SEGMENTS
TABLE 28.ATLAS COPCO: PRODUCT PORTFOLIO
TABLE 29.BBA PUMPS: KEY EXECUTIVES
TABLE 30.BBA PUMPS: COMPANY SNAPSHOT
TABLE 31.BBA PUMPS: OPERATING SEGMENTS
TABLE 32.BBA PUMPS: PRODUCT PORTFOLIO
TABLE 33.CLASAL: COMPANY SNAPSHOT
TABLE 34.CLASAL: PRODUCT PORTFOLIO
TABLE 35.ROPER : KEY EXECUTIVES
TABLE 36.ROPER: COMPANY SNAPSHOT
TABLE 37.ROPER: OPERATING SEGMENTS
TABLE 38.ROPER: PRODUCT PORTFOLIO
TABLE 39.XYLEM: KEY EXECUTIVES
TABLE 40.XYLEM: COMPANY SNAPSHOT
TABLE 41.XYLEM: OPERATING SEGMENTS
TABLE 42.XYLEM: PRODUCT PORTFOLIO
TABLE 43.GORMAN-RUPP : KEY EXECUTIVES
TABLE 44.GORMAN-RUPP : COMPANY SNAPSHOT
TABLE 45.GORMAN-RUPP : OPERATING SEGMENTS
TABLE 46.GORMAN-RUPP: PRODUCT PORTFOLIO
TABLE 47.HIDROSTAL: KEY EXECUTIVES
TABLE 48.HIDROSTAL: COMPANY SNAPSHOT
TABLE 49.HIDROSTAL: PRODUCT PORTFOLIO
TABLE 50.IMPULSE: COMPANY SNAPSHOT
TABLE 51.IMPULSE: PRODUCT PORTFOLIO
TABLE 52.FRANKLIN: KEY EXECUTIVES
TABLE 53.FRANKLIN: COMPANY SNAPSHOT
TABLE 54.FRANKLIN: OPERATING SEGMENTS
TABLE 55.FRANKLIN: PRODUCT PORTFOLIO
TABLE 56.WORKDRY: COMPANY SNAPSHOT
TABLE 57.WORKDRY: PRODUCT PORTFOLIO
TABLE 58.SEVEN GROUP: KEY EXECUTIVES
TABLE 59.SEVEN GROUP: COMPANY SNAPSHOT
TABLE 60.SEVEN GROUP: OPERATING SEGMENTS
TABLE 61.SEVEN GROUP: PRODUCT PORTFOLIO

LIST OF FIGURES

FIGURE 01.KEY MARKET SEGMENTS
FIGURE 02.AFRICA, AUSTRALIA AND NEW ZEALAND DEWATERING PUMPS MARKET, 2019-2027
FIGURE 03.AFRICA, AUSTRALIA AND NEW ZEALAND DEWATERING PUMPS MARKET, BY COUNTRY, 2019-2027
FIGURE 04.AFRICA, AUSTRALIA AND NEW ZEALAND DEWATERING PUMPS MARKET: KEY PLAYERS
FIGURE 05.TOP INVESTMENT POCKETS
FIGURE 06.TOP WINNING STRATEGIES, BY YEAR, 2017–2021
FIGURE 07.TOP WINNING STRATEGIES, BY DEVELOPMENT, 2017–2021 (%)
FIGURE 08.TOP WINNING STRATEGIES, BY COMPANY, 2017–2021
FIGURE 09.MARKET PLAYER POSITIONING, 2020
FIGURE 10.LOW-TO-MODERATE BARGAINING POWER OF SUPPLIERS
FIGURE 11.MODERATE-TO-HIGH THREAT OF NEW ENTRANTS
FIGURE 12.MODERATE THREAT OF SUBSTITUTES
FIGURE 13.MODERATE INTENSITY OF RIVALRY
FIGURE 14.MODERATE BARGAINING POWER OF BUYERS
FIGURE 15.MARKET DYNAMICS
FIGURE 16.AFRICA, AUSTRALIA AND NEW ZEALAND DEWATERING PUMPS MARKET, BY TYPE, 2019-2027
FIGURE 17.AFRICA, AUSTRALIA, AND NEW ZEALAND DEWATERING PUMPS MARKET, BY APPLICATION 2019-2027
FIGURE 18.AFRICA, AUSTRALIA, AND NEW ZEALAND DEWATERING PUMPS MARKET, BY COUNTRY, 2019–2027
FIGURE 19.SOUTH AFRICA MARKET REVENUE, 2019-2027 ($THOUSAND)
FIGURE 20.NIGERIA MARKET REVENUE, 2019-2027 ($THOUSAND)
FIGURE 21.NEW ZEALAND MARKET REVENUE, 2019-2027 ($THOUSAND)
FIGURE 22.AUSTRALIA MARKET REVENUE, 2019-2027 ($THOUSAND)
FIGURE 23.REST OF AFRICA MARKET REVENUE, 2019-2027 ($THOUSAND)
FIGURE 24.ANDREW SYKES: REVENUE, 2017–2019 ($MILLION)
FIGURE 25.ANDREW SYKES: REVENUE SHARE BY SEGMENT, 2019 (%)
FIGURE 26.ANDREW SYKES: REVENUE SHARE BY REGION, 2019 (%)
FIGURE 27.ATLAS COPCO: R&D EXPENDITURE, 2017–2019 ($MILLION)
FIGURE 28.ATLAS COPCO: REVENUE, 2017–2019 ($MILLION)
FIGURE 29.ATLAS COPCO: REVENUE SHARE BY SEGMENT, 2019 (%)
FIGURE 30.ATLAS COPCO: REVENUE SHARE BY REGION, 2019 (%)
FIGURE 31.ROPER: R&D EXPENDITURE, 2017–2019 ($MILLION)
FIGURE 32.ROPER: REVENUE, 2017–2019 ($MILLION)
FIGURE 33.ROPER: REVENUE SHARE BY SEGMENT, 2019 (%)
FIGURE 34.ROPER: REVENUE SHARE BY REGION, 2019 (%)
FIGURE 35.XYLEM: R&D EXPENDITURE, 2017–2019 ($MILLION)
FIGURE 36.XYLEM: REVENUE, 2017–2019 ($MILLION)
FIGURE 37.XYLEM: REVENUE SHARE BY SEGMENT, 2019 (%)
FIGURE 38.XYLEM: REVENUE SHARE BY REGION, 2019 (%)
FIGURE 39.GORMAN-RUPP: REVENUE, 2017–2019 ($MILLION)
FIGURE 40.GORMAN-RUPP: REVENUE SHARE BY SEGMENT, 2019 (%)
FIGURE 41.GORMAN-RUPP: REVENUE SHARE BY REGION, 2019 (%)
FIGURE 42.FRANKLIN: REVENUE, 2017–2019 ($MILLION)
FIGURE 43.FRANKLIN: REVENUE SHARE BY SEGMENT, 2019 (%)
FIGURE 44.FRANKLIN: REVENUE SHARE BY REGION, 2019 (%)
FIGURE 45.FRANKLIN: R&D EXPENDITURE, 2017–2019 ($MILLION)
FIGURE 46.SEVEN GROUP: REVENUE, 2017–2019 ($MILLION)
FIGURE 47.SEVEN GROUP: REVENUE SHARE BY SEGMENT, 2019 (%)
FIGURE 48.SEVEN GROUP: REVENUE SHARE BY REGION, 2019 (%)


The Africa, Australia and New Zealand dewatering pumps market has high potential in the construction and mining industry, due to the expansion of construction and mining sector majorly in Africa. The current business scenario experiences rapid development in the construction and mining sector, leading to increased adoption of dewatering pumps, particularly in the developing countries such as Namibia, Ghana, Nigeria and others. In addition, availability of wide range and standards of dewatering pumps, their easy installation and operation drives the dewatering pumps market.  The Africa, Australia and New Zealand dewatering pumps market was valued at $303,709.9 thousand in 2019, and is expected to reach $520,000.0 thousand by 2027, registering a CAGR of 8.7% from 2020 to 2027.

However, submersible pumps work under water under adverse conditions and can cause wear and tear of the dewatering pumps. This leads to rise in expenditure in maintenance and monitoring of the dewatering pump. Rise in demand for dewatering pumps is expected to be witnessed in the near future, due to increase in awareness in carrying out treatment on wastewater. This factor is expected to create lucrative opportunities for the key players operating in the dewatering pumps market.

The companies adopted strategies such as product launch and business expansion to expand their portfolio and to offer service in new regions.
 

PURCHASE OPTIONS

Call or Email us

U.S.-Canada Toll-free: +1-800-792-5285
Int'l : +1-503-894-6022
Europe : +44-845-528-1300
Email : help@alliedmarketresearch.com
 
FREQUENTLY ASKED QUESTIONS?

A. The global Africa, Australia and New Zealand dewatering pump market size was valued at $303,709.9 thousand in 2019, and is expected to reach $520,000.0 thousand by 2027, registering a CAGR of 8.7% from 2020 to 2027.

A. The forecast period considered for the global Africa, Australia and New Zealand dewatering pump market is 2020 to 2027, wherein, 2019 is the base year, 2020 is the estimated year, and 2027 is the forecast year.

A. To get latest version of global Africa, Australia and New Zealand dewatering pump market report can be obtained on demand from the website.

A. The base year considered in the global Africa, Australia and New Zealand dewatering pump market report is 2019.

A. The top companies holding the market share in the global Africa, Australia and New Zealand dewatering pump market report include Atlas Copco/Varisco, Allight Sykes, Andrew Sykes, BBA Pumps (Bruin Buizen Apeldoorn BV), Clasal Pumps, Cornell Pumps, Godwin (part of Xylem), Gorman Rupp, Hidrostal, Impulse Pumps, Pioneer (A Franklin Electric company), and Selwood.

A. The top ten market players are selected based on two key attributes - competitive strength and market positioning

A. By type, in 2019 the non-submersible segment dominated the global Africa, Australia and New Zealand dewatering pump market, in terms of revenue and is expected to maintain this trend during the forecast period.

A. By application, the construction & agriculture segment is the highest share holder of global Africa, Australia and New Zealand dewatering pump market.

A. The report contains an exclusive company profile section, where leading 10 companies in the market are profiled. These profiles typically cover company overview, geographical presence, market dominance (in terms of revenue and volume sales), various strategies and recent developments.

A. The market value of the global Africa, Australia and New Zealand dewatering pump market is $289,292.7 thousand in 2020.

Looking for Customization?

 Customization Request

Have a Question?

 Speak with Analyst

Any Confusion?

 Inquire Before Buying

Have a glance of the Report

  Request Sample
RELATED TAGS

Purchase Full Report of
Africa, Australia And New Zealand Dewatering Pumps Market

Start reading instantly.
This Report and over 66,804+ more Reports, Available with Avenue Library. T&C*.

  • Online Only
  • $3,456
  • Online cloud access only
  • Restricted print, copy, paste & download
  • Read only
  • Free industry update
    (Within 180 days)
  • Free report update in next update cycle
    (Mar 2022 - Mar 2023)
  • Data Pack
  • $3,840
  • Restricted to one authorized user
  • One print only
  • Available in
    Excel
  • Free industry update
    (Within 180 days)
  •   Free report update in next update cycle
    (Mar 2022 - Mar 2023)
  • Single User
  • $5,769
  • Restricted to one authorized user
  • One print only
  • Available in
    PDF
  • Free industry update
    (Within 180 days)
  •   Free report update in next update cycle
    (Mar 2022 - Mar 2023)
  • Five Users
  • $6,450
  • Limited to five authorized users
  • Print upto five copies
  • Available in
    PDF
  • Free industry update
    (Within 180 days)
  •   Free report update in next update cycle
    (Mar 2022 - Mar 2023)
  • Enterprise
    License/PDF

  • $10,995
  • Unlimited
    within
    company/enterprise
  • Available in Excel & PDF
  • Free industry update
    (Within 180 days)
  •   Free report update in next update cycle
    (Mar 2022 - Mar 2023)
  • Library
    Membership

  • $999 $ 1,175
    Per User/ Per month/ Billed annually
  • Published Content
    E-access
  • Company Profiles
    E-access
  • Newly Added Content Access
  • 10 PDF
    Downloads
  • 5 Excel Data
    Pack Downloads
  • 250 Company Profiles PDF Downloads
  • Buy Now

*Taxes/Fees, if applicable will be added during checkout. All prices in USD

RELATED REPORTS
 

Why Allied Market Research?


Infallible Methodology

To ensure high-level data integrity, accurate analysis, and impeccable forecasts

Analyst Support

For complete satisfaction

Customization

On-demand customization of scope of the report to exactly meet your needs

TARGETED MARKET VIEW

Targeted market view to provide pertinent information and save time of readers

Get fresh content delivered

Get insights on topics that are crucial for your business. Stay abreast of your interest areas.

Get Industry Data Alerts

Why Allied Market Research?

Infallible Methodology

To ensure high-level data integrity, accurate analysis, and impeccable forecasts

Analyst Support

For complete satisfaction

Customization

On-demand customization of scope of the report to exactly meet your needs

TARGETED MARKET VIEW

Targeted market view to provide pertinent information and save time of readers