
Agricultural Microbial Market Research, 2033
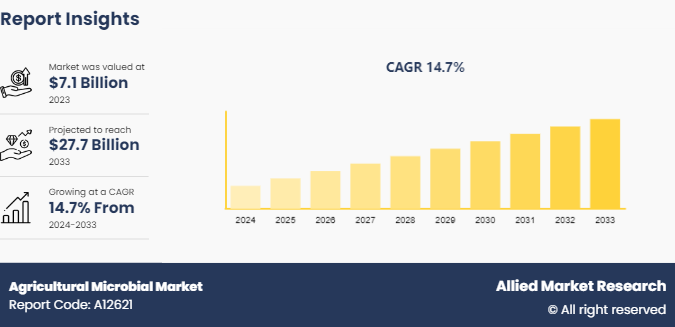
The global agricultural microbial market was valued at $7.1 billion in 2023, and is projected to reach $27.7 Billion by 2033, growing at a CAGR of 14.7% from 2024 to 2033.
Market Introduction and Definition
Agricultural microbials refer to a diverse group of microorganisms, including bacteria, fungi, viruses, and protozoa, that are used in agriculture to enhance plant growth, improve crop yields, and manage agricultural pests and diseases. These beneficial microbes can be naturally occurring or genetically engineered and are often applied through soil amendments, seed treatments, or foliar sprays. Agricultural microbials play a crucial role in sustainable farming practices by promoting plant health, reducing the need for chemical fertilizers and pesticides, and contributing to environmental conservation.
One of the primary applications of agricultural microbials is in improving soil health and fertility. Soil microorganisms such as nitrogen-fixing bacteria (e.g., Rhizobium species) and mycorrhizal fungi establish symbiotic relationships with plants, enhancing nutrient uptake and promoting robust plant growth. Nitrogen-fixing bacteria convert atmospheric nitrogen into a form that plants utilize, significantly reducing the need for synthetic nitrogen fertilizers. Mycorrhizal fungi extend the root system of plants, allowing them to access water and nutrients more efficiently. These interactions not only improve crop yields but also enhance soil structure and fertility over time, promoting sustainable agricultural practices.
Agricultural microbials are integral to organic farming systems, where synthetic chemicals are restricted or prohibited. Organic farmers rely on microbial inoculants to maintain soil fertility, manage pests and diseases, and promote plant health. Products such as compost teas, microbial biofertilizers, and biopesticides are commonly used in organic farming practices. For instance, mycorrhizal fungi inoculants are applied to enhance nutrient uptake in organic vegetable production, while microbial-based compost teas are used to suppress soil-borne diseases and improve soil microbial diversity. The use of agricultural microbials in organic farming aligns with the principles of ecological sustainability and biodiversity conservation.
Key Takeaways
The agricultural microbials industry covers 20 countries. The research includes a segment analysis of each country in terms of value for the projected period.
The study integrated high-quality data, professional opinions and analysis, and critical independent perspectives. The research approach is intended to provide a balanced view of the global agricultural microbial market overview and to assist stakeholders in making educated decisions to achieve their growth objectives.
Over 2, 200 product literature, annual reports, industry statements, and other comparable materials from major industry participants were reviewed to gain a better understanding of the agricultural microbials market size.
The agricultural microbials market share is highly fragmented, with several players including Bayer AG, BASF SE, Syngenta AG, Corteva, Novozymes A/S, Dow, Marrone Bio Innovations, Certis USA L.L.C., Valent U.S.A., and BioWorks, Inc. Also tracked key strategies such as acquisitions, product launches, mergers, and expansion of the players operating in the agricultural microbials market growth.
Segment Overview
The agricultural microbial market is segmented into microbe type, crop type, formulation, application, and region. On the basis of microbe type, the market is divided into bacteria, fungi, viruses, and others. On the basis of crop type, the market is classified into cereals & grains, fruits & vegetables, oilseeds & pulses, and others. On the basis of formulation, the market is bifurcated into liquid and dry. On the basis of application, the market is categorized into soil treatment, seed treatment, foliar spray, and others. Region-wise, the market is studied across North America, Europe, Asia-Pacific, and LAMEA.
Key Market Dynamics
The rise in demand for sustainable agriculture is expected to drive the growth of the agricultural microbials market during the forecast period. There is a significant shift towards more sustainable and eco-friendly agricultural practices as awareness of the environmental impact of traditional farming methods grows. Traditional farming heavily relies on chemical fertilizers and pesticides, which, although effective in boosting crop yields, often lead to adverse effects such as soil degradation, water contamination, and loss of biodiversity. The environmental costs of these conventional methods have prompted farmers, policymakers, and consumers to seek alternatives that are less harmful to the ecosystem. In the Union Budget 2022-23, the Department of Agriculture, Cooperation, and Farmers' Welfare has been allocated (INR 1.24 lakh crore) $15.9 billion. To ensure that the latest technologies, including improved crop seeds, new livestock and fish breeds, and advanced production and protection methods, reach farmers, a network of 729 Krishi Vigyan Kendras has been established at the district level across the country.
Microbial products, which include beneficial bacteria, fungi, viruses, and protozoa, present a promising natural alternative to synthetic agrochemicals. These microbes can enhance soil fertility, improve plant health, and protect crops from pests and diseases, all while minimizing the negative environmental impacts associated with chemical inputs. For instance, certain bacteria and fungi can fix atmospheric nitrogen, making it available to plants and reducing the need for nitrogen-based fertilizers.
However, the high initial cost of microbial products and limited awareness among farmers is expected to hinder the market growth during the forecast period. One of the primary challenges is the relatively high cost of microbial solutions compared to traditional chemical fertilizers and pesticides. These products often involve sophisticated production processes, stringent quality control, and specific storage requirements, all of which contribute to higher prices. For many farmers, especially those operating with thin profit margins, the upfront investment in microbial products can be prohibitive. This financial hurdle is particularly pronounced in developing regions where access to capital is limited and cost considerations play a crucial role in decision-making.
Moreover, the limited awareness and understanding of microbial products among farmers further impede their adoption. Many farmers are accustomed to the long-established use of chemical inputs, which have been widely marketed and supported through various agricultural extension services over the years. Transitioning to microbial solutions requires a fundamental shift in farming practices and mindset. Farmers need to be educated about the benefits, application methods, and expected outcomes of using microbial products. Without proper knowledge and training, farmers are hesitant to adopt new technologies, fearing the risk of lower yields or crop failures.
Regional Market Outlook
Region-wise, the market is divided into North America, Europe, Asia-Pacific, and LAMEA. In North America, the agricultural microbial market is driven by factors such as increasing demand for sustainable farming practices, rising awareness about the benefits of microbial products in agriculture, and government initiatives promoting the use of microbial agents to reduce chemical inputs. The U.S. and Canada are major contributors to the agricultural microbial market in North America, with a significant presence of key players and research institutions focusing on microbial solutions for crop protection, soil health, and plant nutrition. In 2022, 22.1 million full- and part-time jobs were related to the agricultural and food sectors which is 10.4% of total U.S. employment.

The Asia-Pacific region is witnessing rapid growth in the agricultural microbial market due to factors such as increasing population, shrinking arable land, and growing awareness about the adverse effects of chemical pesticides and fertilizers on human health and the environment. Countries such as China, India, Japan, Australia, and South Korea are major contributors to the agricultural microbial market in Asia-Pacific, with a large agricultural sector and significant investments in research and development of microbial technologies.
Competitive Analysis
Key market players in the agricultural microbial market include Bayer AG, BASF SE, Syngenta AG, Corteva, Novozymes A/S, Dow, Marrone Bio Innovations, Certis USA L.L.C., Valent U.S.A., and BioWorks, Inc.
Industry Trends
In February 2024, John Deere and GUSS Automation introduced the Electric GUSS, the world's first fully electric autonomous herbicide orchard sprayer. This groundbreaking machine enables growers to remotely control multiple sprayers and incorporates a smart spraying weed detection system, which minimizes herbicide usage and enhances sustainability. The Electric GUSS marks a significant advancement in precision agriculture. Thus, the increase in demand for electric autonomous herbicide orchard sprayer is expected to boost the growth of agricultural microbials market.
In February 2024, Mahindra unveiled two new tractor models at the National Farm Machinery Show. These "Powered by OJA" sub-compact and compact tractors are engineered to enhance the user experience with increased power, comfort, and advanced features.
In April 2023, Native Microbials, a leading animal health and nutrition biotechnology firm, received a $1.4 million grant from the USDA's Natural Resources Conservation Service (NRCS) through the Conservation Innovation Grants (CIG) program. Agriculture Secretary Tom Vilsack announced the grant, highlighting the USDA's commitment to partnering with innovators in climate-smart agriculture.
In July 2022, LALFIX START SPHERICAL Granule is a new granular inoculant that combines two unique rhizobium strains with a plant growth-promoting microorganism (PGPM) , Bacillus velezensis. New to the Canadian market, this robust and proven PGPM increases root mass and enhances phosphorus solubilization.
In September 2022, Corteva, Inc., and Symborg announced that Corteva has signed a definitive agreement to acquire Symborg, an expert in microbiological technologies based in Murcia, Spain. Respected throughout the biologicals industry, Symborg possesses a diversified existing portfolio, an emerging biocontrol pipeline, and a skilled employee base with robust technical knowledge and demand generation expertise.
Historic Trends of the Agricultural Microbial Market
In the 1910s, Martinus Beijerinck made significant contributions to agricultural microbiology by isolating nitrogen-fixing bacteria from the root nodules of leguminous plants. This discovery laid the foundation for the development of microbial inoculants for agriculture.
In the 1940s, the discovery and commercialization of chemical fertilizers marked a significant milestone in agricultural practices. Chemical fertilizers provide a readily available and easily applicable source of essential nutrients for crops, such as nitrogen, phosphorus, and potassium.
In the 1970s, the advent of molecular biology techniques revolutionized the study of microbial diversity and function in agricultural ecosystems. The development of methods for sequencing DNA, such as the Sanger sequencing method, provided scientists with the tools to decipher the genetic code of microorganisms. This enabled the identification and characterization of microbial species present in agricultural soils, plant roots, and other ecosystems.
In the 1990s, the first genetically modified crops (GM crops) were commercially introduced, primarily in the U.S. These crops were genetically engineered to possess traits such as herbicide resistance, insect resistance, or improved shelf life.
The 2000s gained an increased awareness of the environmental impact of conventional agricultural practices, including the use of synthetic fertilizers and pesticides. Concerns over soil degradation, water pollution, biodiversity loss, and greenhouse gas emissions prompted a search for more sustainable alternatives.
Key Referred Sources
The American Society for Microbiology
The Organic Agriculture Research and Extension Initiative (OREI)
The American Society for Microbiology
Food and Agricultural Organization of the United Nations
Key Benefits For Stakeholders
This report provides a quantitative analysis of the market segments, current trends, estimations, and dynamics of the agricultural microbial market analysis from 2024 to 2033 to identify the prevailing agricultural microbial market opportunities.
The market research is offered along with information related to key drivers, restraints, and opportunities.
Porter's five forces analysis highlights the potency of buyers and suppliers to enable stakeholders make profit-oriented business decisions and strengthen their supplier-buyer network.
In-depth analysis of the agricultural microbial market segmentation assists to determine the prevailing market opportunities.
Major countries in each region are mapped according to their revenue contribution to the global market.
Market player positioning facilitates benchmarking and provides a clear understanding of the present position of the market players.
The report includes the analysis of the regional as well as global agricultural microbial market trends, key players, market segments, application areas, and market growth strategies.
Agricultural Microbial Market Report Highlights
| Aspects | Details |
| Market Size By 2033 | USD 27.7 Billion |
| Growth Rate | CAGR of 14.7% |
| Forecast period | 2024 - 2033 |
| Report Pages | 300 |
| By Microbe Type |
|
| By Crop Type |
|
| By Formulation |
|
| By Application |
|
| By Region |
|
| Key Market Players | Syngenta AG, Certis USA L.L.C., Corteva, Bayer AG, BASF SE, Dow, Valent U.S.A., BioWorks, Inc, Marrone Bio Innovations, Novozymes A/S |
| | Others |
Analyst Review
Loading Table Of Content...

