
Agricultural Pheromone Market Research, 2033
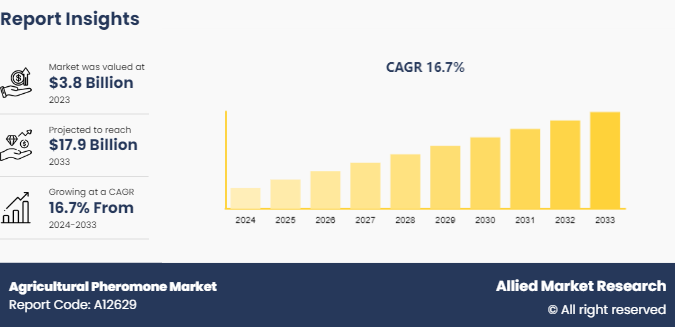
The global agricultural pheromone market was valued at $3.8 billion in 2023, and is projected to reach $17.9 Billion by 2033, growing at a CAGR of 16.7% from 2024 to 2033.
Market Introduction and Definition
Agricultural pheromones are chemical substances produced by insects and other animals that influence the behavior of members of the same species. In agriculture, these pheromones are utilized to manage pest populations through techniques such as mating disruption, mass trapping, and monitoring. This environment-friendly approach aims to reduce the reliance on chemical pesticides, promoting sustainable agricultural practices. Pheromones play a critical role in integrated pest management (IPM) systems, serving as a safer alternative to traditional chemical pesticides. By leveraging these natural substances, farmers can disrupt the mating patterns of pests, preventing the next generation from emerging. This method significantly lowers pest populations without harming beneficial insects, thus maintaining ecological balance.
Agricultural pheromones are extensively used in crop monitoring. They attract pests to traps, allowing farmers to monitor pest populations and their growth patterns. This early detection system helps in making informed decisions about when and where to apply control measures, optimizing the use of resources and minimizing damage to crops. In mass trapping, large numbers of pests are lured into traps using pheromones. This technique is especially effective against species that cause substantial economic damage to crop. By significantly reducing the population of the target pest, mass trapping helps in maintaining crop health and reducing the incidence of pest-related diseases.
Key Takeaways
The agricultural pheromone market industry covers 20 countries. The research includes a segment analysis of each country in terms of value for the projected period.
The study integrated high-quality data, professional opinions and analysis, and critical independent perspectives. The research approach is intended to provide a balanced view of the global agricultural pheromone market overview and to assist stakeholders in making educated decisions to achieve their growth objectives.
Over 3, 700 product literature, annual reports, industry statements, and other comparable materials from major industry participants were reviewed to gain a better understanding of the agricultural pheromone market size.
The agricultural pheromone market share is highly fragmented, with several players including FMC Corporation, Ephytia, BASF SE, MITSUI & CO., LTD, Biobest Group NV, Russell IPM, ISCA, Trécé Inc, BedoukianBio, and Pherobank. Also tracked key strategies such as acquisitions, product launches, mergers, and expansion of the players operating in the agricultural pheromone market growth.
Segment Overview
The agricultural pheromone market forecast is segmented into crop type, function, mode of application, and region. On the basis of crop type, the market is classified into field crops, fruit and vegetables, ornamental plants, and others. On the basis of function, the market is categorized into mass trapping, mating disruption, and monitoring and detection. On the basis of mode of application, the market is fragmented into traps, dispensers, sprays, and pheromone-impregnated materials. Region-wise, the market is studied across North America, Europe, Asia-Pacific, and LAMEA.
Key Market Dynamics
The adoption of integrated pest management (IPM) is expected to boost the growth of the agricultural pheromones market during the forecast period. The shift towards sustainable agriculture has been increasingly pronounced in recent years, driven by growing environmental concerns and the need for long-term viability in food production. Central to this movement is the adoption of Integrated Pest Management (IPM) practices, which seek to minimize reliance on chemical pesticides while effectively managing pest populations. Within the framework of IPM, pheromones have emerged as a key tool for monitoring and controlling pests in a manner that is both effective and environment-friendly.
Pheromones, as chemical signals produced by insects to communicate with each other, offer a non-toxic alternative to traditional pesticide use. By mimicking these natural signals, pheromone-based traps and lures can attract pests, disrupting their mating patterns and reducing populations without the need for harmful chemicals. This approach not only mitigates the risks associated with pesticide exposure to humans and non-target species but also helps to preserve beneficial insects and natural predators that play a crucial role in ecosystem balance. In April 2023, the California Department of Food and Agriculture granted $1.1 million to back two integrated pest management technical assistance (TA) initiatives. These initiatives aim to aid growers in adopting integrated pest management practices. This funding is in line with California's latest pest management strategic planning, titled "Accelerating Sustainable Pest Management: A Roadmap for California, " which aims to steer the shift toward safer, more sustainable pest control methods.
However, dependency on monitoring and detection is expected to hamper the agricultural pheromones market during the forecast period. The complexity of accurately assessing pest populations in agricultural fields can pose a substantial obstacle. Pests may exhibit heterogeneous distributions across the field, making it challenging to obtain representative samples for monitoring purposes. Inaccurate assessments of pest densities can result in suboptimal deployment of pheromone dispensers or traps, leading to inadequate pest control and potential crop damage. In addition, the effectiveness of monitoring and detection efforts can be influenced by environmental factors and pest behavior. Variations in temperature, humidity, and other environmental parameters can affect pest activity levels and movement patterns, complicating the interpretation of monitoring data. Moreover, certain pests may exhibit cryptic behavior or reside in inaccessible areas of the crop canopy, making it challenging to accurately assess their presence and abundance.
The synergy of agricultural pheromone with organic farming practices is expected to provide lucrative opportunities to the agricultural pheromone market during the forecast period. Agricultural pheromones offer a natural and environmentally friendly approach to pest management that aligns seamlessly with the principles of organic farming. Organic farming emphasizes the use of sustainable practices that minimize environmental impact and promote biodiversity. By utilizing pheromones to control pests, organic farmers can avoid the use of synthetic chemicals that may harm beneficial insects, soil health, and overall ecosystem balance. This synergy between pheromone-based pest control and organic farming practices fosters a holistic approach to agriculture that prioritizes both environmental stewardship and agricultural productivity.
One of the key trends of organic farming is in the reduction of synthetic inputs in agricultural production. Pheromones, being naturally occurring compounds, offer a non-toxic alternative to conventional pesticides, allowing organic farmers to meet the stringent requirements for organic certification. By incorporating pheromone-based pest control strategies into their farming operations, organic growers can maintain soil fertility, protect water quality, and preserve the long-term health of their farming ecosystems without compromising on pest management effectiveness. In 2022, as per Organics International, the global organic farming area expanded by more than 20 million hectares, reaching a total of 96 million hectares. The number of organic producers experienced a notable increase, exceeding 4.5 million worldwide. Additionally, the sales of organic food soared to nearly $141 billion (135 billion euros) during the same period.
Patent Analysis

Industry Trends
In January 2023, California received over $18 million from the U.S. Department of Agriculture (USDA) as part of a comprehensive initiative aimed at bolstering the nation's infrastructure for pest detection, surveillance, and control, while safeguarding the integrity of the U.S. nursery system. This funding is part of a larger effort by the USDA, allocating more than $70 million to support 350 projects across 48 states, Guam, and Puerto Rico. The USDA leverages the authority granted by the Plant Protection Act Section 7721 to administer these crucial funds.
In May 2023, Biobest, a global leader in biological control and pollination, announced the signing of a non-binding letter of intent to acquire BioWorks, Inc., a leading manufacturer and marketer of biopesticides based in Victor, NY. This proposed acquisition aims to enhance Biobest Group’s expansion into the biopesticides market, leveraging BioWorks’ innovative range of biopesticides for disease and insect control, along with its expertise in product development, marketing, and logistics.
In January 2023, Bayer partnered with M2i Group to provide farmers with pheromone-based biological crop protection products. These products target Lepidoptera pests in crops such as stone and pome fruits, tomatoes, and grapes.
In June 2022, BASF acquired Horta S.r.l., an Italian company known for its digital farming solutions. Horta S.r.l. has developed innovative agronomic Decision Support Systems (DSS) used for various crops, including grapes, tomatoes, cereals, and olives.
In March 2022, Provivi launched its newest pheromone-based crop protection product, Nelvium, in partnership with Syngenta Crop Protection, a leading global agricultural company, for distribution in Indonesia.
Regional Market Outlook
By region, the market is divided into North America, Europe, Asia-Pacific, and LAMEA. In North America, the usage of agricultural pheromones has witnessed significant growth in recent years, driven by the increasing demand for sustainable agricultural practices. Farmers across the region are adopting pheromone-based pest management strategies as an alternative to traditional chemical pesticides.
For instance, in the U.S., pheromone-based mating disruption techniques are commonly used in orchards and vineyards to control pests like codling moths and grapevine moths. Additionally, pheromone traps are employed for monitoring and mass trapping of pests such as the tomato pinworm and the pink bollworm. The use of pheromones aligns with the growing demand for sustainable pest management practices in the region.
In the Asia-Pacific region, agricultural pheromone usage is gaining traction as farmers seek to address the challenges of pest management while ensuring food security. Countries like China, India, and Japan, with large agricultural sectors, are witnessing increased adoption of pheromone-based pest control solutions. Factors such as population growth, urbanization, and changing dietary preferences are putting pressure on agricultural productivity, making sustainable pest management practices more crucial than ever.
China uses pheromone-based techniques extensively for pest management. Pheromone traps and dispensers are commonly used in crops such as rice, cotton, vegetables, and fruits to disrupt the mating behavior of pests like the cotton bollworm, rice stem borer, and oriental fruit moth. The adoption of pheromones aligns with China's efforts to promote sustainable agriculture and reduce reliance on chemical pesticides.
In India, the use of agricultural pheromones is steadily increasing, especially in states with significant agricultural production like Maharashtra, Karnataka, and Andhra Pradesh. Pheromone traps and dispensers are increasingly integrated into integrated pest management (IPM) programs to control pests in crops such as cotton, rice, maize, and fruits. For example, pheromone traps are deployed in cotton fields to monitor and control pink bollworm populations, reducing the need for chemical insecticides and mitigating resistance issues.
Competitive Analysis
Key market players in the agricultural pheromone market include FMC Corporation, Ephytia, BASF SE, MITSUI & CO., LTD, Biobest Group NV, Russell IPM, ISCA, Trécé Inc, BedoukianBio, and Pherobank.
Historic Trends of Agricultural Pheromone Market
In 1959, Karlson and Lüscher first coined the term "pheromone" to describe chemicals used for intraspecies communication among insects.
In the 1970s, pheromones began to be utilized for pest management, with the development of traps baited with synthetic pheromones to monitor and control insect populations.
In the 1990s, technological advancements streamlined the mass production and widespread application of pheromone-based products, fostering heightened adoption within integrated pest management (IPM) frameworks. This facilitated scalability and efficiency in delivering these solutions to agricultural stakeholders, enhancing the efficacy and accessibility of pest control measures.
In the 2010s, pheromone-based approaches emerged as highly promising sustainable alternatives to traditional pesticides within the agricultural sector. This shift was driven by a growing awareness of the environmental impact of conventional pesticides and a heightened emphasis on preserving beneficial insect populations.
Key Benefits For Stakeholders
This report provides a quantitative analysis of the market segments, current trends, estimations, and dynamics of the agricultural pheromone market analysis from 2024 to 2033 to identify the prevailing agricultural pheromone market opportunities.
The market research is offered along with information related to key drivers, restraints, and opportunities.
Porter's five forces analysis highlights the potency of buyers and suppliers to enable stakeholders make profit-oriented business decisions and strengthen their supplier-buyer network.
In-depth analysis of the agricultural pheromone market segmentation assists to determine the prevailing market opportunities.
Major countries in each region are mapped according to their revenue contribution to the global market.
Market player positioning facilitates benchmarking and provides a clear understanding of the present position of the market players.
The report includes the analysis of the regional as well as global agricultural pheromone market trends, key players, market segments, application areas, and market growth strategies.
Agricultural Pheromone Market Report Highlights
| Aspects | Details |
| Market Size By 2033 | USD 17.9 Billion |
| Growth Rate | CAGR of 16.7% |
| Forecast period | 2024 - 2033 |
| Report Pages | 300 |
| By Crop Type |
|
| By Function |
|
| By Mode Of Application |
|
| By Region |
|
| Key Market Players | BASF SE, FMC Corporation, MITSUI & CO., LTD, Biobest Group NV, ISCA, Ephytia, Pherobank, Russell IPM, Trécé Inc, BedoukianBio |
| | Others |
Loading Table Of Content...

