
Agritourism Market Summary
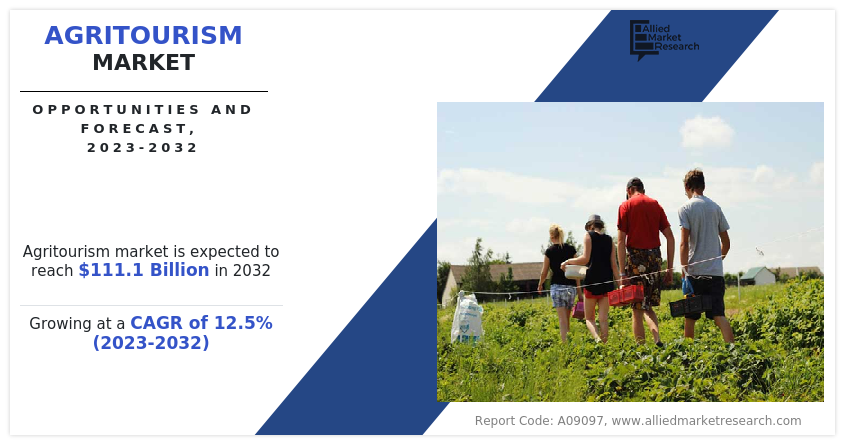
The global Agritourism Market size was estimated at USD 33.8 billion in 2022 and is projected to reach USD 111.1 billion by 2032, growing at a CAGR of 12.5 % from 2023 to 2032. The agritourism market is gaining traction as urban dwellers seek authentic rural experiences, sustainable travel options, and educational farm-based activities that connect them with nature and agriculture. This growth is fueled by rising interest in local food systems, weekend getaways, and eco-tourism, prompting farmers to diversify income through farm stays, tours, and events. Despite this momentum, the sector faces hurdles such as limited infrastructure, seasonal fluctuations, and regulatory barriers, which can deter new entrants and affect scalability in underdeveloped regions.
The Agritourism Market in North America held a significant share of over 36% in 2022.
The Agritourism industry in the Australia is expected to grow significantly at a CAGR of 16.2% from 2023 to 2032.
By activity, the educational tourism is one of the fastest growing segments in the market and accounted for the revenue share of over 6% in 2022.
By sales channel, the direct segment is one of the fastest growing segment in the market during the analysis period.
Market Size & Forecast
2022 Market Size: USD 33.8 Billion
2032 Projected Market Size: USD 111.1 Billion
CAGR (2023-2032): 12.5%
North America: Largest market in 2022
Europe: Second Largest market in 2022
People are increasingly finding innovative and new ways of entertainment and peace in their life and finding different ways to go and stay in village areas. Agritourism is one of such ways opening new doors for tourism where people can experience farm activities, rural lifestyle, green peace ambiance, which people cannot find easily in urban areas.
Agritourism is gaining major traction in the farmer community as it not only provides additional income to the farmers along with their farm production activities but also better sustainability. It has immense potential to provide good business to the farmers as it is cost-effective, has demand for family-oriented recreation environment, and there is a growing curiosity regarding farm activities in young minds. The outbreak of the COVID-19 pandemic has adversely affected the agritourism market. People are restricted to stay at their homes to stop the spread of the corona virus. In most of the countries boundaries are closed that directly affect the agritourism activities.
The tourism sector is majorly affected industry, owing to the growth of the corona virus cases in the world. Decrease in cases of corona virus and development in corona virus vaccination have been further supporting the tourism industry to regain its position.
Agritourism is subset of the rural tourism, which bridges up the gap between rural and urban people. It is untapped, niche, and emerging market. Most of the big giant companies operating in the tourism industry are investing in the farm-based tourism segment. This is majorly attributed to growing interest of the new generation people in farm activities and they want to have some knowledge along with entertainment. Educational tourism is one of such segments in agritourism, which provides knowledge regarding the various activities involved in the daily farm activities involved from cultivation to harvesting. In this form of agritourism, people actually experience the farm activities along with farmers. Educational Agritourism has been gaining major traction from various agricultural and non-agricultural educational institution and is likely to sustain its traction during the forecast period. This is majorly attributed to growing admissions for agriculture related professional courses.
According to the agritourism market analysis, the agritourism market forecast is segmented into activity, sales channel, and region. On the basis of activity, the market is categorized into on-farm sales, outdoor recreation, agritainment, educational tourism, accommodations, and others. By sales channel, it is segregated into travel agents and direct. Region-wise, it is analyzed across North America (the U.S., Canada, and Mexico), Europe (Germany, the UK, France, Russia, Italy, Spain, and rest of Europe), Asia-Pacific (China, Japan, Australia, India, South Korea, and rest of Asia-Pacific) and LAMEA (Latin America, the Middle East, and Africa).

By activity, the agritourism market is classified into on-farm sales, outdoor recreation, agritainment, educational tourism, accommodations, and others. The on-farm sales segment accounted for a major share of the agritourism market in 2022 and is expected to grow at a significant CAGR during the forecast period. This is majorly attributed to growing commercialization of the agritourism centers and rise in demand for local food and handmade products. For commercialization of the agritourism centers, farm owners are inviting traditional craftspeople, traditional dresses and costumes designers, and local specialty products.

By sales channel, the agritourism market is classified into travel agents and direct. The travel agents segment accounted for a major share of the agritourism market in 2022 and is expected to grow at a significant CAGR during the forecast period. As this market is very niche and an emerging concept, very few people are aware of the concept of agritourism. In such a scenario, travel agents play dual roles including advertisers and sellers of agritourism packages. Most tourists use travel agents or agencies to book their holiday vacation trips, owing to benefits associated such as time & money savings, perks, travel assistance, and travel recommendations.

By region, the agritourism market is classified into North America (the U.S., Canada, and Mexico), Europe (Germany, the UK, France, Russia, Italy, Spain, and rest of Europe), Asia-Pacific (China, Japan, Australia, India, South Korea, and rest of Asia-Pacific) and LAMEA (Latin America, the Middle East, and Africa). The North America region dominated the agritourism market in 2022, and is expected to sustain its dominance throughout the forecast period. The key factors driving the agritourism market growth in the region are farmers in this region are finding adjoined business and additional revenue along with their regular farm activities. Therefore, farmers in the U.S. are opening their farm and agro-based companies for visitors and showing them how they produce it and invite them to take actual experience on the farm. Furthermore, growing demand for nature tourism and health wellness tourism boosts the agritourism market demand as agritourism is a collective experience of nature, greenery, fresh air, calm & peace, and rural lifestyle.
The players operating in the global agritourism market statistics have adopted various developmental strategies to expand their agritourism market share, increase profitability, and remain competitive in the agritourism market. The key players profiled in this report include Agricultural Tour Operators International, Agrilys Voyages, Bay Farm Tours, Blackberry Farm, LLC, Farm to Farm Tours, Greenmount Travel, Harvest Travel International, Field Farm Tours Limited, Select Holidays, and Stita Group.
Key Benefits For Stakeholders
- This report provides a quantitative analysis of the market segments, current trends, estimations, and dynamics of the agritourism market analysis from 2022 to 2032 to identify the prevailing agritourism market opportunities.
- The market research is offered along with information related to key drivers, restraints, and opportunities.
- Porter's five forces analysis highlights the potency of buyers and suppliers to enable stakeholders make profit-oriented business decisions and strengthen their supplier-buyer network.
- In-depth analysis of the agritourism market segmentation assists to determine the prevailing market opportunities.
- Major countries in each region are mapped according to their revenue contribution to the global market.
- Market player positioning facilitates benchmarking and provides a clear understanding of the present position of the market players.
- The report includes the analysis of the regional as well as global agritourism market trends, key players, market segments, application areas, and market growth strategies.
Agritourism Market Report Highlights
| Aspects | Details |
| Market Size By 2032 | USD 111.1 billion |
| Growth Rate | CAGR of 12.5% |
| Forecast period | 2022 - 2032 |
| Report Pages | 444 |
| By Sales Channel |
|
| By ACTIVITY |
|
| By Region |
|
| Key Market Players | Agricultural Tour Operators International, Star Destinations, Field Farm Tours Ltd., Farm To Farm Tours, Stita Group, Bay Farm Tours, Innisfail Travel Service Ltd., Blackberry Farm, LLC., Agrilys Voyages, Greenmount Travel |
Analyst Review
According to the insights of the CXOs the global agritourism market is expected to witness robust growth during the forecast period. This is attributed to the farmers urged to adopt agri-allied business Farmers have been strongly urged to adopt agri-allied businesses to supplement their income. Agri-allied businesses are business activities that can be carried out along with farming, without investing a larger amount of money. It includes agritourism, animal husbandry, dairying, and fishing. Farmers are recommended by Agriculture organizations, farmer’s welfare organizations, and the government to have agri-allied businesses along with farming, owing to the benefits associated as these businesses increase farm revenue instead of depending on one source, for example, a farmer keeping fish and growing maize is better than a farmer who grows maize only.
CXOs further added about the rise in health consciousness to support the adoption of agritourism. The pollution free environment, fresh foods, recreation activities, and other health benefits related with agritourism are encouraging people to actively opt for inbound and outbound agritourism. The on-farm farmer’s markets, U-Pick operations, pumpkin picking patches, and various other operations associated with agritourism allow tourists to choose fresh fruits directly from farms, which attracts a large number of people toward agritourism.
The global agritourism market was valued at $33.8 billion in 2022, and is projected to reach $111.1 billion by 2032, growing at a CAGR of 12.5% from 2023 to 2032.
The global Agritourism market registered a CAGR of 12.5% from 2023 to 2032.
Raise the query and paste the link of the specific report and our sales executive will revert with the sample.
The forecast period in the Agritourism market report is from 2023 to 2032.
The players operating in the agritourism industry have adopted product launch and business expansion as their key developmental strategies to expand their market share, increase profitability, and remain competitive in the market. The key players profiled in this report include Agricultural Tour Operators International, Agrilys Voyages, Bay Farm Tours, Blackberry Farm, LLC, Farm to Farm Tours, Greenmount Travel, Harvest Travel International, Field Farm Tours Limited, Select Holidays, and Stita Group.
Loading Table Of Content...
Loading Research Methodology...

