Report Code: A13700 | Sep 2021 | Pages: 213 | ||
Tables: 109 | Charts: 46 |
|
Pandemic disrupted the entire world and affected many industries.
Get detailed COVID-19 impact analysis on the Air Ambulance Services Market
Request Now !
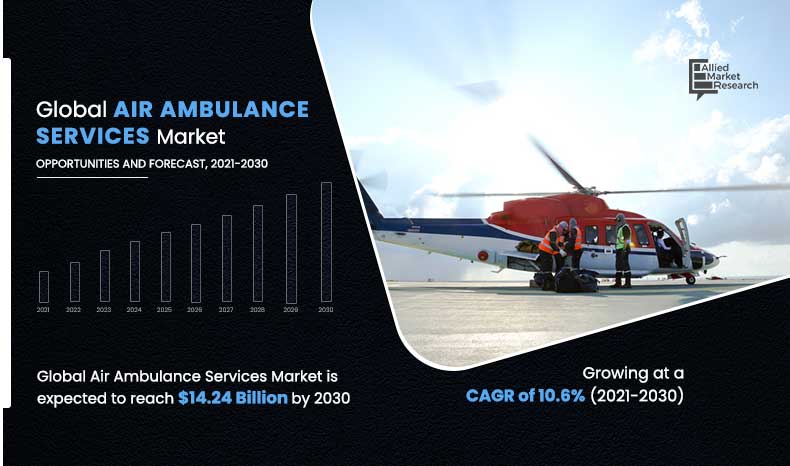
The global air ambulance services market was valued at $5.24 billion in 2020, and is projected to reach $14.24 billion by 2030, registering a CAGR of 10.6% from 2021 to 2030.
The COVID-19 crisis is creating uncertainty in the market, massive slowing of supply chain, falling business confidence, and increasing panic among customer segments. Governments of different regions have already announced lockdown and temporary shutdown of industries, thereby adversely affecting the overall production and sales. Domestic air passenger numbers have been returning to the pre-pandemic levels, particularly in developing countries such as China and Russia.
Air ambulances are special type of aircraft, which are designed to perform air medical services at emergency situations where land-based medical help takes time to reach. Air ambulance includes aircraft and helicopters, which are equipped with all the medical facilities and are intended to provide medical assistance at locations such as hill top or at locations where road-based ambulance services do not reach easily. The increased number of accidents and other life taking threats, such as major strokes, heart attack, trauma, and other such medical ailments, creates an increased demand for efficient ambulance services to be present, which eventually leads to the growth of air ambulance services across the globe.
Factors, such as increasing rates of trauma, stroke, & heart attacks to propel demand for air medical services and rapid technological advancements in air ambulance services, create opportunities for the growth of the market across the globe. However, stringent regulations for aviation license and high cost of air medical services & reimbursement challenges create a barrier for the growth of the air ambulance services market across the globe. Moreover, growth in urban air mobility (UAM) platform and acquiring the untapped potential of Asia-Pacific create numerous opportunities for the growth of the air ambulance services market across the globe.
The global air ambulance services market has been segmented on the basis of service operator, service type, aircraft type, and region. By service operator, the global market is divided into hospital based, independent, and government. By service type, it is bifurcated into domestic and international. By aircraft type, it is classified into fixed-wing and rotary-wing. Region-wise, the market is studied across North America, Europe, Asia-Pacific, and LAMEA.
The key players profiled in the global air ambulance services market are Acadian Companies, Aeromedevac, Air Methods, Alpha Star, Babcock Scandinavian AirAmbulance, Gulf Helicopters, European Air Ambulance, Express Aviation Services, PHI Inc., and REVA Inc.
Air ambulance services are increasingly being used to transport patients suffering from a stroke, heart attack, or a traumatic incident that requires time-sensitive therapies in a critical care center. According to the World Health Organization (WHO), around 0.8 million Americans and a million people in Europe suffer from a stroke annually. Over 4 million people are seriously injured in road accidents in the U.S. every year. In addition, cardiovascular diseases account for over 18 million deaths globally every year due to unavailability of timely ambulance services at different locations. Time-dependent medical or surgical intervention is required in many cases of trauma, stroke, and heart attacks. For example, the quick restoration of blood flow to the brain with the help of an emergency “IV Injection” of recombinant tissue plasminogen activator or an endovascular procedure is critical for treating ischemic stroke, which can be provided efficiently through air ambulance services at different locations. Thus, increased rates of trauma, stroke, and heart attacks create wider space for the growth of air ambulance services across the globe.
Advancements in air ambulances are happening around the level of care provided to patients being transported with the help of modern and innovative medical devices. Besides, technologically advanced communication systems allow the transfer of real-time data of a patient's health to the experts at the hospital, allowing the doctors to prepare for emergency in advance. Air ambulances are now equipped with critical care equipment, such as a ventilator, heart monitor, and defibrillator, to provide emergency medical care to patients. Below are some of the important technological advancements made in emergency medical services aircraft amid the COVID-19 pandemic. In May 2020, EHang, a leading manufacturer of Autonomous Aerial Vehicles (AAV), successfully transferred medical professionals, staff, and medical supplies in its two-seated passenger drone.
Additionally, EHang and the International Civil Aviation Organization (ICAO) jointly developed an ambulance drone, Ambular, to efficiently tackle healthcare emergencies. In September 2020, India’s first-ever integrated air ambulance was jointly launched by Kyathi and the International Critical Air Transfer Team (ICATT). The fixed-wing aircraft ambulance is equipped with an isolation pod to enable safe transport of critical patients affected by COVID-19. Improvement in medical infrastructure backed by AAV development is expected to contribute to the global air ambulance services market growth during the forecast period.
Air ambulance service charges are significantly higher than ground ambulance services. Although some level of coverage is available for air ambulance services in the U.S. under government and private health insurance, the reimbursement rates are quite low compared to the billing of air medical service providers. Medicare and Medicaid cover about 60% and 34% of the average air medical transport cost leaving the patients to bear a huge out-of-pocket expense in many cases. This high cost of air medical services & reimbursement challenges creates a barrier for the growth of the market across the globe.
Technological advancements and industry investments in electrification, automation, vertical take-off and landing (VTOL) aircraft, unmanned aerial systems (UAS), and air traffic management are enabling innovations in aviation such as new aircraft designs, services, and business models. Urban air mobility (UAM) is a broad concept that enables consumers’ access to on-demand air mobility throughout urban areas. The rapid pace of technology improvement has turned the concept of Urban Air Mobility (UAM) into an attractive business proposition. With increasing road congestion, especially in megacities, people are constantly searching for better and safer air medical services to be present in an efficient way to different locations, which creates opportunities for the growth of the market. In recent years, on-demand aviation services similar to transportation network companies, such as Uber or Lyft, are entering the marketplace. Globally, 12 app & web-based, on-demand UAM passenger services using helicopters and fixed-wing aircraft were operational as of March 2020. Numerous companies have announced plans to launch passenger UAM services using VTOL and other novel aircraft designs. Such developments carried out by different companies create a positive impact on the growth of the air ambulance services market across the globe.
Covid-19 Impact Analysis
Key Benefits For Stakeholders
Key Market Segments
By Service Operator
By Service Type
By Aircraft Type
By Region
KEY PLAYERS
Air Ambulance Services Market Report Highlights
Aspects | Details |
---|---|
By SERVICE OPERATOR |
|
By SERVICE TYPE |
|
By AIRCRAFT TYPE |
|
By Region |
|
Key Market Players | Aeromedevac, Alpha Star Aviation Services, Babcock International Group PLC, Gulf Helicopters, European Air Ambulance (EAA), REVA, Inc., Express Aviation Services, Air Methods, ACADIAN COMPANIES |
CHAPTER 1:INTRODUCTION
1.1.Report description
1.2.Key benefits for stakeholders
1.3.Key market segments
1.4.Research methodology
1.4.1.Primary research
1.4.2.Secondary research
1.4.3.Analyst tools and models
CHAPTER 2:EXECUTIVE SUMMARY
2.1.CXO perspective
CHAPTER 3:MARKET OVERVIEW
3.1.Market definition and scope
3.2.Key findings
3.2.1.Top impacting factors
3.2.2.Top investment pockets
3.3.Porter’s five forces analysis
3.3.1.Low-to-high bargaining power of suppliers
3.3.2.Low-to-high threat of new entrants
3.3.3.Low-to-high threat of substitutes
3.3.4.Moderate-to-high intensity of rivalry
3.3.5.Moderate-to-high bargaining power of buyers
3.4.Key player positioning, 2020
3.5.Market dynamics
3.5.1.Drivers
3.5.1.1.Increasing rates of trauma, stroke, and heart attacks to propel demand for air medical services
3.5.1.2.Rapid technological advancements in air ambulance services
3.5.2.Restraints
3.5.2.1.Stringent regulations for aviation license
3.5.2.2.High cost of air medical services & reimbursement challenges
3.5.3.Opportunities
3.5.3.1.Growth in urban air mobility (UAM) platform
3.5.3.2.Acquiring the untapped potential of Asia-Pacific region
3.6.Impact of COVID-19 on the market
3.6.1.Evolution of outbreaks
3.6.1.1.SARS
3.6.1.2.COVID-19
3.6.2.Micro-economic impact analysis
3.6.2.1.Consumer trend
3.6.2.2.Technology trends
3.6.2.3.Regulatory trend
3.6.3.Macro-economic impact analysis
3.6.3.1.GDP
3.6.3.2.Import/export analysis
3.6.3.3.Employment index
3.6.4.Impact on the aircraft industry analysis
3.7.Competitive landscape
3.7.1.Competitive dashboard
3.7.2.Competitive heat map
CHAPTER 4:AIR AMBULANCE SERVICES MARKET, BY SERVICE OPERATOR
4.1.Overview
4.2.Hospital based
4.2.1.Key market trends, growth factors and opportunities
4.2.2.Market size and forecast, by region
4.2.3.Hospital Based Air Ambulance Services Market, by Service Type
4.2.4.Market analysis by country
4.3.Independent
4.3.1.Key market trends, growth factors and opportunities
4.3.2.Market size and forecast, by region
4.3.3.Independent Air Ambulance Services Market, by Service Type
4.3.4.Market analysis by country
4.4.Government
4.4.1.Key market trends, growth factors and opportunities
4.4.2.Market size and forecast, by region
4.4.3.Government Air Ambulance Services Market, by Service Type
4.4.4.Market analysis by country
CHAPTER 5:AIR AMBULANCE SERVICES MARKET, BY SERVICE TYPE
5.1.Overview
5.2.Domestic
5.2.1.Key market trends, growth factors and opportunities
5.2.2.Market size and forecast, by region
5.2.3.Market analysis by country
5.3.International
5.3.1.Key market trends, growth factors and opportunities
5.3.2.Market size and forecast, by region
5.3.3.Market analysis by country
CHAPTER 6:AIR AMBULANCE SERVICES MARKET, BY AIRCRAFT TYPE
6.1.Overview
6.2.Fixed-Wing
6.2.1.Key market trends, growth factors and opportunities
6.2.2.Market size and forecast, by region
6.2.3.Market analysis by country
6.3.Rotary-Wing
6.3.1.Key market trends, growth factors and opportunities
6.3.2.Market size and forecast, by region
6.3.3.Market analysis by country
CHAPTER 7:AIR AMBULANCE SERVICES MARKET, BY REGION
7.1.Overview
7.2.North America
7.2.1.Key market trends, growth factors, and opportunities
7.2.2.Market size and forecast, by service operator
7.2.3.North America Hospital based air ambulance services, by service type
7.2.4.North America Independent Air Ambulance Services, by Service Type
7.2.5.North America Government Air Ambulance Services, by Service Type
7.2.6.Market size and forecast, by service type
7.2.7.Market size and forecast, by aircraft type
7.2.8.Market analysis by country
7.2.8.1.U.S.
7.2.8.1.1.Market size and forecast, by service operator
7.2.8.1.2.Market size and forecast, by service type
7.2.8.1.3.Market size and forecast, by aircraft type
7.2.8.2.Canada
7.2.8.2.1.Market size and forecast, by service operator
7.2.8.2.2.Market size and forecast, by service type
7.2.8.2.3.Market size and forecast, by aircraft type
7.2.8.3.Mexico
7.2.8.3.1.Market size and forecast, by service operator
7.2.8.3.2.Market size and forecast, by service type
7.2.8.3.3.Market size and forecast, by aircraft type
7.3.Europe
7.3.1.Key market trends, growth factors, and opportunities
7.3.2.Market size and forecast, by service operator
7.3.3.Europe Hospital based air ambulance services, by service type
7.3.4.Europe Independent Air Ambulance Services, by Service Type
7.3.5.Europe Government Air Ambulance Services, by Service Type
7.3.6.Market size and forecast, by service type
7.3.7.Market size and forecast, by aircraft type
7.3.8.Market analysis by country
7.3.8.1.UK
7.3.8.1.1.Market size and forecast, by service operator
7.3.8.1.2.Market size and forecast, by service type
7.3.8.1.3.Market size and forecast, by aircraft type
7.3.8.2.Germany
7.3.8.2.1.Market size and forecast, by service operator
7.3.8.2.2.Market size and forecast, by service type
7.3.8.2.3.Market size and forecast, by aircraft type
7.3.8.3.France
7.3.8.3.1.Market size and forecast, by service operator
7.3.8.3.2.Market size and forecast, by service type
7.3.8.3.3.Market size and forecast, by aircraft type
7.3.8.4.Russia
7.3.8.4.1.Market size and forecast, by service operator
7.3.8.4.2.Market size and forecast, by service type
7.3.8.4.3.Market size and forecast, by aircraft type
7.3.8.5.Italy
7.3.8.5.1.Market size and forecast, by service operator
7.3.8.5.2.Market size and forecast, by service type
7.3.8.5.3.Market size and forecast, by aircraft type
7.3.8.6.Rest of Europe
7.3.8.6.1.Market size and forecast, by service operator
7.3.8.6.2.Market size and forecast, by service type
7.3.8.6.3.Market size and forecast, by aircraft type
7.4.Asia-Pacific
7.4.1.Key market trends, growth factors, and opportunities
7.4.2.Market size and forecast, by service operator
7.4.3.Asia-Pacific Hospital based air ambulance services, by service type
7.4.4.Asia-Pacific Independent Air Ambulance Services, by Service Type
7.4.5.Asia-Pacific Government Air Ambulance Services, by Service Type
7.4.6.Market size and forecast, by service type
7.4.7.Market size and forecast, by aircraft type
7.4.8.Market analysis by country
7.4.8.1.China
7.4.8.1.1.Market size and forecast, by service operator
7.4.8.1.2.Market size and forecast, by service type
7.4.8.1.3.Market size and forecast, by aircraft type
7.4.8.2.Japan
7.4.8.2.1.Market size and forecast, by service operator
7.4.8.2.2.Market size and forecast, by service type
7.4.8.2.3.Market size and forecast, by aircraft type
7.4.8.3.India
7.4.8.3.1.Market size and forecast, by service operator
7.4.8.3.2.Market size and forecast, by service type
7.4.8.3.3.Market size and forecast, by aircraft type
7.4.8.4.Australia
7.4.8.4.1.Market size and forecast, by service operator
7.4.8.4.2.Market size and forecast, by service type
7.4.8.4.3.Market size and forecast, by aircraft type
7.4.8.5.Rest of Asia-Pacific
7.4.8.5.1.Market size and forecast, by service operator
7.4.8.5.2.Market size and forecast, by service type
7.4.8.5.3.Market size and forecast, by aircraft type
7.5.LAMEA
7.5.1.Key market trends, growth factors, and opportunities
7.5.2.Market size and forecast, by service operator
7.5.3.LAMEA Hospital based air ambulance services, by service type
7.5.4.LAMEA Independent Air Ambulance Services, by Service Type
7.5.5.LAMEA Government Air Ambulance Services, by Service Type
7.5.6.Market size and forecast, by service type
7.5.7.Market size and forecast, by aircraft type
7.5.8.Market analysis by country
7.5.8.1.Latin America
7.5.8.1.1.Market size and forecast, by service operator
7.5.8.1.2.Market size and forecast, by service type
7.5.8.1.3.Market size and forecast, by aircraft type
7.5.8.2.Middle East
7.5.8.2.1.Market size and forecast, by service operator
7.5.8.2.2.Market size and forecast, by service type
7.5.8.2.3.Market size and forecast, by aircraft type
7.5.8.3.Africa
7.5.8.3.1.Market size and forecast, by service operator
7.5.8.3.2.Market size and forecast, by service type
7.5.8.3.3.Market size and forecast, by aircraft type
CHAPTER 8:COMPANY PROFILES
8.1.ACADIAN COMPANIES
8.1.1.Company overview
8.1.2.Company snapshot
8.1.3.Product portfolio
8.2.Aeromedevac
8.2.1.Company overview
8.2.2.Company snapshot
8.2.3.Product portfolio
8.3.Air Methods
8.3.1.Company overview
8.3.2.Company snapshot
8.3.3.Product portfolio
8.4.Alpha Star Aviation Services
8.4.1.Company overview
8.4.2.Company snapshot
8.4.3.Product portfolio
8.5.Babcock International Group PLC
8.5.1.Company overview
8.5.2.Company snapshot
8.5.3.Product portfolio
8.5.4.Operating business segments
8.5.5.Business performance
8.6.Gulf Helicopters
8.6.1.Company overview
8.6.2.Company snapshot
8.6.3.Product portfolio
8.7.European Air Ambulance (EAA)
8.7.1.Company overview
8.7.2.Company snapshot
8.7.3.Product portfolio
8.8.Express Aviation Services
8.8.1.Company overview
8.8.2.Company snapshot
8.8.3.Product portfolio
8.9.PHI Air Medical
8.9.1.Company overview
8.9.2.Company snapshot
8.9.3.Product portfolio
8.10.REVA, Inc.
8.10.1.Company overview
8.10.2.Company snapshot
8.10.3.Product portfolio
LIST OF TABLES
TABLE 01.GLOBAL AIR AMBULANCE SERVICES MARKET, BY SERVICE OPERATOR, 2020-2030 ($MILLION)
TABLE 02.AIR AMBULANCE SERVICES MARKET REVENUE FOR HOSPITAL BASED, BY REGION 2020–2030 ($MILLION)
TABLE 03.HOSPITAL BASED AIR AMBULANCE SERVICES MARKET REVENUE, BY SERVICE TYPE, 2020–2030 ($MILLION)
TABLE 04.AIR AMBULANCE SERVICES MARKET REVENUE FOR INDEPENDENT, BY REGION 2020–2030 ($MILLION)
TABLE 05.IDEPENDENT AIR AMBULANCE SERVICES MARKET REVENUE, BY SERVICE TYPE, 2020–2030 ($MILLION)
TABLE 06.AIR AMBULANCE SERVICES MARKET REVENUE FOR GOVERNMENT, BY REGION 2020–2030 ($MILLION)
TABLE 07.GOVERNMENT AIR AMBULANCE SERVICES MARKET REVENUE, BY SERVICE TYPE, 2020–2030 ($MILLION)
TABLE 08.GLOBAL AIR AMBULANCE SERVICES MARKET, BY SERVICE TYPE, 2020-2030 ($MILLION)
TABLE 09.AIR AMBULANCE SERVICES MARKET REVENUE FOR DOMESTIC, BY REGION 2020–2030 ($MILLION)
TABLE 10.AIR AMBULANCE SERVICES MARKET REVENUE FOR INTERNATIONAL, BY REGION 2020–2030 ($MILLION)
TABLE 11.GLOBAL AIR AMBULANCE SERVICES MARKET, BY AIRCRAFT TYPE, 2020-2030 ($MILLION)
TABLE 12.AIR AMBULANCE SERVICES MARKET REVENUE FOR FIXED-WING, BY REGION 2020–2030 ($MILLION)
TABLE 13.AIR AMBULANCE SERVICES MARKET REVENUE FOR ROTARY-WING, BY REGION 2020–2030 ($MILLION)
TABLE 14.NORTH AMERICA AIR AMBULANCE SERVICES MARKET, BY SERVICE OPERATOR, 2020–2030 ($MILLION)
TABLE 15.NORTH AMERICA HOSPITAL BASED AIR AMBULANCE SERVICES MARKET, BY SERVICE TTYPE, 2020–2030 ($MILLION)
TABLE 16.NORTH AMERICA INDEPENDENT AIR AMBULANCE SERVICES MARKET, BY SERVICE TTYPE, 2020–2030 ($MILLION)
TABLE 17.NORTH AMERICA GOVERNMENT AIR AMBULANCE SERVICES MARKET, BY SERVICE TTYPE, 2020–2030 ($MILLION)
TABLE 18.NORTH AMERICA AIR AMBULANCE SERVICES MARKET, BY SERVICE TYPE, 2020–2030 ($MILLION)
TABLE 19.NORTH AMERICA AIR AMBULANCE SERVICES MARKET, BY AIRCRAFT TYPE, 2020–2030 ($MILLION)
TABLE 20.U.S. AIR AMBULANCE SERVICES MARKET, BY SERVICE OPERATOR, 2020–2030 ($MILLION)
TABLE 21.U.S. AIR AMBULANCE SERVICES MARKET, BY SERVICE TYPE, 2020–2030 ($MILLION)
TABLE 22.U.S. AIR AMBULANCE SERVICES MARKET, BY AIRCRAFT TYPE, 2020–2030 ($MILLION)
TABLE 23.CANADA AIR AMBULANCE SERVICES MARKET, BY SERVICE OPERATOR, 2020–2030 ($MILLION)
TABLE 24.CANADA AIR AMBULANCE SERVICES MARKET, BY SERVICE TYPE, 2020–2030 ($MILLION)
TABLE 25.CANADA AIR AMBULANCE SERVICES MARKET, BY AIRCRAFT TYPE, 2020–2030 ($MILLION)
TABLE 26.MEXICO AIR AMBULANCE SERVICES MARKET, BY SERVICE OPERATOR, 2020–2030 ($MILLION)
TABLE 27.MEXICO AIR AMBULANCE SERVICES MARKET, BY SERVICE TYPE, 2020–2030 ($MILLION)
TABLE 28.MEXICO AIR AMBULANCE SERVICES MARKET, BY AIRCRAFT TYPE, 2020–2030 ($MILLION)
TABLE 29.EUROPE AIR AMBULANCE SERVICES MARKET, BY SERVICE OPERATOR, 2020–2030 ($MILLION)
TABLE 30.EUROPE HOSPITAL BASED AIR AMBULANCE SERVICES MARKET, BY SERVICE TTYPE, 2020–2030 ($MILLION)
TABLE 31.EUROPE INDEPENDENT AIR AMBULANCE SERVICES MARKET, BY SERVICE TTYPE, 2020–2030 ($MILLION)
TABLE 32.EUROPE GOVERNMENT AIR AMBULANCE SERVICES MARKET, BY SERVICE TTYPE, 2020–2030 ($MILLION)
TABLE 33.EUROPE AIR AMBULANCE SERVICES MARKET, BY SERVICE TYPE, 2020–2030 ($MILLION)
TABLE 34.EUROPE AIR AMBULANCE SERVICES MARKET, BY AIRCRAFT TYPE, 2020–2030 ($MILLION)
TABLE 35.UK AIR AMBULANCE SERVICES MARKET, BY SERVICE OPERATOR, 2020–2030 ($MILLION)
TABLE 36.UK AIR AMBULANCE SERVICES MARKET, BY SERVICE TYPE, 2020–2030 ($MILLION)
TABLE 37.UK AIR AMBULANCE SERVICES MARKET, BY AIRCRAFT TYPE, 2020–2030 ($MILLION)
TABLE 38.GERMANY AIR AMBULANCE SERVICES MARKET, BY SERVICE OPERATOR, 2020–2030 ($MILLION)
TABLE 39.GERMANY AIR AMBULANCE SERVICES MARKET, BY SERVICE TYPE, 2020–2030 ($MILLION)
TABLE 40.GERMANY AIR AMBULANCE SERVICES MARKET, BY AIRCRAFT TYPE, 2020–2030 ($MILLION)
TABLE 41.FRANCE AIR AMBULANCE SERVICES MARKET, BY SERVICE OPERATOR, 2020–2030 ($MILLION)
TABLE 42.FRANCE AIR AMBULANCE SERVICES MARKET, BY SERVICE TYPE, 2020–2030 ($MILLION)
TABLE 43.FRANCE AIR AMBULANCE SERVICES MARKET, BY AIRCRAFT TYPE, 2020–2030 ($MILLION)
TABLE 44.RUSSIA AIR AMBULANCE SERVICES MARKET, BY SERVICE OPERATOR, 2020–2030 ($MILLION)
TABLE 45.RUSSIA AIR AMBULANCE SERVICES MARKET, BY SERVICE TYPE, 2020–2030 ($MILLION)
TABLE 46.RUSSIA AIR AMBULANCE SERVICES MARKET, BY AIRCRAFT TYPE, 2020–2030 ($MILLION)
TABLE 47.ITALY AIR AMBULANCE SERVICES MARKET, BY SERVICE OPERATOR, 2020–2030 ($MILLION)
TABLE 48.ITALY AIR AMBULANCE SERVICES MARKET, BY SERVICE TYPE, 2020–2030 ($MILLION)
TABLE 49.ITALY AIR AMBULANCE SERVICES MARKET, BY AIRCRAFT TYPE, 2020–2030 ($MILLION)
TABLE 50.REST OF EUROPE AIR AMBULANCE SERVICES MARKET, BY SERVICE OPERATOR, 2020–2030 ($MILLION)
TABLE 51.REST OF EUROPE AIR AMBULANCE SERVICES MARKET, BY SERVICE TYPE, 2020–2030 ($MILLION)
TABLE 52.REST OF EUROPE AIR AMBULANCE SERVICES MARKET, BY AIRCRAFT TYPE, 2020–2030 ($MILLION)
TABLE 53.ASIA-PACIFIC AIR AMBULANCE SERVICES MARKET, BY SERVICE OPERATOR, 2020–2030 ($MILLION)
TABLE 54.ASIA-PACIFIC HOSPITAL BASED AIR AMBULANCE SERVICES MARKET, BY SERVICE TTYPE, 2020–2030 ($MILLION)
TABLE 55.ASIA-PACIFIC INDEPENDENT AIR AMBULANCE SERVICES MARKET, BY SERVICE TTYPE, 2020–2030 ($MILLION)
TABLE 56.ASIA-PACIFIC GOVERNMENT AIR AMBULANCE SERVICES MARKET, BY SERVICE TTYPE, 2020–2030 ($MILLION)
TABLE 57.ASIA-PACIFIC AIR AMBULANCE SERVICES MARKET, BY SERVICE TYPE, 2020–2030 ($MILLION)
TABLE 58.ASIA-PACIFIC AIR AMBULANCE SERVICES MARKET, BY AIRCRAFT TYPE, 2020–2030 ($MILLION)
TABLE 59.CHINA AIR AMBULANCE SERVICES MARKET, BY SERVICE OPERATOR, 2020–2030 ($MILLION)
TABLE 60.CHINA AIR AMBULANCE SERVICES MARKET, BY SERVICE TYPE, 2020–2030 ($MILLION)
TABLE 61.CHINA AIR AMBULANCE SERVICES MARKET, BY AIRCRAFT TYPE, 2020–2030 ($MILLION)
TABLE 62.JAPAN AIR AMBULANCE SERVICES MARKET, BY SERVICE OPERATOR, 2020–2030 ($MILLION)
TABLE 63.JAPAN AIR AMBULANCE SERVICES MARKET, BY SERVICE TYPE, 2020–2030 ($MILLION)
TABLE 64.JAPAN AIR AMBULANCE SERVICES MARKET, BY AIRCRAFT TYPE, 2020–2030 ($MILLION)
TABLE 65.INDIA AIR AMBULANCE SERVICES MARKET, BY SERVICE OPERATOR, 2020–2030 ($MILLION)
TABLE 66.INDIA AIR AMBULANCE SERVICES MARKET, BY SERVICE TYPE, 2020–2030 ($MILLION)
TABLE 67.INDIA AIR AMBULANCE SERVICES MARKET, BY AIRCRAFT TYPE, 2020–2030 ($MILLION)
TABLE 68.AUSTRALIA AIR AMBULANCE SERVICES MARKET, BY SERVICE OPERATOR, 2020–2030 ($MILLION)
TABLE 69.AUSTRALIA AIR AMBULANCE SERVICES MARKET, BY SERVICE TYPE, 2020–2030 ($MILLION)
TABLE 70.AUSTRALIA AIR AMBULANCE SERVICES MARKET, BY AIRCRAFT TYPE, 2020–2030 ($MILLION)
TABLE 71.REST OF ASIA-PACIFIC AIR AMBULANCE SERVICES MARKET, BY SERVICE OPERATOR, 2020–2030 ($MILLION)
TABLE 72.REST OF ASIA-PACIFIC AIR AMBULANCE SERVICES MARKET, BY SERVICE TYPE, 2020–2030 ($MILLION)
TABLE 73.REST OF ASIA-PACIFIC AIR AMBULANCE SERVICES MARKET, BY AIRCRAFT TYPE, 2020–2030 ($MILLION)
TABLE 74.LAMEA AIR AMBULANCE SERVICES MARKET, BY SERVICE OPERATOR, 2020–2030 ($MILLION)
TABLE 75.LAMEA HOSPITAL BASED AIR AMBULANCE SERVICES MARKET, BY SERVICE TTYPE, 2020–2030 ($MILLION)
TABLE 76.LAMEA INDEPENDENT AIR AMBULANCE SERVICES MARKET, BY SERVICE TTYPE, 2020–2030 ($MILLION)
TABLE 77.LAMEA GOVERNMENT AIR AMBULANCE SERVICES MARKET, BY SERVICE TTYPE, 2020–2030 ($MILLION)
TABLE 78.LAMEA AIR AMBULANCE SERVICES MARKET, BY SERVICE TYPE, 2020–2030 ($MILLION)
TABLE 79.LAMEA AIR AMBULANCE SERVICES MARKET, BY AIRCRAFT TYPE, 2020–2030 ($MILLION)
TABLE 80.LATIN AMERICA AIR AMBULANCE SERVICES MARKET, BY SERVICE OPERATOR, 2020–2030 ($MILLION)
TABLE 81.LATIN AMERICA AIR AMBULANCE SERVICES MARKET, BY SERVICE TYPE, 2020–2030 ($MILLION)
TABLE 82.LATIN AMERICA AIR AMBULANCE SERVICES MARKET, BY AIRCRAFT TYPE, 2020–2030 ($MILLION)
TABLE 83.MIDDLE EAST AIR AMBULANCE SERVICES MARKET, BY SERVICE OPERATOR, 2020–2030 ($MILLION)
TABLE 84.MIDDLE EAST AIR AMBULANCE SERVICES MARKET, BY SERVICE TYPE, 2020–2030 ($MILLION)
TABLE 85.MIDDLE EAST AIR AMBULANCE SERVICES MARKET, BY AIRCRAFT TYPE, 2020–2030 ($MILLION)
TABLE 86.AFRICA AIR AMBULANCE SERVICES MARKET, BY SERVICE OPERATOR, 2020–2030 ($MILLION)
TABLE 87.AFRICA AIR AMBULANCE SERVICES MARKET, BY SERVICE TYPE, 2020–2030 ($MILLION)
TABLE 88.AFRICA AIR AMBULANCE SERVICES MARKET, BY AIRCRAFT TYPE, 2020–2030 ($MILLION)
TABLE 89.ACADIAN COMPANIES: COMPANY SNAPSHOT
TABLE 90.ACADIAN COMPANIES: PRODUCT PORTFOLIO
TABLE 91.AEROMEDEVAC: COMPANY SNAPSHOT
TABLE 92.AEROMEDEVAC: PRODUCT PORTFOLIO
TABLE 93.AIR METHODS: COMPANY SNAPSHOT
TABLE 94.AIR METHODS: PRODUCT PORTFOLIO
TABLE 95.ALPHA STAR AVIATION SERVICES: COMPANY SNAPSHOT
TABLE 96.ALPHA STAR AVIATION SERVICES: PRODUCT PORTFOLIO
TABLE 97.BABCOCK INTERNATIONAL GROUP PLC: COMPANY SNAPSHOT
TABLE 98.BABCOCK INTERNATIONAL GROUP PLC: PRODUCT PORTFOLIO
TABLE 99.BABCOCK INTERNATIONAL GROUP PLC: OPERATING SEGMENTS
TABLE 100.GULF HELICOPTERS: COMPANY SNAPSHOT
TABLE 101.GULF HELICOPTERS: PRODUCT PORTFOLIO
TABLE 102.EUROPEAN AIR AMBULANCE (EAA): COMPANY SNAPSHOT
TABLE 103.EUROPEAN AIR AMBULANCE (EAA): PRODUCT PORTFOLIO
TABLE 104.EXPRESS AVIATION SERVICES: COMPANY SNAPSHOT
TABLE 105.EXPRESS AVIATION SERVICES: PRODUCT PORTFOLIO
TABLE 106.PHI AIR MEDICAL: COMPANY SNAPSHOT
TABLE 107.PHI AIR MEDICAL: PRODUCT PORTFOLIO
TABLE 108.REVA, INC.: COMPANY SNAPSHOT
TABLE 109.REVA, INC.: PRODUCT PORTFOLIO
LIST OF FIGURES
FIGURE 01.KEY MARKET SEGMENTS
FIGURE 02.EXECUTIVE SUMMARY
FIGURE 03.EXECUTIVE SUMMARY
FIGURE 04.TOP IMPACTING FACTORS
FIGURE 05.TOP INVESTMENT POCKETS
FIGURE 06.KEY PLAYER POSITIONING, 2020 (%)
FIGURE 07.MACRO-ECONOMIC INDICATORS PROJECTIONS (1/2):
FIGURE 08.MACRO-ECONOMIC INDICATORS PROJECTIONS (2/2):
FIGURE 09.COMPETITIVE DASHBOARD OF TOP 10 KEY PLAYERS (1/2)
FIGURE 10.COMPETITIVE DASHBOARD OF TOP 10 KEY PLAYERS (2/2)
FIGURE 11.COMPETITIVE HEAT MAP
FIGURE 12.GLOBAL AIR AMBULANCE SERVICES MARKET, BY SERVICE OPERATOR, 2020-2030
FIGURE 13.COMPARATIVE SHARE ANALYSIS OF AIR AMBULANCE SERVICES MARKET FOR HOSPITAL BASED, BY COUNTRY, 2020 & 2030 ($MILLON)
FIGURE 14.COMPARATIVE SHARE ANALYSIS OF AIR AMBULANCE SERVICES MARKET FOR INDEPENDENT, BY COUNTRY, 2020 & 2030 ($MILLON)
FIGURE 15.COMPARATIVE SHARE ANALYSIS OF AIR AMBULANCE SERVICES MARKET FOR GOVERNMENT, BY COUNTRY, 2020 & 2030 ($MILLON)
FIGURE 16.GLOBAL AIR AMBULANCE SERVICES MARKET, BY SERVICE TYPE, 2020-2030
FIGURE 17.COMPARATIVE SHARE ANALYSIS OF AIR AMBULANCE SERVICES MARKET FOR DOMESTIC, BY COUNTRY, 2020 & 2030 ($MILLON)
FIGURE 18.COMPARATIVE SHARE ANALYSIS OF AIR AMBULANCE SERVICES MARKET FOR INTERNATIONAL, BY COUNTRY, 2020 & 2030 ($MILLON)
FIGURE 19.GLOBAL AIR AMBULANCE SERVICES MARKET, BY AIRCRAFT TYPE, 2020-2030
FIGURE 20.COMPARATIVE SHARE ANALYSIS OF AIR AMBULANCE SERVICES MARKET FOR FIXED-WING, BY COUNTRY, 2020 & 2030 ($MILLON)
FIGURE 21.COMPARATIVE SHARE ANALYSIS OF AIR AMBULANCE SERVICES MARKET FOR ROTARY-WING, BY COUNTRY, 2020 & 2030 ($MILLON)
FIGURE 22.AIR AMBULANCE SERVICES MARKET, BY REGION, 2020-2030 (%)
FIGURE 23.COMPARATIVE SHARE ANALYSIS OF AIR AMBULANCE SERVICES MARKET, BY COUNTRY, 2020–2030 (%)
FIGURE 24.U.S. AIR AMBULANCE SERVICES MARKET, 2020–2030 ($MILLION)
FIGURE 25.CANADA AIR AMBULANCE SERVICES MARKET, 2020–2030 ($MILLION)
FIGURE 26.MEXICO AIR AMBULANCE SERVICES MARKET, 2020–2030 ($MILLION)
FIGURE 27.COMPARATIVE SHARE ANALYSIS OF AIR AMBULANCE SERVICES MARKET, BY COUNTRY, 2020–2030 (%)
FIGURE 28.UK AIR AMBULANCE SERVICES MARKET, 2020–2030 ($MILLION)
FIGURE 29.GERMANY AIR AMBULANCE SERVICES MARKET, 2020–2030 ($MILLION)
FIGURE 30.FRANCE AIR AMBULANCE SERVICES MARKET, 2020–2030 ($MILLION)
FIGURE 31.RUSSIA AIR AMBULANCE SERVICES MARKET, 2020–2030 ($MILLION)
FIGURE 32.ITALY AIR AMBULANCE SERVICES MARKET, 2020–2030 ($MILLION)
FIGURE 33.REST OF EUROPE AIR AMBULANCE SERVICES MARKET, 2020–2030 ($MILLION)
FIGURE 34.COMPARATIVE SHARE ANALYSIS OF AIR AMBULANCE SERVICES MARKET, BY COUNTRY, 2020–2030 (%)
FIGURE 35.CHINA AIR AMBULANCE SERVICES MARKET, 2020–2030 ($MILLION)
FIGURE 36.JAPAN AIR AMBULANCE SERVICES MARKET, 2020–2030 ($MILLION)
FIGURE 37.INDIA AIR AMBULANCE SERVICES MARKET, 2020–2030 ($MILLION)
FIGURE 38.AUSTRALIA AIR AMBULANCE SERVICES MARKET, 2020–2030 ($MILLION)
FIGURE 39.REST OF ASIA-PACIFIC AIR AMBULANCE SERVICES MARKET, 2020–2030 ($MILLION)
FIGURE 40.COMPARATIVE SHARE ANALYSIS OF AIR AMBULANCE SERVICES MARKET, BY COUNTRY, 2020–2030 (%)
FIGURE 41.LATIN AMERICA AIR AMBULANCE SERVICES MARKET, 2020–2030 ($MILLION)
FIGURE 42.MIDDLE EAST AIR AMBULANCE SERVICES MARKET, 2020–2030 ($MILLION)
FIGURE 43.AFRICA AIR AMBULANCE SERVICES MARKET, 2020–2030 ($MILLION)
FIGURE 44.BABCOCK INTERNATIONAL GROUP PLC: NET SALES, 2018–2020 ($MILLION)
FIGURE 45.BABCOCK INTERNATIONAL GROUP PLC: REVENUE SHARE BY SEGMENT, 2020 (%)
FIGURE 46.BABCOCK INTERNATIONAL GROUP PLC: REVENUE SHARE BY REGION, 2020 (%)
The growth of the global air ambulance services market is driven by numerous developments carried out by top aircraft manufacturers, which led to the growth of the market. Moreover, increased production & sales of aircraft followed by rise in need for efficient air-based medical service supplements the growth of the market across the globe.
In addition, the key players, such as Air Medical Group Holdings (AMGH), Air Methods, Alphastar, Babcock Scandinavian AirAmbulance, Envision Healthcare Companies, and others, have collaborated with numerous aircraft & helicopter owners to establish their air ambulance service, which creates a positive impact on the growth of the market across the globe.
Factors, such as increasing rates of trauma, stroke, and heart attacks to propel demand for air medical services, rapid technological advancements in air ambulance services, growth in urban air mobility (UAM) platform, and acquiring the untapped potential of Asia-Pacific, create a positive impact on the growth of the market across the globe.
Among the analyzed regions, North America is the highest revenue contributor, followed by Europe, Asia-Pacific, and LAMEA. On the basis of forecast analysis, Asia-Pacific is expected to maintain its lead during the forecast period, owing to increase in trend for air-based medical services & infrastructural developments across the region.
A. The global air ambulance services market was valued at $5,238.80 million in 2020, and is projected to reach $14,243.90 million by 2030, registering a CAGR of 10.6% from 2021 to 2030.
A. Agreements between government hospitals & private players are the upcoming trends in air ambulance services industry
A. The sample for air ambulance services market report can be obtained on demand from the AMR website. Also, the 24*7 chat support and direct call services are provided to procure the sample report
A. Yes the air ambulance services business profitable due to continuous growth in healthcare sector across the globe
A. The global air ambulance services market is registering a CAGR of 10.6% from 2021 to 2030.
A. The company profiles of the top market players of air ambulance services market can be obtained from the company profile section mentioned in the report. This section includes analysis of top ten player’s operating in the air ambulance services market
A. Continuous development by companies backed by government support creates a positive outlook for the air ambulance services across the globe.
A. The list of company profiles opeerating in the air ambulance services market can be obtained from the company profile section mentioned in the report. This section includes analysis of top ten player’s operating in the air ambulance services market
A. U.S., Canada, germany, France, China are the key matured markets growing in the air ambulance services industry
A. Continuous product development followed by the introduction of electric air ambulance are the known and unknown adjacencies impacting the air ambulance services market
Start reading instantly.
This Report and over 66,782+ more Reports, Available with Avenue Library. T&C*.
Enterprise
License/PDF
Library
Membership
*Taxes/Fees, if applicable will be added during checkout. All prices in USD
To ensure high-level data integrity, accurate analysis, and impeccable forecasts
For complete satisfaction
On-demand customization of scope of the report to exactly meet your needs
Targeted market view to provide pertinent information and save time of readers
Get insights on topics that are crucial for your business. Stay abreast of your interest areas.
Get Industry Data AlertsTo ensure high-level data integrity, accurate analysis, and impeccable forecasts
For complete satisfaction
On-demand customization of scope of the report to exactly meet your needs
Targeted market view to provide pertinent information and save time of readers