
Air-Borne Wind Turbine Market Research, 2030
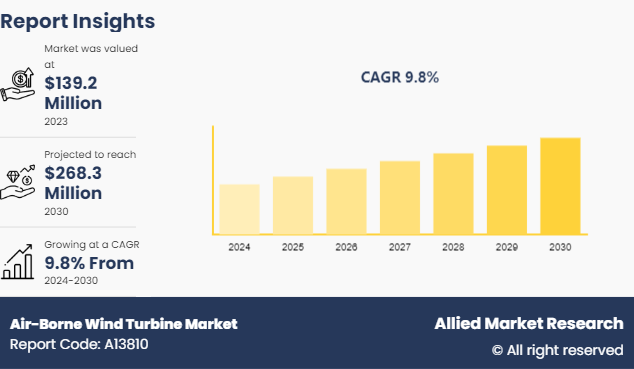
The global air-borne wind turbine market was valued at $139.2 million in 2023, and is projected to reach $268.3 million by 2030, growing at a CAGR of 9.8% from 2024 to 2030.
Market Introduction and Definition
An airborne wind turbine (AWT) is a wind energy device that operates at high altitudes where winds are stronger and more consistent than those near the ground. Unlike traditional wind turbines mounted on towers, AWTs are suspended in the air using tethers or cables and can take the form of kites, balloons, or drones. These devices harness wind energy by converting the kinetic energy of fast-moving winds into electrical power through onboard generators. The electricity generated is transmitted to the ground via the tethers. AWTs have the potential to access high-altitude wind resources, which can be more reliable and potent, offering a promising alternative to conventional wind energy systems, especially in areas where ground-based turbines are less effective.
Key Takeaways
- The air-borne wind turbine market report provides competitive dynamics by evaluating business segments, product portfolios, target market revenue, geographical presence and key strategic developments by prominent manufacturers.
- The air-borne wind turbine market overview is fragmented in nature among prominent companies such as Siemens AG, Nordex Group, ACCIONA S.A, United Power, Envision Energy, Vestas Wind Systems A/S, GE, Goldwind, Enercon GmbH, and Ampyx Power.
- The study contains qualitative information such as the market dynamics (drivers, restraints, challenges, and opportunities) , public policy analysis, pricing analysis, and Porter’s Five Force Analysis across North America, Europe, Asia-Pacific, LAMEA regions.
- Latest trends in global air-borne wind turbine market size such as undergoing R&D activities, regulatory guidelines, and government initiatives are analyzed across 16 countries in 4 different regions.
- More than 3, 200 air-borne wind turbine industry-related product literatures, industry releases, annual reports, and other such documents of key industry participants along with authentic industry journals and government websites have been reviewed for generating high-value industry insights for global air-borne wind turbine market.
Key Market Dynamics
Growing population base coupled with rapid urbanization in both developed and developing economies such as the U.S., China, India, and others has increased the global power demand which in turn has surged the adoption of wind turbine systems for power production activities. The use of air-borne wind turbine (AWT) systems allows to harness wind energy by converting the kinetic energy of fast-moving winds into electrical power through onboard generators. Also, the environmental benefits of AWTs drive the growth of the market. AWTs have a smaller physical footprint compared to traditional wind turbines, as they do not require large bases or extensive land clearing. This minimal land use reduces the impact on local ecosystems and agricultural land, making AWTs a more environmentally friendly option. This factor may augment the growth of the air-borne wind turbine systems market during the forecast period.
Furthermore, advancements in technology play a crucial role in driving the air-borne wind turbine market. Recent developments in materials science, aerodynamics, and control systems have made AWTs more efficient, reliable, and cost-effective. For instance, improvements in lightweight materials and tether technology have enabled the construction of more durable and resilient airborne components. Advances in computer modeling and simulation have enhanced the design and performance optimization of AWTs, ensuring maximum energy capture. This factor may aid the utilization of air-borne wind turbine across renewable power generation sector; thus, fueling the growth of the air-borne wind turbine market.
However, the high initial investment required for air-borne wind turbine (AWT) projects is a major restraint in the air-borne wind turbine market. Although AWTs can potentially reduce costs in the long run, the upfront costs associated with research, development, and deployment are substantial. Developing the necessary technology, testing prototypes, and establishing production facilities involve significant financial outlays. Moreover, the cost of materials and advanced components, such as high-strength tethers and sophisticated control systems, adds to the overall expense. This factor may restrain investors with less investment potential to enter into air-borne wind turbine market; thus, hampering the growth of the air-borne wind turbine market.
On the contrary, supportive policies and international agreements on climate change and renewable energy create significant opportunities for the air-borne wind turbine (AWT) market. Governments around the world are increasingly setting ambitious targets for reducing greenhouse gas emissions and transitioning to renewable energy sources. These policy initiatives often include financial incentives, such as tax credits, grants, and subsidies for renewable energy projects, which can significantly lower the barriers to entry for AWT technologies. Additionally, international agreements like the Paris Agreement underscore the global commitment to combating climate change, encouraging investment in innovative renewable energy solutions, including AWTs. The presence of supportive policies and a favorable regulatory environment may accelerate the development and deployment of AWTs; thus, creating remunerative opportunities for the air-borne wind turbine market growth.
Patent Analysis of Global Air-Borne Wind Turbine Market
This patent analysis provides a comprehensive overview of patents related to air-borne wind turbine and its applications across various power generation sectors and emerging fields. The analysis encompasses patent trends, key patent holders, technological advancements, market segmentation, competitive landscape, and future outlook within the air-borne wind turbine market. Patent filings related to gallic acid have shown a steady increase over the past decade, indicating growing interest and investment in air-borne wind turbine research and development. The majority of patents focus on power generation applications, particularly in the development of medications targeting oxidative stress-related diseases.

Key patent holders in the air-borne wind turbine market include power generation companies, research institutions, and universities. Companies such as Kalinina Liudmila Borisovna, Kalinin Vsevolod Dmitrievich, Kriulin Jury Valentinovich, Wobben Aloys, Guangzhou Ruihai Ocean Tech Co Ltd, South China Sea Survey Tech Center Of State Oceanic Administration (South China Sea Buoy Center Of State Oceanic Administration) , Sunlight College, Wanglan Ocean Tech Research Institute (Zhuhai) Co Ltd, Chen Chengxi, and China Quality Certification Center hold significant patent portfolios covering various aspects of air-borne wind turbine production and applications. Research institutions and universities contribute to patent filings related to novel uses and technological advancements in air-borne wind turbine.
Market Segmentation
The air-borne wind turbine market forecast is segmented on the basis into type, application, and region. By type, the market is bifurcated into onshore and offshore. By application, the market is classified into renewable energy generation, water pumping, and others. Region-wise, the market is studied across areas such as North America, Europe, Asia-Pacific, and LAMEA.
Regional/Country Market Outlook
North America represents a significant market for air-borne wind turbine market share. This is attributed to the fact that North America, particularly the U.S. and Canada, is increasingly prioritizing renewable energy sources to reduce greenhouse gas emissions and combat climate change. Governments, businesses, and consumers are all seeking cleaner alternatives to fossil fuels. Air-borne wind turbine (AWTs) offer a promising solution due to their ability to harness high-altitude winds, which are stronger and more consistent than ground-level winds. This focus on renewable energy is driving investment and interest in innovative technologies like AWTs that can contribute to a sustainable energy future.
Furthermore, the growing interest in renewable energy has led to increased public and private investment in AWT technologies. Governments are funding research and development projects to explore the potential of AWTs, while private companies are investing in the commercialization and deployment of these systems. This influx of investment is driving innovation, reducing costs, and accelerating the adoption of AWTs in North America.
Additionally, AWTs offer significant economic and environmental benefits that drive their demand in North America. Economically, AWTs can reduce the costs associated with energy production by providing a reliable and renewable source of power. This can lead to lower energy prices and reduced dependence on imported fossil fuels. Environmentally, AWTs have a smaller physical footprint compared to traditional wind turbines, minimizing land use and reducing impacts on local ecosystems. Additionally, AWTs produce no emissions during operation, contributing to cleaner air and a healthier environment. These factors altogether may surge the utilization of air-borne wind turbine in the North America region; thus, fueling the market growth.
Competitive Landscape
The major players operating in the air-borne wind turbine market include Siemens AG, Nordex Group, ACCIONA S.A, United Power, Envision Energy, Vestas Wind Systems A/S, GE, Goldwind, Enercon GmbH, and Ampyx Power. In June 2024, Kitemill, a Norwegian startup developing air-borne wind turbine technology acquired aircraft maker Exact Aircraft to generate renewable energy from autonomous kites and drones. This strategic acquisition has enhanced Kitemill’s air-borne wind turbine development project using Exact Aircraft’s aviation technology.
Parent Market Analysis
Parent Market Name | Wind Turbine Market |
Market Value in 2020 | $53.4 billion |
CAGR (2020-2030) | 6.3% |
Drivers | Growing initiatives to combat climate change, Renewable energy integration, and rise in sustainable energy demand |
Restraints | High initial costs |
Industry Trends
- According to a report published by the European Commission in 2022, technological advancements in offshore and onshore wind farms have surged the demand for air-borne wind energy turbines. However, one of the biggest challenges faced by the air-borne wind turbine sector is the need for space. Thus, manufacturers are focusing on producing advanced air-borne wind turbines that require less space and produce high energy output. This factor may surge the demand for air-borne wind turbine in the coming period.
- According to an article published by Renewable Energy Magazine in January 2024, European airborne wind energy developer Kitemill has invested around $2.15 million to refine its air-borne wind turbine technology that offers unique benefits as compared to traditional wind turbine systems. This event may further augment the demand for air-borne wind turbines equipped with modern technology in the coming future.
Key Sources Referred
- National Promotion and Facilitation Agency
- United States Department of Energy
- U.S. Development Authority
- East West Bank
- Office of Energy Efficiency and Renewable Energy
- National Renewable Energy Laboratory
- Invest In India
- Press Information Bureau
Key Benefits For Stakeholders
- This report provides a quantitative analysis of the market segments, current trends, estimations, and dynamics of the air-borne wind turbine market analysis from 2024 to 2030 to identify the prevailing air-borne wind turbine market opportunities.
- The market research is offered along with information related to key drivers, restraints, and opportunities.
- Porter's five forces analysis highlights the potency of buyers and suppliers to enable stakeholders make profit-oriented business decisions and strengthen their supplier-buyer network.
- In-depth analysis of the air-borne wind turbine market segmentation assists to determine the prevailing market opportunities.
- Major countries in each region are mapped according to their revenue contribution to the global market.
- Market player positioning facilitates benchmarking and provides a clear understanding of the present position of the market players.
- The report includes the analysis of the regional as well as global air-borne wind turbine market trends, key players, market segments, application areas, and market growth strategies.
Air-Borne Wind Turbine Market Report Highlights
| Aspects | Details |
| Market Size By 2030 | USD 268.3 Million |
| Growth Rate | CAGR of 9.8% |
| Forecast period | 2024 - 2030 |
| Report Pages | 350 |
| By Type |
|
| By Application |
|
| By Region |
|
| Key Market Players | United Power, Ampyx Power, Siemens AG, GE, Goldwind, Nordex Group, Envision Energy, Vestas Wind Systems A/S, Enercon GmbH, ACCIONA S.A |
Technological advancements, access to higher altitudes, growing energy demand, and rise in government policies and incentives are the upcoming trends of air-borne wind turbine market in the globe.
Renewable energy generation is the leading application of air-borne wind turbine market.
North America is the largest regional market for air-borne wind turbine.
The global air-borne wind turbine market size was valued at $139.2 million in 2023, and is projected to reach $268.3 million by 2030, growing at a CAGR of 9.8% from 2024 to 2030.
Siemens AG, Nordex Group, ACCIONA S.A, United Power, Envision Energy, Vestas Wind Systems A/S, GE, Goldwind, Enercon GmbH, and Ampyx Power are the top companies to hold the market share in air-borne wind turbine.
Loading Table Of Content...

