0
2022
Air Defense Systems Market

Air Defense Systems Market

by Component (Weapon System, Fire Control System, Command and Control System, Others), by Range (Short Range Air Defense System, Medium Range Air Defense System, Long Range Air Defense System), by Platform (Ground, Airborne, Naval), by Type (Missile Defense System, Anti-Aircraft,  Counter Rocket, Artillery, and Mortar System): Global Opportunity Analysis and Industry Forecast, 2021-2031

Report Code: A07789
Oct 2022 | Pages: 345
Tables: 208
Charts: 70
  • Formats*:

  • pdf

    Single User License, Five User
    License & Enterprise User License

  • xls

    Data Pack Excel License

  • ppt

    It comes with the additional cost
    of $2500.00 contact sales.


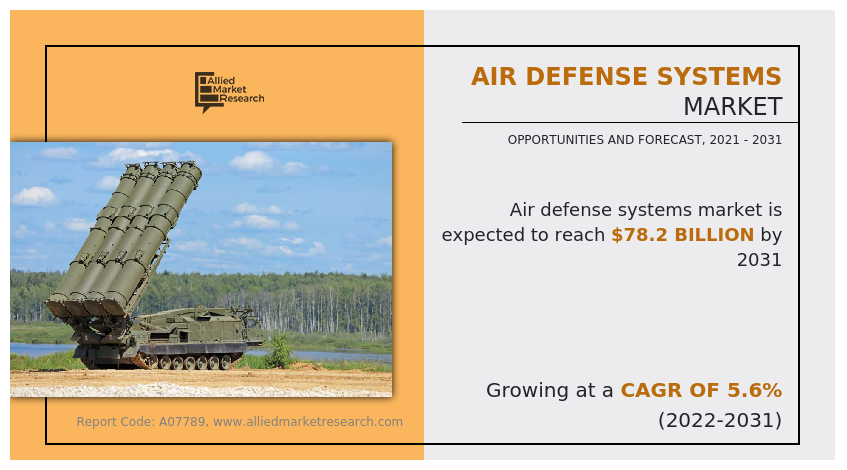
The global air defense systems market was valued at $46.2 billion in 2021, and is projected to reach $78.2 billion by 2031, growing at a CAGR of 5.6% from 2022 to 2031.

Air defense systems include land, aerial, and marine-based technologies used by the defense forces to guard against a variety of missiles, including cruise and ballistic missiles. Amid rise in conflicts and war-like situations across different parts of the world, the demand for air defense systems have grown at a significant rate. Air defense systems ensure the safety of national assets and citizens against missile attacks. With the introduction of more lethal, covert, and nimble enemies, the character of modern warfare has evolved. As the nature of warfare has changed, countries tend to invest in defensive spending; this has resulted in the development of numerous air defense systems. Currently, large defense corporations globally are substantially investing on the development of missile defense systems.

The COVID-19 has a major impact on overall defense industry, followed by the impact on air defense system as well. Allocation of majority of country’s financial and non-financial resources towards managing the pandemic has slowed the process of acquisition and deployment. Moreover, global shutdown of trade, logistics, and manufacturing of required component and scarcity of raw materials have also delayed the delivery cycle. However, the sudden outbreak of Russia-Ukraine war has allowed nations to increase their focus on defense systems, supporting business opportunities within the segment.

Air Defense Systems Market

Growth of the air defense system market is driven by factors such as increase in cross border conflicts, technological advancement in weapon system, usage of new age weapons such as drone, and increasing defense budget expenditure are primary factors supporting the market growth. The global defense expenditure has seen exponential growth in recent years. According to Stockholm International Peace Research Institute (SIPRI), global defense spending reached $1,981 billion in 2020 with a 2.6% year-on-year increase. The military expenditure accounted for 2.4% of the global gross domestic product (GDP) in 2020. Thus, increase in global military expenditure has augmented the adoption of efficient missile defense systems, including the U.S.’s Terminal High Altitude Area Defense (THAAD), Israel’s Iron Dome, and Russia’s S-400.

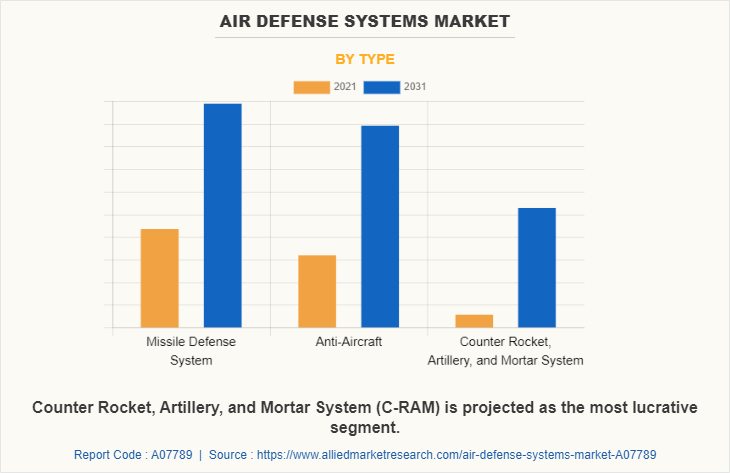
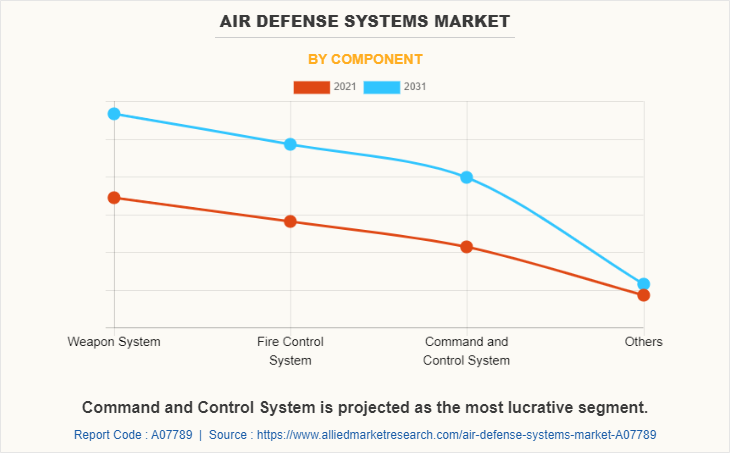
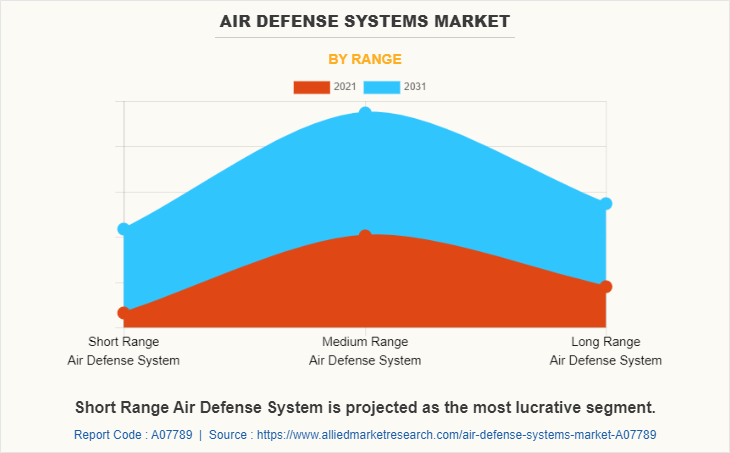
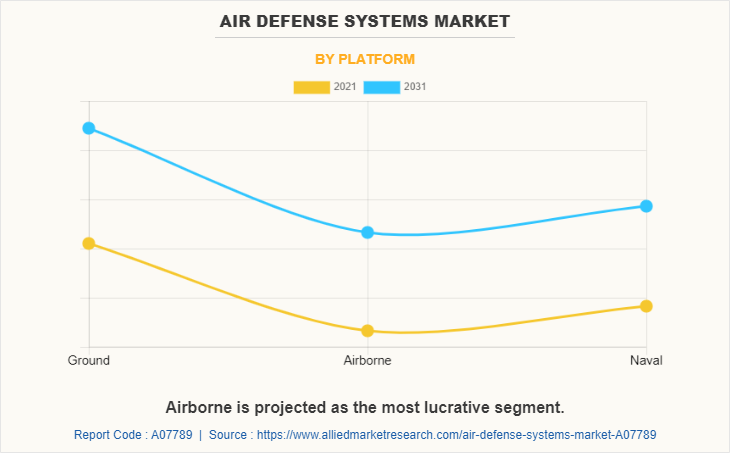
The air defense system market is segmented on the basis of component, range, platform, type, and region. The component segment is divided into weapon system, fire control system, command and control system, and others. The range segment is divided into short range air defense system, medium range air defense system, and long range air defense system. The platform segment includes ground, naval, and airborne. The market within the type segment is divided into missile defense system, anti-aircraft, and counter rocket, artillery, and mortar system. By region, the market is categorized into North America, Europe, Asia-Pacific, and LAMEA.

Air Defense Systems Market

Companies have adopted product development and product launch as their key development strategies in the air defnse system industry. Moreover, collaborations and acquisitions are expected to enable leading players to enhance their product portfolios and expand into different regions. The key players operating in the air defense system market are Saab AB, Lockheed Martin Corporation, BAE Systems PLC, Rheinmetall AG, Thales Group, Kongsberg Gruppen, Raytheon Technologies, MBDA, Northrop Grumman Corporation, Boeing, Hanwha Corporation, Leonardo S.P.A., Airbus Defense and Space, Aselsan A.S., Elbit Systems, and General Dynamics.

Air Defense Systems Market

Increasing defense programs of nations to protect against various threats

The capacity to protect a nation's air space has grown more crucial as air combat technologies have developed, coupled with increased terrorism and cross border conflicts. The force is shielded from enemy air and missile attack by the air defense system. The effectiveness of the U.S. weapon systems aids the nation in guaranteeing that the U.S. military has a tactical fighting edge over any foe. For instance, the U.S, Department of Defense (DoD) requested $247.3 billion for acquisition (Procurement and Research, Development, Test, and Evaluation (RDT&E)) funding for 2020. This amount includes funding from the base budget and the overseas contingency operations (OCO) fund, which totals $143.1 billion for Procurement and $104.3 billion for RDT&E.
Increasing use of early warning systems for potential air and missile attacks

A variety of enemy airborne forces, including aircraft, unmanned aerial vehicles (UAVs), ballistic and cruise missiles, are monitored by air defence systems. For surveillance, these systems often employ long-range L-band radars and satellites. To fight modern ballistic and hypersonic missile threats, system designers are combining high-performance radar, electro-optical sensors, and the most recent digital signal processing on land and in space. To help Polish military officials deal with ambiguous intelligence about prospective air and missile assaults, the Polish government awarded Northrop Grumman Corporation a contract for $350 million in March 2019. The contract calls for the development of two combat management systems.
Air Defense Systems Market

High cost associated to Air defense system

One of the major issues igniting the defense program was the expense of the air defense system. High cost associated with integration and implementation of air defense systems is limiting several nations to undergo long-term acquisition and operation contract. However, these nations practice acquisition and operation of second-hand air defense system, which are scrapped by first world nations. Excluding the cost of manufacturing and constructing nuclear weapons, the U.S. Army successfully designed and then installed the safeguard anti-ballistic missile (ABM) system in North Dakota for $23 billion in 2000. The goal of the Safeguard ABM system is to defend an ICBM launch area against Soviet attack in the form of a retaliatory strike. The system was completely compliant with the ABM Treaty as well as the current consensus strategic approach. However, it only lasted for four months when the U.S. Department of Defense decided to shut it down because running it was too expensive, considering what was eventually thought to be its minimal value to the U.S. security.
Air Defense Systems Market

Development of new-generation air and missile defense systems

Technology superiority is increasingly going to be the decisive factor in future battles. The development of new-generation missiles with high-end technologies is a major threat to strategic locations and platforms, such as military airbases and ships. Some of these new developments include, nuclear-capable ballistic missiles and high-speed cruise missiles. Various countries are developing such advanced weapons that are capable of defeating high-end air defense systems, such as the Medium Extended Air Defense System (MEADS), the patriot advanced capability-3 (PAC-3), and the S-400. 
Air Defense Systems Market

Key Benefits For Stakeholders

  • This report provides a quantitative analysis of the market segments, current trends, estimations, and dynamics of the air defense systems market analysis from 2021 to 2031 to identify the prevailing air defense systems market opportunities.
  • The market research is offered along with information related to key drivers, restraints, and opportunities.
  • Porter's five forces analysis highlights the potency of buyers and suppliers to enable stakeholders make profit-oriented business decisions and strengthen their supplier-buyer network.
  • In-depth analysis of the air defense systems market segmentation assists to determine the prevailing market opportunities.
  • Major countries in each region are mapped according to their revenue contribution to the global market.
  • Market player positioning facilitates benchmarking and provides a clear understanding of the present position of the market players.
  • The report includes the analysis of the regional as well as global air defense systems market trends, key players, market segments, application areas, and market growth strategies.

Air Defense Systems Market Report Highlights

Aspects Details
Market Size By 2031 USD 78.2 billion
Growth Rate CAGR of 5.6%
Forecast period 2021 - 2031
Report Pages 345
By Type
  • Anti-Aircraft
  •  Counter Rocket, Artillery, and Mortar System
  • Missile Defense System
By Component
  • Weapon System
  • Fire Control System
  • Command and Control System
  • Others
By Range
  • Short Range Air Defense System
  • Medium Range Air Defense System
  • Long Range Air Defense System
By Platform
  • Ground
  • Airborne
  • Naval
By Region
  • North America  (U.S., Canada, Mexico)
  • Europe  (UK, Germany, France, Russia, Italy, Spain, Rest Of Europe)
  • Asia-Pacific  (South Korea, Rest Of Asia-Pacific, China, India, Japa, Australia)
  • LAMEA  (Latin America, Middle East, Africa)
Key Market Players Boeing, BAE Systems PLC, L3Harris Technologies, Thales Group, Northrop Grumman Corporation, Kongsberg Gruppen, Rheinmetall AG, MBDA, Elbit Systems, Lockheed Martin Corporation, Hanwha Corporation, Raytheon Technologies, Saab AB, General Dynamics, Leonardo S.P.A., Airbus Defense and Space
 
  • CHAPTER 1:INTRODUCTION

    • 1.1.Report description

    • 1.2.Key market segments

    • 1.3.Key benefits to the stakeholders

    • 1.4.Research Methodology

      • 1.4.1.Secondary research

      • 1.4.2.Primary research

      • 1.4.3.Analyst tools and models

  • CHAPTER 2:EXECUTIVE SUMMARY

    • 2.1.Key findings of the study

    • 2.2.CXO Perspective

  • CHAPTER 3:MARKET OVERVIEW

    • 3.1.Market definition and scope

    • 3.2.Key findings

      • 3.2.1.Top investment pockets

    • 3.3.Porter’s five forces analysis

    • 3.4.Top player positioning

    • 3.5.Market dynamics

      • 3.5.1.Drivers

      • 3.5.2.Restraints

      • 3.5.3.Opportunities

    • 3.6.COVID-19 Impact Analysis on the market

  • CHAPTER 4: AIR DEFENSE SYSTEMS MARKET, BY COMPONENT

    • 4.1 Overview

      • 4.1.1 Market size and forecast

    • 4.2 Weapon System

      • 4.2.1 Key market trends, growth factors and opportunities

      • 4.2.2 Market size and forecast, by region

      • 4.2.3 Market analysis by country

    • 4.3 Fire Control System

      • 4.3.1 Key market trends, growth factors and opportunities

      • 4.3.2 Market size and forecast, by region

      • 4.3.3 Market analysis by country

    • 4.4 Command and Control System

      • 4.4.1 Key market trends, growth factors and opportunities

      • 4.4.2 Market size and forecast, by region

      • 4.4.3 Market analysis by country

    • 4.5 Others

      • 4.5.1 Key market trends, growth factors and opportunities

      • 4.5.2 Market size and forecast, by region

      • 4.5.3 Market analysis by country

  • CHAPTER 5: AIR DEFENSE SYSTEMS MARKET, BY RANGE

    • 5.1 Overview

      • 5.1.1 Market size and forecast

    • 5.2 Short Range Air Defense System

      • 5.2.1 Key market trends, growth factors and opportunities

      • 5.2.2 Market size and forecast, by region

      • 5.2.3 Market analysis by country

    • 5.3 Medium Range Air Defense System

      • 5.3.1 Key market trends, growth factors and opportunities

      • 5.3.2 Market size and forecast, by region

      • 5.3.3 Market analysis by country

    • 5.4 Long Range Air Defense System

      • 5.4.1 Key market trends, growth factors and opportunities

      • 5.4.2 Market size and forecast, by region

      • 5.4.3 Market analysis by country

  • CHAPTER 6: AIR DEFENSE SYSTEMS MARKET, BY PLATFORM

    • 6.1 Overview

      • 6.1.1 Market size and forecast

    • 6.2 Ground

      • 6.2.1 Key market trends, growth factors and opportunities

      • 6.2.2 Market size and forecast, by region

      • 6.2.3 Market analysis by country

    • 6.3 Airborne

      • 6.3.1 Key market trends, growth factors and opportunities

      • 6.3.2 Market size and forecast, by region

      • 6.3.3 Market analysis by country

    • 6.4 Naval

      • 6.4.1 Key market trends, growth factors and opportunities

      • 6.4.2 Market size and forecast, by region

      • 6.4.3 Market analysis by country

  • CHAPTER 7: AIR DEFENSE SYSTEMS MARKET, BY TYPE

    • 7.1 Overview

      • 7.1.1 Market size and forecast

    • 7.2 Missile Defense System

      • 7.2.1 Key market trends, growth factors and opportunities

      • 7.2.2 Market size and forecast, by region

      • 7.2.3 Market analysis by country

    • 7.3 Anti-Aircraft

      • 7.3.1 Key market trends, growth factors and opportunities

      • 7.3.2 Market size and forecast, by region

      • 7.3.3 Market analysis by country

    • 7.4  Counter Rocket, Artillery, and Mortar System

      • 7.4.1 Key market trends, growth factors and opportunities

      • 7.4.2 Market size and forecast, by region

      • 7.4.3 Market analysis by country

  • CHAPTER 8: AIR DEFENSE SYSTEMS MARKET, BY REGION

    • 8.1 Overview

      • 8.1.1 Market size and forecast

    • 8.2 North America

      • 8.2.1 Key trends and opportunities

      • 8.2.2 North America Market size and forecast, by Component

      • 8.2.3 North America Market size and forecast, by Range

      • 8.2.4 North America Market size and forecast, by Platform

      • 8.2.5 North America Market size and forecast, by Type

      • 8.2.6 North America Market size and forecast, by country

        • 8.2.6.1 U.S.
          • 8.2.6.1.1 Market size and forecast, by Component
          • 8.2.6.1.2 Market size and forecast, by Range
          • 8.2.6.1.3 Market size and forecast, by Platform
          • 8.2.6.1.4 Market size and forecast, by Type
        • 8.2.6.2 Canada
          • 8.2.6.2.1 Market size and forecast, by Component
          • 8.2.6.2.2 Market size and forecast, by Range
          • 8.2.6.2.3 Market size and forecast, by Platform
          • 8.2.6.2.4 Market size and forecast, by Type
        • 8.2.6.3 Mexico
          • 8.2.6.3.1 Market size and forecast, by Component
          • 8.2.6.3.2 Market size and forecast, by Range
          • 8.2.6.3.3 Market size and forecast, by Platform
          • 8.2.6.3.4 Market size and forecast, by Type
    • 8.3 Europe

      • 8.3.1 Key trends and opportunities

      • 8.3.2 Europe Market size and forecast, by Component

      • 8.3.3 Europe Market size and forecast, by Range

      • 8.3.4 Europe Market size and forecast, by Platform

      • 8.3.5 Europe Market size and forecast, by Type

      • 8.3.6 Europe Market size and forecast, by country

        • 8.3.6.1 UK
          • 8.3.6.1.1 Market size and forecast, by Component
          • 8.3.6.1.2 Market size and forecast, by Range
          • 8.3.6.1.3 Market size and forecast, by Platform
          • 8.3.6.1.4 Market size and forecast, by Type
        • 8.3.6.2 Germany
          • 8.3.6.2.1 Market size and forecast, by Component
          • 8.3.6.2.2 Market size and forecast, by Range
          • 8.3.6.2.3 Market size and forecast, by Platform
          • 8.3.6.2.4 Market size and forecast, by Type
        • 8.3.6.3 France
          • 8.3.6.3.1 Market size and forecast, by Component
          • 8.3.6.3.2 Market size and forecast, by Range
          • 8.3.6.3.3 Market size and forecast, by Platform
          • 8.3.6.3.4 Market size and forecast, by Type
        • 8.3.6.4 Russia
          • 8.3.6.4.1 Market size and forecast, by Component
          • 8.3.6.4.2 Market size and forecast, by Range
          • 8.3.6.4.3 Market size and forecast, by Platform
          • 8.3.6.4.4 Market size and forecast, by Type
        • 8.3.6.5 Italy
          • 8.3.6.5.1 Market size and forecast, by Component
          • 8.3.6.5.2 Market size and forecast, by Range
          • 8.3.6.5.3 Market size and forecast, by Platform
          • 8.3.6.5.4 Market size and forecast, by Type
        • 8.3.6.6 Spain
          • 8.3.6.6.1 Market size and forecast, by Component
          • 8.3.6.6.2 Market size and forecast, by Range
          • 8.3.6.6.3 Market size and forecast, by Platform
          • 8.3.6.6.4 Market size and forecast, by Type
        • 8.3.6.7 Rest of Europe
          • 8.3.6.7.1 Market size and forecast, by Component
          • 8.3.6.7.2 Market size and forecast, by Range
          • 8.3.6.7.3 Market size and forecast, by Platform
          • 8.3.6.7.4 Market size and forecast, by Type
    • 8.4 Asia-Pacific

      • 8.4.1 Key trends and opportunities

      • 8.4.2 Asia-Pacific Market size and forecast, by Component

      • 8.4.3 Asia-Pacific Market size and forecast, by Range

      • 8.4.4 Asia-Pacific Market size and forecast, by Platform

      • 8.4.5 Asia-Pacific Market size and forecast, by Type

      • 8.4.6 Asia-Pacific Market size and forecast, by country

        • 8.4.6.1 China
          • 8.4.6.1.1 Market size and forecast, by Component
          • 8.4.6.1.2 Market size and forecast, by Range
          • 8.4.6.1.3 Market size and forecast, by Platform
          • 8.4.6.1.4 Market size and forecast, by Type
        • 8.4.6.2 India
          • 8.4.6.2.1 Market size and forecast, by Component
          • 8.4.6.2.2 Market size and forecast, by Range
          • 8.4.6.2.3 Market size and forecast, by Platform
          • 8.4.6.2.4 Market size and forecast, by Type
        • 8.4.6.3 Japa
          • 8.4.6.3.1 Market size and forecast, by Component
          • 8.4.6.3.2 Market size and forecast, by Range
          • 8.4.6.3.3 Market size and forecast, by Platform
          • 8.4.6.3.4 Market size and forecast, by Type
        • 8.4.6.4 Australia
          • 8.4.6.4.1 Market size and forecast, by Component
          • 8.4.6.4.2 Market size and forecast, by Range
          • 8.4.6.4.3 Market size and forecast, by Platform
          • 8.4.6.4.4 Market size and forecast, by Type
        • 8.4.6.5 South Korea
          • 8.4.6.5.1 Market size and forecast, by Component
          • 8.4.6.5.2 Market size and forecast, by Range
          • 8.4.6.5.3 Market size and forecast, by Platform
          • 8.4.6.5.4 Market size and forecast, by Type
        • 8.4.6.6 Rest of Asia-Pacific
          • 8.4.6.6.1 Market size and forecast, by Component
          • 8.4.6.6.2 Market size and forecast, by Range
          • 8.4.6.6.3 Market size and forecast, by Platform
          • 8.4.6.6.4 Market size and forecast, by Type
    • 8.5 LAMEA

      • 8.5.1 Key trends and opportunities

      • 8.5.2 LAMEA Market size and forecast, by Component

      • 8.5.3 LAMEA Market size and forecast, by Range

      • 8.5.4 LAMEA Market size and forecast, by Platform

      • 8.5.5 LAMEA Market size and forecast, by Type

      • 8.5.6 LAMEA Market size and forecast, by country

        • 8.5.6.1 Latin America
          • 8.5.6.1.1 Market size and forecast, by Component
          • 8.5.6.1.2 Market size and forecast, by Range
          • 8.5.6.1.3 Market size and forecast, by Platform
          • 8.5.6.1.4 Market size and forecast, by Type
        • 8.5.6.2 Middle East
          • 8.5.6.2.1 Market size and forecast, by Component
          • 8.5.6.2.2 Market size and forecast, by Range
          • 8.5.6.2.3 Market size and forecast, by Platform
          • 8.5.6.2.4 Market size and forecast, by Type
        • 8.5.6.3 Africa
          • 8.5.6.3.1 Market size and forecast, by Component
          • 8.5.6.3.2 Market size and forecast, by Range
          • 8.5.6.3.3 Market size and forecast, by Platform
          • 8.5.6.3.4 Market size and forecast, by Type
  • CHAPTER 9: COMPANY LANDSCAPE

    • 9.1. Introduction

    • 9.2. Top winning strategies

    • 9.3. Product Mapping of Top 10 Player

    • 9.4. Competitive Dashboard

    • 9.5. Competitive Heatmap

    • 9.6. Key developments

  • CHAPTER 10: COMPANY PROFILES

    • 10.1 Saab AB

      • 10.1.1 Company overview

      • 10.1.2 Company snapshot

      • 10.1.3 Operating business segments

      • 10.1.4 Product portfolio

      • 10.1.5 Business performance

      • 10.1.6 Key strategic moves and developments

    • 10.2 Lockheed Martin Corporation

      • 10.2.1 Company overview

      • 10.2.2 Company snapshot

      • 10.2.3 Operating business segments

      • 10.2.4 Product portfolio

      • 10.2.5 Business performance

      • 10.2.6 Key strategic moves and developments

    • 10.3 BAE Systems PLC

      • 10.3.1 Company overview

      • 10.3.2 Company snapshot

      • 10.3.3 Operating business segments

      • 10.3.4 Product portfolio

      • 10.3.5 Business performance

      • 10.3.6 Key strategic moves and developments

    • 10.4 Rheinmetall AG

      • 10.4.1 Company overview

      • 10.4.2 Company snapshot

      • 10.4.3 Operating business segments

      • 10.4.4 Product portfolio

      • 10.4.5 Business performance

      • 10.4.6 Key strategic moves and developments

    • 10.5 Thales Group

      • 10.5.1 Company overview

      • 10.5.2 Company snapshot

      • 10.5.3 Operating business segments

      • 10.5.4 Product portfolio

      • 10.5.5 Business performance

      • 10.5.6 Key strategic moves and developments

    • 10.6 Kongsberg Gruppen

      • 10.6.1 Company overview

      • 10.6.2 Company snapshot

      • 10.6.3 Operating business segments

      • 10.6.4 Product portfolio

      • 10.6.5 Business performance

      • 10.6.6 Key strategic moves and developments

    • 10.7 Raytheon Technologies

      • 10.7.1 Company overview

      • 10.7.2 Company snapshot

      • 10.7.3 Operating business segments

      • 10.7.4 Product portfolio

      • 10.7.5 Business performance

      • 10.7.6 Key strategic moves and developments

    • 10.8 MBDA

      • 10.8.1 Company overview

      • 10.8.2 Company snapshot

      • 10.8.3 Operating business segments

      • 10.8.4 Product portfolio

      • 10.8.5 Business performance

      • 10.8.6 Key strategic moves and developments

    • 10.9 Northrop Grumman Corporation

      • 10.9.1 Company overview

      • 10.9.2 Company snapshot

      • 10.9.3 Operating business segments

      • 10.9.4 Product portfolio

      • 10.9.5 Business performance

      • 10.9.6 Key strategic moves and developments

    • 10.10 Boeing

      • 10.10.1 Company overview

      • 10.10.2 Company snapshot

      • 10.10.3 Operating business segments

      • 10.10.4 Product portfolio

      • 10.10.5 Business performance

      • 10.10.6 Key strategic moves and developments

    • 10.11 Hanwha Corporation

      • 10.11.1 Company overview

      • 10.11.2 Company snapshot

      • 10.11.3 Operating business segments

      • 10.11.4 Product portfolio

      • 10.11.5 Business performance

      • 10.11.6 Key strategic moves and developments

    • 10.12 Leonardo S.P.A.

      • 10.12.1 Company overview

      • 10.12.2 Company snapshot

      • 10.12.3 Operating business segments

      • 10.12.4 Product portfolio

      • 10.12.5 Business performance

      • 10.12.6 Key strategic moves and developments

    • 10.13 Airbus Defense and Space

      • 10.13.1 Company overview

      • 10.13.2 Company snapshot

      • 10.13.3 Operating business segments

      • 10.13.4 Product portfolio

      • 10.13.5 Business performance

      • 10.13.6 Key strategic moves and developments

    • 10.14 Elbit Systems

      • 10.14.1 Company overview

      • 10.14.2 Company snapshot

      • 10.14.3 Operating business segments

      • 10.14.4 Product portfolio

      • 10.14.5 Business performance

      • 10.14.6 Key strategic moves and developments

    • 10.15 General Dynamics

      • 10.15.1 Company overview

      • 10.15.2 Company snapshot

      • 10.15.3 Operating business segments

      • 10.15.4 Product portfolio

      • 10.15.5 Business performance

      • 10.15.6 Key strategic moves and developments

    • 10.16 L3Harris Technologies

      • 10.16.1 Company overview

      • 10.16.2 Company snapshot

      • 10.16.3 Operating business segments

      • 10.16.4 Product portfolio

      • 10.16.5 Business performance

      • 10.16.6 Key strategic moves and developments

  • LIST OF TABLES

  • TABLE 1. GLOBAL AIR DEFENSE SYSTEMS MARKET, BY COMPONENT, 2021-2031 ($MILLION)
    TABLE 2. AIR DEFENSE SYSTEMS MARKET, FOR WEAPON SYSTEM, BY REGION, 2021-2031 ($MILLION)
    TABLE 3. AIR DEFENSE SYSTEMS MARKET FOR WEAPON SYSTEM, BY COUNTRY, 2021-2031 ($MILLION)
    TABLE 4. AIR DEFENSE SYSTEMS MARKET, FOR FIRE CONTROL SYSTEM, BY REGION, 2021-2031 ($MILLION)
    TABLE 5. AIR DEFENSE SYSTEMS MARKET FOR FIRE CONTROL SYSTEM, BY COUNTRY, 2021-2031 ($MILLION)
    TABLE 6. AIR DEFENSE SYSTEMS MARKET, FOR COMMAND AND CONTROL SYSTEM, BY REGION, 2021-2031 ($MILLION)
    TABLE 7. AIR DEFENSE SYSTEMS MARKET FOR COMMAND AND CONTROL SYSTEM, BY COUNTRY, 2021-2031 ($MILLION)
    TABLE 8. AIR DEFENSE SYSTEMS MARKET, FOR OTHERS, BY REGION, 2021-2031 ($MILLION)
    TABLE 9. AIR DEFENSE SYSTEMS MARKET FOR OTHERS, BY COUNTRY, 2021-2031 ($MILLION)
    TABLE 10. GLOBAL AIR DEFENSE SYSTEMS MARKET, BY RANGE, 2021-2031 ($MILLION)
    TABLE 11. AIR DEFENSE SYSTEMS MARKET, FOR SHORT RANGE AIR DEFENSE SYSTEM, BY REGION, 2021-2031 ($MILLION)
    TABLE 12. AIR DEFENSE SYSTEMS MARKET FOR SHORT RANGE AIR DEFENSE SYSTEM, BY COUNTRY, 2021-2031 ($MILLION)
    TABLE 13. AIR DEFENSE SYSTEMS MARKET, FOR MEDIUM RANGE AIR DEFENSE SYSTEM, BY REGION, 2021-2031 ($MILLION)
    TABLE 14. AIR DEFENSE SYSTEMS MARKET FOR MEDIUM RANGE AIR DEFENSE SYSTEM, BY COUNTRY, 2021-2031 ($MILLION)
    TABLE 15. AIR DEFENSE SYSTEMS MARKET, FOR LONG RANGE AIR DEFENSE SYSTEM, BY REGION, 2021-2031 ($MILLION)
    TABLE 16. AIR DEFENSE SYSTEMS MARKET FOR LONG RANGE AIR DEFENSE SYSTEM, BY COUNTRY, 2021-2031 ($MILLION)
    TABLE 17. GLOBAL AIR DEFENSE SYSTEMS MARKET, BY PLATFORM, 2021-2031 ($MILLION)
    TABLE 18. AIR DEFENSE SYSTEMS MARKET, FOR GROUND, BY REGION, 2021-2031 ($MILLION)
    TABLE 19. AIR DEFENSE SYSTEMS MARKET FOR GROUND, BY COUNTRY, 2021-2031 ($MILLION)
    TABLE 20. AIR DEFENSE SYSTEMS MARKET, FOR AIRBORNE, BY REGION, 2021-2031 ($MILLION)
    TABLE 21. AIR DEFENSE SYSTEMS MARKET FOR AIRBORNE, BY COUNTRY, 2021-2031 ($MILLION)
    TABLE 22. AIR DEFENSE SYSTEMS MARKET, FOR NAVAL, BY REGION, 2021-2031 ($MILLION)
    TABLE 23. AIR DEFENSE SYSTEMS MARKET FOR NAVAL, BY COUNTRY, 2021-2031 ($MILLION)
    TABLE 24. GLOBAL AIR DEFENSE SYSTEMS MARKET, BY TYPE, 2021-2031 ($MILLION)
    TABLE 25. AIR DEFENSE SYSTEMS MARKET, FOR MISSILE DEFENSE SYSTEM, BY REGION, 2021-2031 ($MILLION)
    TABLE 26. AIR DEFENSE SYSTEMS MARKET FOR MISSILE DEFENSE SYSTEM, BY COUNTRY, 2021-2031 ($MILLION)
    TABLE 27. AIR DEFENSE SYSTEMS MARKET, FOR ANTI-AIRCRAFT, BY REGION, 2021-2031 ($MILLION)
    TABLE 28. AIR DEFENSE SYSTEMS MARKET FOR ANTI-AIRCRAFT, BY COUNTRY, 2021-2031 ($MILLION)
    TABLE 29. AIR DEFENSE SYSTEMS MARKET, FOR  COUNTER ROCKET, ARTILLERY, AND MORTAR SYSTEM, BY REGION, 2021-2031 ($MILLION)
    TABLE 30. AIR DEFENSE SYSTEMS MARKET FOR  COUNTER ROCKET, ARTILLERY, AND MORTAR SYSTEM, BY COUNTRY, 2021-2031 ($MILLION)
    TABLE 31. AIR DEFENSE SYSTEMS MARKET, BY REGION, 2021-2031 ($MILLION)
    TABLE 32. NORTH AMERICA AIR DEFENSE SYSTEMS MARKET, BY COMPONENT, 2021-2031 ($MILLION)
    TABLE 33. NORTH AMERICA AIR DEFENSE SYSTEMS MARKET, BY RANGE, 2021-2031 ($MILLION)
    TABLE 34. NORTH AMERICA AIR DEFENSE SYSTEMS MARKET, BY PLATFORM, 2021-2031 ($MILLION)
    TABLE 35. NORTH AMERICA AIR DEFENSE SYSTEMS MARKET, BY TYPE, 2021-2031 ($MILLION)
    TABLE 36. NORTH AMERICA AIR DEFENSE SYSTEMS MARKET, BY COUNTRY, 2021-2031 ($MILLION)
    TABLE 37. U.S. AIR DEFENSE SYSTEMS MARKET, BY COMPONENT, 2021-2031 ($MILLION)
    TABLE 38. U.S. AIR DEFENSE SYSTEMS MARKET, BY RANGE, 2021-2031 ($MILLION)
    TABLE 39. U.S. AIR DEFENSE SYSTEMS MARKET, BY PLATFORM, 2021-2031 ($MILLION)
    TABLE 40. U.S. AIR DEFENSE SYSTEMS MARKET, BY TYPE, 2021-2031 ($MILLION)
    TABLE 41. CANADA AIR DEFENSE SYSTEMS MARKET, BY COMPONENT, 2021-2031 ($MILLION)
    TABLE 42. CANADA AIR DEFENSE SYSTEMS MARKET, BY RANGE, 2021-2031 ($MILLION)
    TABLE 43. CANADA AIR DEFENSE SYSTEMS MARKET, BY PLATFORM, 2021-2031 ($MILLION)
    TABLE 44. CANADA AIR DEFENSE SYSTEMS MARKET, BY TYPE, 2021-2031 ($MILLION)
    TABLE 45. MEXICO AIR DEFENSE SYSTEMS MARKET, BY COMPONENT, 2021-2031 ($MILLION)
    TABLE 46. MEXICO AIR DEFENSE SYSTEMS MARKET, BY RANGE, 2021-2031 ($MILLION)
    TABLE 47. MEXICO AIR DEFENSE SYSTEMS MARKET, BY PLATFORM, 2021-2031 ($MILLION)
    TABLE 48. MEXICO AIR DEFENSE SYSTEMS MARKET, BY TYPE, 2021-2031 ($MILLION)
    TABLE 49. EUROPE AIR DEFENSE SYSTEMS MARKET, BY COMPONENT, 2021-2031 ($MILLION)
    TABLE 50. EUROPE AIR DEFENSE SYSTEMS MARKET, BY RANGE, 2021-2031 ($MILLION)
    TABLE 51. EUROPE AIR DEFENSE SYSTEMS MARKET, BY PLATFORM, 2021-2031 ($MILLION)
    TABLE 52. EUROPE AIR DEFENSE SYSTEMS MARKET, BY TYPE, 2021-2031 ($MILLION)
    TABLE 53. EUROPE AIR DEFENSE SYSTEMS MARKET, BY COUNTRY, 2021-2031 ($MILLION)
    TABLE 54. UK AIR DEFENSE SYSTEMS MARKET, BY COMPONENT, 2021-2031 ($MILLION)
    TABLE 55. UK AIR DEFENSE SYSTEMS MARKET, BY RANGE, 2021-2031 ($MILLION)
    TABLE 56. UK AIR DEFENSE SYSTEMS MARKET, BY PLATFORM, 2021-2031 ($MILLION)
    TABLE 57. UK AIR DEFENSE SYSTEMS MARKET, BY TYPE, 2021-2031 ($MILLION)
    TABLE 58. GERMANY AIR DEFENSE SYSTEMS MARKET, BY COMPONENT, 2021-2031 ($MILLION)
    TABLE 59. GERMANY AIR DEFENSE SYSTEMS MARKET, BY RANGE, 2021-2031 ($MILLION)
    TABLE 60. GERMANY AIR DEFENSE SYSTEMS MARKET, BY PLATFORM, 2021-2031 ($MILLION)
    TABLE 61. GERMANY AIR DEFENSE SYSTEMS MARKET, BY TYPE, 2021-2031 ($MILLION)
    TABLE 62. FRANCE AIR DEFENSE SYSTEMS MARKET, BY COMPONENT, 2021-2031 ($MILLION)
    TABLE 63. FRANCE AIR DEFENSE SYSTEMS MARKET, BY RANGE, 2021-2031 ($MILLION)
    TABLE 64. FRANCE AIR DEFENSE SYSTEMS MARKET, BY PLATFORM, 2021-2031 ($MILLION)
    TABLE 65. FRANCE AIR DEFENSE SYSTEMS MARKET, BY TYPE, 2021-2031 ($MILLION)
    TABLE 66. RUSSIA AIR DEFENSE SYSTEMS MARKET, BY COMPONENT, 2021-2031 ($MILLION)
    TABLE 67. RUSSIA AIR DEFENSE SYSTEMS MARKET, BY RANGE, 2021-2031 ($MILLION)
    TABLE 68. RUSSIA AIR DEFENSE SYSTEMS MARKET, BY PLATFORM, 2021-2031 ($MILLION)
    TABLE 69. RUSSIA AIR DEFENSE SYSTEMS MARKET, BY TYPE, 2021-2031 ($MILLION)
    TABLE 70. ITALY AIR DEFENSE SYSTEMS MARKET, BY COMPONENT, 2021-2031 ($MILLION)
    TABLE 71. ITALY AIR DEFENSE SYSTEMS MARKET, BY RANGE, 2021-2031 ($MILLION)
    TABLE 72. ITALY AIR DEFENSE SYSTEMS MARKET, BY PLATFORM, 2021-2031 ($MILLION)
    TABLE 73. ITALY AIR DEFENSE SYSTEMS MARKET, BY TYPE, 2021-2031 ($MILLION)
    TABLE 74. SPAIN AIR DEFENSE SYSTEMS MARKET, BY COMPONENT, 2021-2031 ($MILLION)
    TABLE 75. SPAIN AIR DEFENSE SYSTEMS MARKET, BY RANGE, 2021-2031 ($MILLION)
    TABLE 76. SPAIN AIR DEFENSE SYSTEMS MARKET, BY PLATFORM, 2021-2031 ($MILLION)
    TABLE 77. SPAIN AIR DEFENSE SYSTEMS MARKET, BY TYPE, 2021-2031 ($MILLION)
    TABLE 78. REST OF EUROPE AIR DEFENSE SYSTEMS MARKET, BY COMPONENT, 2021-2031 ($MILLION)
    TABLE 79. REST OF EUROPE AIR DEFENSE SYSTEMS MARKET, BY RANGE, 2021-2031 ($MILLION)
    TABLE 80. REST OF EUROPE AIR DEFENSE SYSTEMS MARKET, BY PLATFORM, 2021-2031 ($MILLION)
    TABLE 81. REST OF EUROPE AIR DEFENSE SYSTEMS MARKET, BY TYPE, 2021-2031 ($MILLION)
    TABLE 82. ASIA-PACIFIC AIR DEFENSE SYSTEMS MARKET, BY COMPONENT, 2021-2031 ($MILLION)
    TABLE 83. ASIA-PACIFIC AIR DEFENSE SYSTEMS MARKET, BY RANGE, 2021-2031 ($MILLION)
    TABLE 84. ASIA-PACIFIC AIR DEFENSE SYSTEMS MARKET, BY PLATFORM, 2021-2031 ($MILLION)
    TABLE 85. ASIA-PACIFIC AIR DEFENSE SYSTEMS MARKET, BY TYPE, 2021-2031 ($MILLION)
    TABLE 86. ASIA-PACIFIC AIR DEFENSE SYSTEMS MARKET, BY COUNTRY, 2021-2031 ($MILLION)
    TABLE 87. CHINA AIR DEFENSE SYSTEMS MARKET, BY COMPONENT, 2021-2031 ($MILLION)
    TABLE 88. CHINA AIR DEFENSE SYSTEMS MARKET, BY RANGE, 2021-2031 ($MILLION)
    TABLE 89. CHINA AIR DEFENSE SYSTEMS MARKET, BY PLATFORM, 2021-2031 ($MILLION)
    TABLE 90. CHINA AIR DEFENSE SYSTEMS MARKET, BY TYPE, 2021-2031 ($MILLION)
    TABLE 91. INDIA AIR DEFENSE SYSTEMS MARKET, BY COMPONENT, 2021-2031 ($MILLION)
    TABLE 92. INDIA AIR DEFENSE SYSTEMS MARKET, BY RANGE, 2021-2031 ($MILLION)
    TABLE 93. INDIA AIR DEFENSE SYSTEMS MARKET, BY PLATFORM, 2021-2031 ($MILLION)
    TABLE 94. INDIA AIR DEFENSE SYSTEMS MARKET, BY TYPE, 2021-2031 ($MILLION)
    TABLE 95. JAPA AIR DEFENSE SYSTEMS MARKET, BY COMPONENT, 2021-2031 ($MILLION)
    TABLE 96. JAPA AIR DEFENSE SYSTEMS MARKET, BY RANGE, 2021-2031 ($MILLION)
    TABLE 97. JAPA AIR DEFENSE SYSTEMS MARKET, BY PLATFORM, 2021-2031 ($MILLION)
    TABLE 98. JAPA AIR DEFENSE SYSTEMS MARKET, BY TYPE, 2021-2031 ($MILLION)
    TABLE 99. AUSTRALIA AIR DEFENSE SYSTEMS MARKET, BY COMPONENT, 2021-2031 ($MILLION)
    TABLE 100. AUSTRALIA AIR DEFENSE SYSTEMS MARKET, BY RANGE, 2021-2031 ($MILLION)
    TABLE 101. AUSTRALIA AIR DEFENSE SYSTEMS MARKET, BY PLATFORM, 2021-2031 ($MILLION)
    TABLE 102. AUSTRALIA AIR DEFENSE SYSTEMS MARKET, BY TYPE, 2021-2031 ($MILLION)
    TABLE 103. SOUTH KOREA AIR DEFENSE SYSTEMS MARKET, BY COMPONENT, 2021-2031 ($MILLION)
    TABLE 104. SOUTH KOREA AIR DEFENSE SYSTEMS MARKET, BY RANGE, 2021-2031 ($MILLION)
    TABLE 105. SOUTH KOREA AIR DEFENSE SYSTEMS MARKET, BY PLATFORM, 2021-2031 ($MILLION)
    TABLE 106. SOUTH KOREA AIR DEFENSE SYSTEMS MARKET, BY TYPE, 2021-2031 ($MILLION)
    TABLE 107. REST OF ASIA-PACIFIC AIR DEFENSE SYSTEMS MARKET, BY COMPONENT, 2021-2031 ($MILLION)
    TABLE 108. REST OF ASIA-PACIFIC AIR DEFENSE SYSTEMS MARKET, BY RANGE, 2021-2031 ($MILLION)
    TABLE 109. REST OF ASIA-PACIFIC AIR DEFENSE SYSTEMS MARKET, BY PLATFORM, 2021-2031 ($MILLION)
    TABLE 110. REST OF ASIA-PACIFIC AIR DEFENSE SYSTEMS MARKET, BY TYPE, 2021-2031 ($MILLION)
    TABLE 111. LAMEA AIR DEFENSE SYSTEMS MARKET, BY COMPONENT, 2021-2031 ($MILLION)
    TABLE 112. LAMEA AIR DEFENSE SYSTEMS MARKET, BY RANGE, 2021-2031 ($MILLION)
    TABLE 113. LAMEA AIR DEFENSE SYSTEMS MARKET, BY PLATFORM, 2021-2031 ($MILLION)
    TABLE 114. LAMEA AIR DEFENSE SYSTEMS MARKET, BY TYPE, 2021-2031 ($MILLION)
    TABLE 115. LAMEA AIR DEFENSE SYSTEMS MARKET, BY COUNTRY, 2021-2031 ($MILLION)
    TABLE 116. LATIN AMERICA AIR DEFENSE SYSTEMS MARKET, BY COMPONENT, 2021-2031 ($MILLION)
    TABLE 117. LATIN AMERICA AIR DEFENSE SYSTEMS MARKET, BY RANGE, 2021-2031 ($MILLION)
    TABLE 118. LATIN AMERICA AIR DEFENSE SYSTEMS MARKET, BY PLATFORM, 2021-2031 ($MILLION)
    TABLE 119. LATIN AMERICA AIR DEFENSE SYSTEMS MARKET, BY TYPE, 2021-2031 ($MILLION)
    TABLE 120. MIDDLE EAST AIR DEFENSE SYSTEMS MARKET, BY COMPONENT, 2021-2031 ($MILLION)
    TABLE 121. MIDDLE EAST AIR DEFENSE SYSTEMS MARKET, BY RANGE, 2021-2031 ($MILLION)
    TABLE 122. MIDDLE EAST AIR DEFENSE SYSTEMS MARKET, BY PLATFORM, 2021-2031 ($MILLION)
    TABLE 123. MIDDLE EAST AIR DEFENSE SYSTEMS MARKET, BY TYPE, 2021-2031 ($MILLION)
    TABLE 124. AFRICA AIR DEFENSE SYSTEMS MARKET, BY COMPONENT, 2021-2031 ($MILLION)
    TABLE 125. AFRICA AIR DEFENSE SYSTEMS MARKET, BY RANGE, 2021-2031 ($MILLION)
    TABLE 126. AFRICA AIR DEFENSE SYSTEMS MARKET, BY PLATFORM, 2021-2031 ($MILLION)
    TABLE 127. AFRICA AIR DEFENSE SYSTEMS MARKET, BY TYPE, 2021-2031 ($MILLION)
    TABLE 128.SAAB AB: COMPANY SNAPSHOT
    TABLE 129.SAAB AB: OPERATING SEGMENTS
    TABLE 130.SAAB AB: PRODUCT PORTFOLIO
    TABLE 131.SAAB AB: NET SALES,
    TABLE 132.SAAB AB: KEY STRATERGIES
    TABLE 133.LOCKHEED MARTIN CORPORATION: COMPANY SNAPSHOT
    TABLE 134.LOCKHEED MARTIN CORPORATION: OPERATING SEGMENTS
    TABLE 135.LOCKHEED MARTIN CORPORATION: PRODUCT PORTFOLIO
    TABLE 136.LOCKHEED MARTIN CORPORATION: NET SALES,
    TABLE 137.LOCKHEED MARTIN CORPORATION: KEY STRATERGIES
    TABLE 138.BAE SYSTEMS PLC: COMPANY SNAPSHOT
    TABLE 139.BAE SYSTEMS PLC: OPERATING SEGMENTS
    TABLE 140.BAE SYSTEMS PLC: PRODUCT PORTFOLIO
    TABLE 141.BAE SYSTEMS PLC: NET SALES,
    TABLE 142.BAE SYSTEMS PLC: KEY STRATERGIES
    TABLE 143.RHEINMETALL AG: COMPANY SNAPSHOT
    TABLE 144.RHEINMETALL AG: OPERATING SEGMENTS
    TABLE 145.RHEINMETALL AG: PRODUCT PORTFOLIO
    TABLE 146.RHEINMETALL AG: NET SALES,
    TABLE 147.RHEINMETALL AG: KEY STRATERGIES
    TABLE 148.THALES GROUP: COMPANY SNAPSHOT
    TABLE 149.THALES GROUP: OPERATING SEGMENTS
    TABLE 150.THALES GROUP: PRODUCT PORTFOLIO
    TABLE 151.THALES GROUP: NET SALES,
    TABLE 152.THALES GROUP: KEY STRATERGIES
    TABLE 153.KONGSBERG GRUPPEN: COMPANY SNAPSHOT
    TABLE 154.KONGSBERG GRUPPEN: OPERATING SEGMENTS
    TABLE 155.KONGSBERG GRUPPEN: PRODUCT PORTFOLIO
    TABLE 156.KONGSBERG GRUPPEN: NET SALES,
    TABLE 157.KONGSBERG GRUPPEN: KEY STRATERGIES
    TABLE 158.RAYTHEON TECHNOLOGIES: COMPANY SNAPSHOT
    TABLE 159.RAYTHEON TECHNOLOGIES: OPERATING SEGMENTS
    TABLE 160.RAYTHEON TECHNOLOGIES: PRODUCT PORTFOLIO
    TABLE 161.RAYTHEON TECHNOLOGIES: NET SALES,
    TABLE 162.RAYTHEON TECHNOLOGIES: KEY STRATERGIES
    TABLE 163.MBDA: COMPANY SNAPSHOT
    TABLE 164.MBDA: OPERATING SEGMENTS
    TABLE 165.MBDA: PRODUCT PORTFOLIO
    TABLE 166.MBDA: NET SALES,
    TABLE 167.MBDA: KEY STRATERGIES
    TABLE 168.NORTHROP GRUMMAN CORPORATION: COMPANY SNAPSHOT
    TABLE 169.NORTHROP GRUMMAN CORPORATION: OPERATING SEGMENTS
    TABLE 170.NORTHROP GRUMMAN CORPORATION: PRODUCT PORTFOLIO
    TABLE 171.NORTHROP GRUMMAN CORPORATION: NET SALES,
    TABLE 172.NORTHROP GRUMMAN CORPORATION: KEY STRATERGIES
    TABLE 173.BOEING: COMPANY SNAPSHOT
    TABLE 174.BOEING: OPERATING SEGMENTS
    TABLE 175.BOEING: PRODUCT PORTFOLIO
    TABLE 176.BOEING: NET SALES,
    TABLE 177.BOEING: KEY STRATERGIES
    TABLE 178.HANWHA CORPORATION: COMPANY SNAPSHOT
    TABLE 179.HANWHA CORPORATION: OPERATING SEGMENTS
    TABLE 180.HANWHA CORPORATION: PRODUCT PORTFOLIO
    TABLE 181.HANWHA CORPORATION: NET SALES,
    TABLE 182.HANWHA CORPORATION: KEY STRATERGIES
    TABLE 183.LEONARDO S.P.A.: COMPANY SNAPSHOT
    TABLE 184.LEONARDO S.P.A.: OPERATING SEGMENTS
    TABLE 185.LEONARDO S.P.A.: PRODUCT PORTFOLIO
    TABLE 186.LEONARDO S.P.A.: NET SALES,
    TABLE 187.LEONARDO S.P.A.: KEY STRATERGIES
    TABLE 188.AIRBUS DEFENSE AND SPACE: COMPANY SNAPSHOT
    TABLE 189.AIRBUS DEFENSE AND SPACE: OPERATING SEGMENTS
    TABLE 190.AIRBUS DEFENSE AND SPACE: PRODUCT PORTFOLIO
    TABLE 191.AIRBUS DEFENSE AND SPACE: NET SALES,
    TABLE 192.AIRBUS DEFENSE AND SPACE: KEY STRATERGIES
    TABLE 193.ELBIT SYSTEMS: COMPANY SNAPSHOT
    TABLE 194.ELBIT SYSTEMS: OPERATING SEGMENTS
    TABLE 195.ELBIT SYSTEMS: PRODUCT PORTFOLIO
    TABLE 196.ELBIT SYSTEMS: NET SALES,
    TABLE 197.ELBIT SYSTEMS: KEY STRATERGIES
    TABLE 198.GENERAL DYNAMICS: COMPANY SNAPSHOT
    TABLE 199.GENERAL DYNAMICS: OPERATING SEGMENTS
    TABLE 200.GENERAL DYNAMICS: PRODUCT PORTFOLIO
    TABLE 201.GENERAL DYNAMICS: NET SALES,
    TABLE 202.GENERAL DYNAMICS: KEY STRATERGIES
    TABLE 203.L3HARRIS TECHNOLOGIES: COMPANY SNAPSHOT
    TABLE 204.L3HARRIS TECHNOLOGIES: OPERATING SEGMENTS
    TABLE 205.L3HARRIS TECHNOLOGIES: PRODUCT PORTFOLIO
    TABLE 206.L3HARRIS TECHNOLOGIES: NET SALES,
    TABLE 207.L3HARRIS TECHNOLOGIES: KEY STRATERGIES
  • LIST OF FIGURES

  • FIGURE 1.AIR DEFENSE SYSTEMS MARKET SEGMENTATION
    FIGURE 2.AIR DEFENSE SYSTEMS MARKET,2021-2031
    FIGURE 3.AIR DEFENSE SYSTEMS MARKET,2021-2031
    FIGURE 4. TOP INVESTMENT POCKETS, BY REGION
    FIGURE 5.PORTER FIVE-1
    FIGURE 6.PORTER FIVE-2
    FIGURE 7.PORTER FIVE-3
    FIGURE 8.PORTER FIVE-4
    FIGURE 9.PORTER FIVE-5
    FIGURE 10.TOP PLAYER POSITIONING
    FIGURE 11.AIR DEFENSE SYSTEMS MARKET:DRIVERS, RESTRAINTS AND OPPORTUNITIES
    FIGURE 12.AIR DEFENSE SYSTEMS MARKET,BY COMPONENT,2021(%)
    FIGURE 13.COMPARATIVE SHARE ANALYSIS OF WEAPON SYSTEM AIR DEFENSE SYSTEMS MARKET,2021-2031(%)
    FIGURE 14.COMPARATIVE SHARE ANALYSIS OF FIRE CONTROL SYSTEM AIR DEFENSE SYSTEMS MARKET,2021-2031(%)
    FIGURE 15.COMPARATIVE SHARE ANALYSIS OF COMMAND AND CONTROL SYSTEM AIR DEFENSE SYSTEMS MARKET,2021-2031(%)
    FIGURE 16.COMPARATIVE SHARE ANALYSIS OF OTHERS AIR DEFENSE SYSTEMS MARKET,2021-2031(%)
    FIGURE 17.AIR DEFENSE SYSTEMS MARKET,BY RANGE,2021(%)
    FIGURE 18.COMPARATIVE SHARE ANALYSIS OF SHORT RANGE AIR DEFENSE SYSTEM AIR DEFENSE SYSTEMS MARKET,2021-2031(%)
    FIGURE 19.COMPARATIVE SHARE ANALYSIS OF MEDIUM RANGE AIR DEFENSE SYSTEM AIR DEFENSE SYSTEMS MARKET,2021-2031(%)
    FIGURE 20.COMPARATIVE SHARE ANALYSIS OF LONG RANGE AIR DEFENSE SYSTEM AIR DEFENSE SYSTEMS MARKET,2021-2031(%)
    FIGURE 21.AIR DEFENSE SYSTEMS MARKET,BY PLATFORM,2021(%)
    FIGURE 22.COMPARATIVE SHARE ANALYSIS OF GROUND AIR DEFENSE SYSTEMS MARKET,2021-2031(%)
    FIGURE 23.COMPARATIVE SHARE ANALYSIS OF AIRBORNE AIR DEFENSE SYSTEMS MARKET,2021-2031(%)
    FIGURE 24.COMPARATIVE SHARE ANALYSIS OF NAVAL AIR DEFENSE SYSTEMS MARKET,2021-2031(%)
    FIGURE 25.AIR DEFENSE SYSTEMS MARKET,BY TYPE,2021(%)
    FIGURE 26.COMPARATIVE SHARE ANALYSIS OF MISSILE DEFENSE SYSTEM AIR DEFENSE SYSTEMS MARKET,2021-2031(%)
    FIGURE 27.COMPARATIVE SHARE ANALYSIS OF ANTI-AIRCRAFT AIR DEFENSE SYSTEMS MARKET,2021-2031(%)
    FIGURE 28.COMPARATIVE SHARE ANALYSIS OF  COUNTER ROCKET, ARTILLERY, AND MORTAR SYSTEM AIR DEFENSE SYSTEMS MARKET,2021-2031(%)
    FIGURE 29.AIR DEFENSE SYSTEMS MARKET BY REGION,2021
    FIGURE 30.U.S. AIR DEFENSE SYSTEMS MARKET,2021-2031($MILLION)
    FIGURE 31.CANADA AIR DEFENSE SYSTEMS MARKET,2021-2031($MILLION)
    FIGURE 32.MEXICO AIR DEFENSE SYSTEMS MARKET,2021-2031($MILLION)
    FIGURE 33.UK AIR DEFENSE SYSTEMS MARKET,2021-2031($MILLION)
    FIGURE 34.GERMANY AIR DEFENSE SYSTEMS MARKET,2021-2031($MILLION)
    FIGURE 35.FRANCE AIR DEFENSE SYSTEMS MARKET,2021-2031($MILLION)
    FIGURE 36.RUSSIA AIR DEFENSE SYSTEMS MARKET,2021-2031($MILLION)
    FIGURE 37.ITALY AIR DEFENSE SYSTEMS MARKET,2021-2031($MILLION)
    FIGURE 38.SPAIN AIR DEFENSE SYSTEMS MARKET,2021-2031($MILLION)
    FIGURE 39.REST OF EUROPE AIR DEFENSE SYSTEMS MARKET,2021-2031($MILLION)
    FIGURE 40.CHINA AIR DEFENSE SYSTEMS MARKET,2021-2031($MILLION)
    FIGURE 41.INDIA AIR DEFENSE SYSTEMS MARKET,2021-2031($MILLION)
    FIGURE 42.JAPA AIR DEFENSE SYSTEMS MARKET,2021-2031($MILLION)
    FIGURE 43.AUSTRALIA AIR DEFENSE SYSTEMS MARKET,2021-2031($MILLION)
    FIGURE 44.SOUTH KOREA AIR DEFENSE SYSTEMS MARKET,2021-2031($MILLION)
    FIGURE 45.REST OF ASIA-PACIFIC AIR DEFENSE SYSTEMS MARKET,2021-2031($MILLION)
    FIGURE 46.LATIN AMERICA AIR DEFENSE SYSTEMS MARKET,2021-2031($MILLION)
    FIGURE 47.MIDDLE EAST AIR DEFENSE SYSTEMS MARKET,2021-2031($MILLION)
    FIGURE 48.AFRICA AIR DEFENSE SYSTEMS MARKET,2021-2031($MILLION)
    FIGURE 49. TOP WINNING STRATEGIES, BY YEAR
    FIGURE 50. TOP WINNING STRATEGIES, BY DEVELOPMENT
    FIGURE 51. TOP WINNING STRATEGIES, BY COMPANY
    FIGURE 52.PRODUCT MAPPING OF TOP 10 PLAYERS
    FIGURE 53.COMPETITIVE DASHBOARD
    FIGURE 54.COMPETITIVE HEATMAP OF TOP 10 KEY PLAYERS
    FIGURE 55.SAAB AB.: NET SALES ,($MILLION)
    FIGURE 56.LOCKHEED MARTIN CORPORATION.: NET SALES ,($MILLION)
    FIGURE 57.BAE SYSTEMS PLC.: NET SALES ,($MILLION)
    FIGURE 58.RHEINMETALL AG.: NET SALES ,($MILLION)
    FIGURE 59.THALES GROUP.: NET SALES ,($MILLION)
    FIGURE 60.KONGSBERG GRUPPEN.: NET SALES ,($MILLION)
    FIGURE 61.RAYTHEON TECHNOLOGIES.: NET SALES ,($MILLION)
    FIGURE 62.MBDA.: NET SALES ,($MILLION)
    FIGURE 63.NORTHROP GRUMMAN CORPORATION.: NET SALES ,($MILLION)
    FIGURE 64.BOEING.: NET SALES ,($MILLION)
    FIGURE 65.HANWHA CORPORATION.: NET SALES ,($MILLION)
    FIGURE 66.LEONARDO S.P.A..: NET SALES ,($MILLION)
    FIGURE 67.AIRBUS DEFENSE AND SPACE.: NET SALES ,($MILLION)
    FIGURE 68.ELBIT SYSTEMS.: NET SALES ,($MILLION)
    FIGURE 69.GENERAL DYNAMICS.: NET SALES ,($MILLION)
    FIGURE 70.L3HARRIS TECHNOLOGIES.: NET SALES ,($MILLION)


The air defense system market is expected to witness a significant growth rate owning to increase in defense budgets of nations across the globe and rising concerns of nations to protect themselves from conventional and modern threats. While the deployment of air defense systems is costly and requires large capital spending for its integration in a variety of platforms, increase in defense expenditure facilitates the implementation of expensive yet necessary missile defense system technologies. Furthermore, advancements of weapons and attacking capabilities globally have created the demand for modernization and installation of sophisticated defense technologies by governments to prevent threats and offensive attacks from foreign countries. Hence, increase in defense expenditure is expected to open new avenues for the growth of the air defense system market during the forecast period.

Also, adoption of internet of things (IoT) within the air defense system market is expected to change the business dynamics during the forecast period. One of the popular air defense systems is the Iron Dome. It is an artificial intelligence (AI)-powered anti-missile system that is reportedly 90% effective. The Iron Dome employs artificial intelligence to decide if the approaching wave of short-range rockets and missiles will strike the common people or the state's important assets. Unmanned Aerial Vehicles (UAVs), guided missiles, and cruise missiles are among the threats that the AI system identifies, analyzes, and ultimately obstructs. In addition, AI and machine learning (ML) could also be useful in analyzing a vast amount of missile testing-data. A typical testing of ground-based midcourse defense generates terabytes of data. Using AI can ease the processing of data and provide vital insights to improve the functioning of the missile defense system.

To fulfill the changing demand scenarios, market participants are concentrating on product launches to offer a diverse range of products and meet new business opportunities. In addition, market participants are continuously focusing on contracts and partnership efforts to match changing end-user requirements and improve the growth of the air defense system market.

Among the analyzed regions, North America is the highest revenue contributor, followed by Europe, Asia-Pacific, and LAMEA. Asia-Pacific is expected to witness highest growth rate during the forecast period, owing to increasing efforts of the Indian and Chinese governments to develop indigenous defense manufacturing infrastructure.

PURCHASE OPTIONS

Call or Email us

U.S.-Canada Toll-free: +1-800-792-5285
Int'l : +1-503-894-6022
Europe : +44-845-528-1300
Email : help@alliedmarketresearch.com
 
FREQUENTLY ASKED QUESTIONS?

A. The global air defense system market was valued at $46,197.4 million in 2021, and is projected to reach $78,194.0 million by 2031, registering a CAGR of 5.6% from 2022 to 2031.

A. The key players operating in the market are Saab AB, Lockheed Martin Corporation, BAE Systems PLC, Rheinmetall AG, Thales Group, Kongsberg Gruppen, Raytheon Technologies, MBDA, Northrop Grumman Corporation, Boeing, Hanwha Corporation, Leonardo S.P.A., Airbus Defense and Space, Aselsan A.S., Elbit Systems, and General Dynamics.
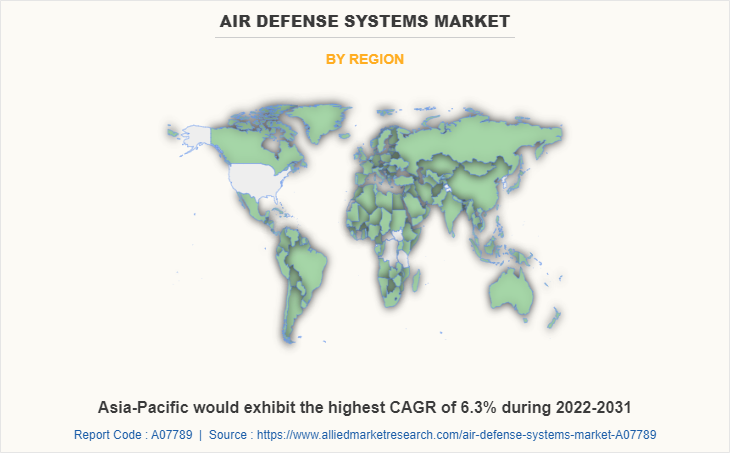
A. North America is the largest regional market for air defense system

A. Intercepting incoming aerial threats such as missiles, drones, or other aerial ammunition are among the major application of air defense system.

A. Integration of new systems and upgradation of existing air defense systems to improve interception rates are some of the major market trends.

Looking for Customization?

 Customization Request

Have a Question?

 Speak with Analyst

Any Confusion?

 Inquire Before Buying

Have a glance of the Report

  Request Sample
RELATED TAGS

Purchase Full Report of
Air Defense Systems Market

Start reading instantly.
This Report and over 66,804+ more Reports, Available with Avenue Library. T&C*.

  • Online Only
  • $3,570
  • Online cloud access only
  • Restricted print, copy, paste & download
  • Read only
  • Free industry update
    (Within 180 days)
  • Free report update in next update cycle
    (Oct 2023 - Oct 2024)
  • Data Pack
  • $3,840
  • Restricted to one authorized user
  • One print only
  • Available in
    Excel
  • Free industry update
    (Within 180 days)
  •   Free report update in next update cycle
    (Oct 2023 - Oct 2024)
  • Single User
  • $5,730
  • Restricted to one authorized user
  • One print only
  • Available in
    PDF
  • Free industry update
    (Within 180 days)
  •   Free report update in next update cycle
    (Oct 2023 - Oct 2024)
  • Five Users
  • $6,450
  • Limited to five authorized users
  • Print upto five copies
  • Available in
    PDF
  • Free industry update
    (Within 180 days)
  •   Free report update in next update cycle
    (Oct 2023 - Oct 2024)
  • Enterprise
    License/PDF

  • $9,600
  • Unlimited
    within
    company/enterprise
  • Available in Excel & PDF
  • Free industry update
    (Within 180 days)
  •   Free report update in next update cycle
    (Oct 2023 - Oct 2024)
  • Library
    Membership

  • $999 $ 1,175
    Per User/ Per month/ Billed annually
  • Published Content
    E-access
  • Company Profiles
    E-access
  • Newly Added Content Access
  • 10 PDF
    Downloads
  • 5 Excel Data
    Pack Downloads
  • 250 Company Profiles PDF Downloads
  • Buy Now

*Taxes/Fees, if applicable will be added during checkout. All prices in USD

RELATED REPORTS
 

Why Allied Market Research?


Infallible Methodology

To ensure high-level data integrity, accurate analysis, and impeccable forecasts

Analyst Support

For complete satisfaction

Customization

On-demand customization of scope of the report to exactly meet your needs

TARGETED MARKET VIEW

Targeted market view to provide pertinent information and save time of readers

Get fresh content delivered

Get insights on topics that are crucial for your business. Stay abreast of your interest areas.

Get Industry Data Alerts

Why Allied Market Research?

Infallible Methodology

To ensure high-level data integrity, accurate analysis, and impeccable forecasts

Analyst Support

For complete satisfaction

Customization

On-demand customization of scope of the report to exactly meet your needs

TARGETED MARKET VIEW

Targeted market view to provide pertinent information and save time of readers