Report Code: A05028 | Jul 2019 | Pages: 433 | ||
Tables: 245 | Charts: NA |
|
Pandemic disrupted the entire world and affected many industries.
Get detailed COVID-19 impact analysis on the Air Filtration Media Market
Request Now !The global air filtration media market size is expected to reach $5,347.6 million in 2026, from $3,573.0 million in 2018, growing at a CAGR of 5.0% from 2019 to 2026.
The air filtration media is a filter material, which removes and eliminates the dust particles, pollutants, and other particulate matters. These air filter media are made up of variety of materials such as non-woven polyester, glass fiber, activated carbon, and other materials. Different types of air filter media include fiberglass filter, polyester filters, pleated filters, washable filters, and disposable filters. These air filter media are used in air filters and purifiers for applications such as HVAC, face mask, air pollution control, industrial manufacturing, transportation, and others.
There is decrease in the quality of air across the globe due to factors such as industrialization and urbanization. Therefore, pollution has become a health problem globally. It is estimated that the majority of the population in the world is exposed to unsafe air as per the World Health Organization (WHO) guidelines. This high focus to curb pollution is expected to increase the demand for air filters, which in turn drives the demand for air filter media.
Air filters are of great importance to healthcare industry, wherein they are used across hospitals and pharmaceutical and biotechnology manufacturing. In hospitals, air which contains particulates can be harmful to patients, which can further deteriorate the patient health. In addition, unfiltered indoor air can transmit bacteria, infections, germs, and viruses, to patients which can be life threating. Moreover, there is a rise in awareness and sensitivity toward air pollution among the public. The increase in number of programs and campaigns by various institutions such as ClientEarth leads to an increase in awareness. Such awareness programs increase the level of knowledge among citizens, which promotes them to buy air filters. These factors are expected to drive the growth of the air filtration media market in the coming years.
However, in 2018, countries such as U.S., and Germany which are biggest consumers of coal has announced to shut down all 84 coal power plants over the next 19 years. In addition, there is a decline in the new construction of coal power plants. This reduced the demand for the air filters media used in power manufacturing sector, thereby restraining the air filtration media market growth during the forecast period.
Furthermore, the initial purchase price and operating cost of air filters are both high. For example, Heating, Ventilation, and Air Conditioning (HVAC) filters have the ability to remove high particulate matter, but these filters also create significant airflow resistance. This air flow resistance causes HVAC systems to require powerful fans to move air, which results in the consumption of a high amount of energy and CO2 emissions. This factor restricts the growth of the air filtration media market.
There are ample opportunities for companies to explore the nanotechnology to be used in air filter media which increases the benefits for the end consumers, which is expected to drive the growth of the air filtration media market in future.
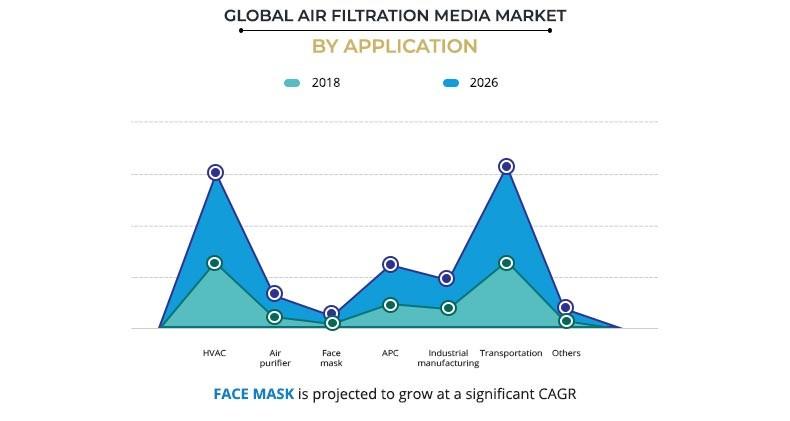
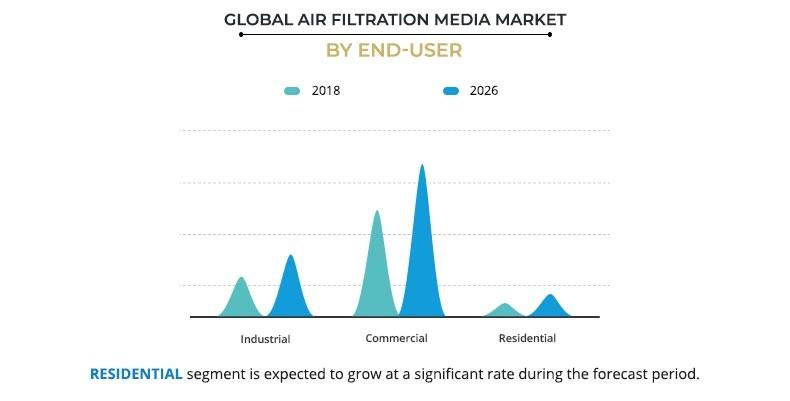
The global air filtration media is segmented based on end user, application, media type, usage, Rating, business, and region. Based on end user, it is classified into industrial, commercial, and residential. In 2018, the air filtration media market share is highest among the commercial segment, owing to the growth in commercial sector. Based on application, it is divided into HVAC, air purifier, face mask, air pollution control, industrial manufacturing, transportation, and others. In 2018, transportation segment contributed high revenue due to adoption of synthetic fibers such as polyurethane-based adhesive filter, and gasoline particulate filter by the various companies for controlling emission & air pollution.
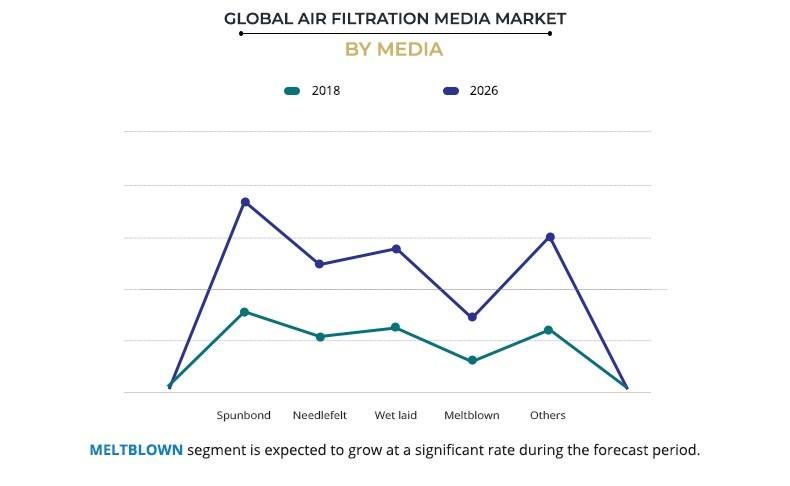
Based on media type, it is categorized into spunbond, needlefelt, wet laid, meltblown, and others. By usage, it is bifurcated as disposable and washable. Based on the rating, the air filtration media market is segmented as MERV, HEPA, ULPA, and others. By business, it is divided into OEM and aftermarket. Based on region, it is analyzed across North America, Europe, Asia-Pacific, and LAMEA.
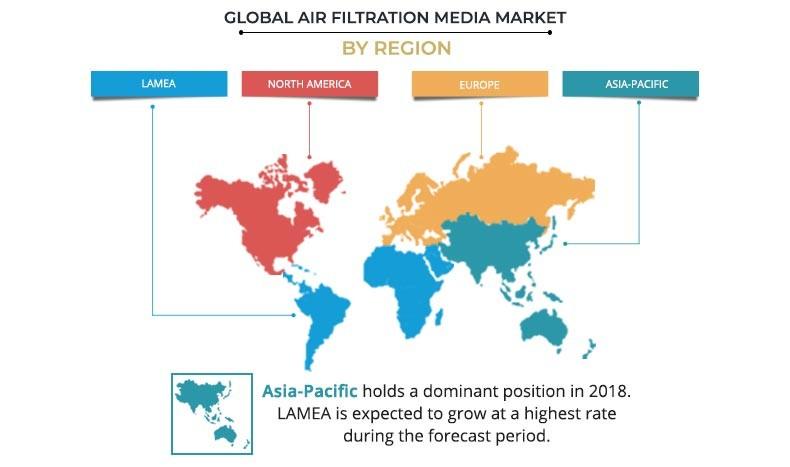
In 2018, Asia-Pacific has the largest share in global air filtration media market, owing to the emerging economies of the Asia-Pacific region such as China, India, South Korea, Vietnam, and others are witnessing rapid industrialization, which led to increase in adoption of air filter media for industrial application such as dehumidifiers, beverage dispensers, and ventilation.
Competition Analysis
The key market players profiled in the report of air filtration media market include 3M, Ahlstrom-Munksjo, AIM Nonwovens and Interiors Private Limited, Air filters, Inc., Berry, Cabot Corporation, Calgon Carbon Corporation, Clean & Science, Donaldson company, Inc., Elta Group, H&V, HVDS, Innovatec, Irema, Johns Manville, Lydall, P. H. Glatfelter Company, Permatron Corporation, Porvair Filtration Group, Sandler, Schweitzer-Mauduit International, Inc., Superior Felt And Filtration, LLC, and Toray
Many competitors in the air filtration media market adopted product launch, as their key developmental strategies to improve their product portfolio and sustain the intense competition. For instance, in November 2018, Ahlstrom-Munksjö Oyj launched Extia 1000 filtration media for air pollution control applications. The new filter media offers 40% more efficiency than the standard filter media. Similarly, in March 2018, Ahlstrom-Munksjö Oyj also launched Trinitex Advance W3200 filtration media, which is specifically designed for pulse jet gas turbine applications. It provides 30 times purer air and also provides protection of gas turbines from humid environments in the industry.
Air Filtration Media Market Report Highlights
Aspects | Details |
---|---|
By End-user |
|
By Application |
|
By Media |
|
By Usage |
|
By Rating |
|
By Business |
|
By Region |
|
Key Market Players | Superior Felt And Filtration, LLC, Ahlstrom-Munksjo, Porvair Filtration Group, DONALDSON COMPANY, INC, Schweitzer-Mauduit International, Inc., Calgon Carbon Corporation, Berry, Toray, Johns Manville, H&V, Irema, Elta Group, Lydall, Permatron Corporation, P. H. Glatfelter Company, Sandler, Clean & Science, 3M, AIM Nonwovens And Interiors Private Limited, Cabot Corporation, Innovatec, HVDS, Air filters, Inc. |
CHAPTER 1:Â Â Â INTRODUCTION
1.1.   Report description
1.2.   Key benefits for stakeholders
1.3.   Key market segments
1.4.   Research methodology
1.4.1.   Primary research
1.4.2.   Secondary research
1.4.3.   Analyst tools and models
CHAPTER 2:Â Â Â EXECUTIVE SUMMARY
2.1.   CXO perspective
CHAPTER 3:Â Â Â MARKET OVERVIEW
3.1.   Market definition and scope
3.2.   Key Findings
3.2.1.   Top Investment Pockets
3.2.2.   Top Winning Strategies
3.3.   Porter's five forces analysis
3.4.   Market share analysis of top players, 2018 (%)
3.5.   Market dynamics
3.5.1.   Drivers
3.5.1.1.   Degradation of air quality to increase focus on curbing air pollution
3.5.1.2.   Rise in demand for air filters in healthcare industry
3.5.1.3.   Increase in awareness and sensitivity toward air pollution
3.5.2.   Restraints
3.5.2.1.   High capital and operating cost
3.5.2.2.   Decline in number of new coal power plants
3.5.3.   Opportunity
3.5.3.1.   High focus on nanotechnology for air filtration
3.6.   List of potential customers
CHAPTER 4:Â Â Â AIR FILTRATION MEDIA MARKET, BY END USER
4.1.   Overview
4.1.1.   Market size and forecast, by end-user industry
4.2.   Industrial
4.2.1.   Key market trends, growth factors and opportunities
4.2.2.   Market size and forecast, by region
4.2.3.   Market analysis by country
4.3.   Commercial
4.3.1.   Key market trends, growth factors and opportunities
4.3.2.   Market size and forecast, by region
4.3.3.   Market analysis by country
4.4.   Residential
4.4.1.   Key market trends, growth factors and opportunities
4.4.2.   Market size and forecast, by region
4.4.3.   Market analysis by country
CHAPTER 5:Â Â Â AIR FILTRATION MEDIA MARKET, BY APPLICATION
5.1.   Overview
5.1.1.   Market size and forecast, by application
5.2.   HVAC
5.2.1.   Key market trends, growth factors and opportunities
5.2.2.   Market size and forecast, by region
5.2.3.   Market analysis by country
5.2.4.   Market size and forecast, by media
5.3.   Air purifier
5.3.1.   Key market trends, growth factors and opportunities
5.3.2.   Market size and forecast, by region
5.3.3.   Market analysis by country
5.3.4.   Market size and forecast, by media
5.4.   Face mask
5.4.1.   Key market trends, growth factors and opportunities
5.4.2.   Market size and forecast, by region
5.4.3.   Market analysis by country
5.4.4.   Market size and forecast, by media
5.5.   Air pollution control (APC)
5.5.1.   Key market trends, growth factors and opportunities
5.5.2.   Market size and forecast, by region
5.5.3.   Market analysis by country
5.5.4.   Market size and forecast, by media
5.6.   Industrial manufacturing
5.6.1.   Key market trends, growth factors and opportunities
5.6.2.   Market size and forecast, by region
5.6.3.   Market analysis by country
5.6.4.   Market size and forecast, by media
5.7.   Transportation
5.7.1.   Key market trends, growth factors and opportunities
5.7.2.   Market size and forecast, by region
5.7.3.   Market analysis by country
5.7.4.   Market size and forecast, by media
5.8.   Others
5.8.1.   Key market trends, growth factors and opportunities
5.8.2.   Market size and forecast, by region
5.8.3.   Market analysis by country
5.8.4.   Market size and forecast by media
CHAPTER 6:Â Â Â AIR FILTRATION MEDIA MARKET, BY MEDIA TYPE
6.1.   Overview
6.1.1.   Market size and forecast, by media type
6.2.   Spunbond
6.2.1.   Key market trends, growth factors and opportunities
6.2.2.   Market size and forecast, by region
6.2.3.   Market size and forecast, by country
6.3.   Needlefelt
6.3.1.   Key market trends, growth factors and opportunities
6.3.2.   Market size and forecast, by region
6.3.3.   Market analysis by country
6.4.   Wet Laid
6.4.1.   Key market trends, growth factors and opportunities
6.4.2.   Market size and forecast, by region
6.4.3.   Market analysis by country
6.5.   Meltblown
6.5.1.   Key market trends, growth factors and opportunities
6.5.2.   Market size and forecast, by region
6.5.3.   Market analysis by country
6.6.   Others
6.6.1.   Key market trends, growth factors and opportunities
6.6.2.   Market size and forecast, by region
6.6.3.   Market analysis by country
CHAPTER 7:Â Â Â AIR FILTRATION MEDIA MARKET, BY USAGE
7.1.   Overview
7.1.1.   Market size and forecast, by usage
7.2.   Disposable
7.2.1.   Key market trends, growth factors and opportunities
7.2.2.   Market size and forecast, by region
7.2.3.   Market analysis by country
7.3.   Washable
7.3.1.   Key market trends, growth factors and opportunities
7.3.2.   Market size and forecast, by region
7.3.3.   Market analysis by country
CHAPTER 8:Â Â Â AIR FILTRATION MEDIA MARKET, BY RATING
8.1.   Overview
8.1.1.   Market size and forecast, by Rating
8.2.   MERV
8.2.1.   Key market trends, growth factors and opportunities
8.2.2.   Market size and forecast, by region
8.2.3.   Market analysis by country
8.3.   HEPA
8.3.1.   Key market trends, growth factors and opportunities
8.3.2.   Market size and forecast, by region
8.3.3.   Market analysis by country
8.4.   ULPA
8.4.1.   Key market trends, growth factors and opportunities
8.4.2.   Market size and forecast, by region
8.4.3.   Market analysis by country
8.5.   Others
8.5.1.   Key market trends, growth factors and opportunities
8.5.2.   Market size and forecast, by region
8.5.3.   Market analysis by country
CHAPTER 9:Â Â Â AIR FILTRATION MEDIA MARKET, BY BUSINESS TYPE
9.1.   Overview
9.1.1.   Market size and forecast, by Business type
9.2.   OEM
9.2.1.   Key market trends, growth factors and opportunities
9.2.2.   Market size and forecast, by region
9.2.3.   Market analysis by country
9.3.   Aftermarket
9.3.1.   Key market trends, growth factors and opportunities
9.3.2.   Market size and forecast, by region
9.3.3.   Market analysis by country
CHAPTER 10:Â Â Â AIR FILTRATION MEDIA MARKET, BY REGION
10.1.   Overview
10.1.1.   Market size and forecast, by region
10.2.   North America
10.2.1.   Key market trends, growth factors and opportunities
10.2.2.   Market size and forecast, by end-user
10.2.3.   Market size and forecast, by application
10.2.4.   Market size and forecast, by media
10.2.5.   Market size and forecast, by usage
10.2.6.   Market size and forecast, by Rating
10.2.7.   Market size and forecast, by business
10.2.8.   Market analysis by country
10.2.8.1.   U.S.
10.2.8.1.1.   Market size and forecast, by end user
10.2.8.1.2.   Market size and forecast, by application
10.2.8.1.3.   Market size and forecast, by media
10.2.8.1.4.   Market size and forecast, by usage
10.2.8.1.5.   Market size and forecast, by Rating
10.2.8.1.6.   Market size and forecast, by business
10.2.8.2.   Canada
10.2.8.2.1.   Market size and forecast, by end user
10.2.8.2.2.   Market size and forecast, by application
10.2.8.2.3.   Market size and forecast, by media
10.2.8.2.4.   Market size and forecast, by usage
10.2.8.2.5.   Market size and forecast, by Rating
10.2.8.2.6.   Market size and forecast, by business
10.2.8.3.   Mexico
10.2.8.3.1.   Market size and forecast, by end user
10.2.8.3.2.   Market size and forecast, by application
10.2.8.3.3.   Market size and forecast, by media
10.2.8.3.4.   Market size and forecast, by usage
10.2.8.3.5.   Market size and forecast, by Rating
10.2.8.3.6.   Market size and forecast, by business
10.3.   Europe
10.3.1.   Key market trends, growth factors and opportunities
10.3.2.   Market size and forecast, by end-user
10.3.3.   Market size and forecast, by application
10.3.4.   Market size and forecast, by media
10.3.5.   Market size and forecast, by usage
10.3.6.   Market size and forecast, by Rating
10.3.7.   Market size and forecast, by business
10.3.8.   Market analysis by country
10.3.8.1.   Germany
10.3.8.1.1.   Market size and forecast, by end user
10.3.8.1.2.   Market size and forecast, by application
10.3.8.1.3.   Market size and forecast, by media
10.3.8.1.4.   Market size and forecast, by usage
10.3.8.1.5.   Market size and forecast, by Rating
10.3.8.1.6.   Market size and forecast, by business
10.3.8.2.   France
10.3.8.2.1.   Market size and forecast, by end user
10.3.8.2.2.   Market size and forecast, by application
10.3.8.2.3.   Market size and forecast, by media
10.3.8.2.4.   Market size and forecast, by usage
10.3.8.2.5.   Market size and forecast, by Rating
10.3.8.2.6.   Market size and forecast, by business
10.3.8.3.   UK
10.3.8.3.1.   Market size and forecast, by end user
10.3.8.3.2.   Market size and forecast, by application
10.3.8.3.3.   Market size and forecast, by media
10.3.8.3.4.   Market size and forecast, by usage
10.3.8.3.5.   Market size and forecast, by Rating
10.3.8.3.6.   Market size and forecast, by business
10.3.8.4.   Italy
10.3.8.4.1.   Market size and forecast, by end user
10.3.8.4.2.   Market size and forecast, by application
10.3.8.4.3.   Market size and forecast, by media
10.3.8.4.4.   Market size and forecast, by usage
10.3.8.4.5.   Market size and forecast, by Rating
10.3.8.4.6.   Market size and forecast, by business
10.3.8.5.   Russia
10.3.8.5.1.   Market size and forecast, by end user
10.3.8.5.2.   Market size and forecast, by application
10.3.8.5.3.   Market size and forecast, by media
10.3.8.5.4.   Market size and forecast, by usage
10.3.8.5.5.   Market size and forecast, by Rating
10.3.8.5.6.   Market size and forecast, by business
10.3.8.6.   Rest of Europe
10.3.8.6.1.   Market size and forecast, by end user
10.3.8.6.2.   Market size and forecast, by application
10.3.8.6.3.   Market size and forecast, by media
10.3.8.6.4.   Market size and forecast, by usage
10.3.8.6.5.   Market size and forecast, by Rating
10.3.8.6.6.   Market size and forecast, by business
10.4.   Asia-Pacific
10.4.1.   Key market trends, growth factors and opportunities
10.4.2.   Market size and forecast, by end-user
10.4.3.   Market size and forecast, by application
10.4.4.   Market size and forecast, by media
10.4.5.   Market size and forecast, by usage
10.4.6.   Market size and forecast, by Rating
10.4.7.   Market size and forecast, by business
10.4.8.   Market analysis by country
10.4.8.1.   Japan
10.4.8.1.1.   Market size and forecast, by end user
10.4.8.1.2.   Market size and forecast, by application
10.4.8.1.3.   Market size and forecast, by media
10.4.8.1.4.   Market size and forecast, by usage
10.4.8.1.5.   Market size and forecast, by Rating
10.4.8.1.6.   Market size and forecast, by business
10.4.8.2.   China
10.4.8.2.1.   Market size and forecast, by end user
10.4.8.2.2.   Market size and forecast, by application
10.4.8.2.3.   Market size and forecast, by media
10.4.8.2.4.   Market size and forecast, by usage
10.4.8.2.5.   Market size and forecast, by Rating
10.4.8.2.6.   Market size and forecast, by business
10.4.8.3.   India
10.4.8.3.1.   Market size and forecast, by end user
10.4.8.3.2.   Market size and forecast, by application
10.4.8.3.3.   Market size and forecast, by media
10.4.8.3.4.   Market size and forecast, by usage
10.4.8.3.5.   Market size and forecast, by Rating
10.4.8.3.6.   Market size and forecast, by business
10.4.8.4.   South Korea
10.4.8.4.1.   Market size and forecast, by end user
10.4.8.4.2.   Market size and forecast, by application
10.4.8.4.3.   Market size and forecast, by media
10.4.8.4.4.   Market size and forecast, by usage
10.4.8.4.5.   Market size and forecast, by Rating
10.4.8.4.6.   Market size and forecast, by business
10.4.8.5.   Singapore
10.4.8.5.1.   Market size and forecast, by end user
10.4.8.5.2.   Market size and forecast, by application
10.4.8.5.3.   Market size and forecast, by media
10.4.8.5.4.   Market size and forecast, by usage
10.4.8.5.5.   Market size and forecast, by Rating
10.4.8.5.6.   Market size and forecast, by business
10.4.8.6.   Rest of Asia-Pacific
10.4.8.6.1.   Market size and forecast, by end user
10.4.8.6.2.   Market size and forecast, by application
10.4.8.6.3.   Market size and forecast, by media
10.4.8.6.4.   Market size and forecast, by usage
10.4.8.6.5.   Market size and forecast, by Rating
10.4.8.6.6.   Market size and forecast, by business
10.5.   LAMEA
10.5.1.   Key market trends, growth factors and opportunities
10.5.2.   Market size and forecast, by end-user
10.5.3.   Market size and forecast, by application
10.5.4.   Market size and forecast, by media
10.5.5.   Market size and forecast, by usage
10.5.6.   Market size and forecast, by Rating
10.5.7.   Market size and forecast, by business
10.5.8.   Market analysis by country
10.5.8.1.   Latin America
10.5.8.1.1.   Market size and forecast, by end user
10.5.8.1.2.   Market size and forecast, by application
10.5.8.1.3.   Market size and forecast, by media
10.5.8.1.4.   Market size and forecast, by usage
10.5.8.1.5.   Market size and forecast, by Rating
10.5.8.1.6.   Market size and forecast, by business
10.5.8.2.   Middle East
10.5.8.2.1.   Market size and forecast, by end user
10.5.8.2.2.   Market size and forecast, by application
10.5.8.2.3.   Market size and forecast, by media
10.5.8.2.4.   Market size and forecast, by usage
10.5.8.2.5.   Market size and forecast, by rating
10.5.8.2.6.   Market size and forecast, by business
10.5.8.3.   Africa
10.5.8.3.1.   Market size and forecast, by end user
10.5.8.3.2.   Market size and forecast, by application
10.5.8.3.3.   Market size and forecast, by media
10.5.8.3.4.   Market size and forecast, by usage
10.5.8.3.5.   Market size and forecast, by rating
10.5.8.3.6.   Market size and forecast, by business
CHAPTER 11:Â Â Â COMPANY PROFILES
11.1.   3M
11.1.1.   Company overview
11.1.2.   Key Executives
11.1.3.   Company snapshot
11.1.4.   Operating business segments
11.1.5.   Product portfolio
11.1.6.   R&D Expenditure
11.1.7.   Business performance
11.1.8.   Key strategic moves and developments
11.2.   AHLSTROM-MUNKSJÖ OYJ
11.2.1.   Company overview
11.2.2.   Key Executives
11.2.3.   Company snapshot
11.2.4.   Operating business segments
11.2.5.   Product portfolio
11.2.6.   R&D Expenditure
11.2.7.   Business performance
11.2.8.   Key strategic moves and developments
11.3.   AIM NONWOVENS AND INTERIORS PRIVATE LIMITED
11.3.1.   Company overview
11.3.2.   Key Executives
11.3.3.   Company snapshot
11.3.4.   Product portfolio
11.4.   AIR FILTERS INC.
11.4.1.   Company overview
11.4.2.   Key Executives
11.4.3.   Company snapshot
11.4.4.   Product portfolio
11.5.   BERRY GLOBAL GROUP INC.
11.5.1.   Company overview
11.5.2.   Key Executives
11.5.3.   Company snapshot
11.5.4.   Operating business segments
11.5.5.   Product portfolio
11.5.6.   R&D Expenditure
11.5.7.   Business performance
11.6.   CABOT CORPORATION
11.6.1.   Company overview
11.6.2.   Key Executives
11.6.3.   Company snapshot
11.6.4.   Operating business segments
11.6.5.   Product portfolio
11.6.6.   R&D Expenditure
11.6.7.   Business performance
11.6.8.   Key strategic moves and developments
11.7.   CALGON CARBON CORPORATION
11.7.1.   Company overview
11.7.2.   Key Executives
11.7.3.   Company snapshot
11.7.4.   Product portfolio
11.7.5.   Key strategic moves and developments
11.8.   CEREX ADVANCED FABRICS, INC.
11.8.1.   Company overview
11.8.2.   Company snapshot
11.8.3.   Product portfolio
11.9.   CLEAN & SCIENCE CO., LTD.
11.9.1.   Company overview
11.9.2.   Key Executives
11.9.3.   Company snapshot
11.9.4.   Product portfolio
11.10.   DONALDSON COMPANY, INC.
11.10.1.   Company overview
11.10.2.   Key Executives
11.10.3.   Company snapshot
11.10.4.   Operating business segments
11.10.5.   Product portfolio
11.10.6.   R&D Expenditure
11.10.7.   Business performance
11.10.8.   Key strategic moves and developments
11.11.   ELTA GROUP
11.11.1.   Company overview
11.11.2.   Key Executives
11.11.3.   Company snapshot
11.11.4.   Product portfolio
11.12.   HOLLINGSWORTH AND VOSE (H&V)
11.12.1.   Company overview
11.12.2.   Key Executives
11.12.3.   Company snapshot
11.12.4.   Product portfolio
11.13.   HVDS
11.13.1.   Company overview
11.13.2.   Key Executives
11.13.3.   Company snapshot
11.13.4.   Product portfolio
11.14.   INNOVATEC MICROFIBRE TECHNOLOGY GmbH & CO.
11.14.1.   Company overview
11.14.2.   Key Executives
11.14.3.   Company snapshot
11.14.4.   Product portfolio
11.15.   IREMA-FILTER GMBH
11.15.1.   Company overview
11.15.2.   Key Executives
11.15.3.   Company snapshot
11.15.4.   Product portfolio
11.16.   JOHNS MANVILLE
11.16.1.   Company overview
11.16.2.   Key Executives
11.16.3.   Company snapshot
11.16.4.   Product portfolio
11.16.5.   Key strategic moves and developments
11.17.   LYDALL, INC.
11.17.1.   Company overview
11.17.2.   Key Executives
11.17.3.   Company snapshot
11.17.4.   Operating business segments
11.17.5.   Product portfolio
11.17.6.   R&D Expenditure
11.17.7.   Business performance
11.17.8.   Key strategic moves and developments
11.18.   PERMATRON CORPORATION
11.18.1.   Company overview
11.18.2.   Key Executives
11.18.3.   Company snapshot
11.18.4.   Product portfolio
11.19.   PORVAIR PLC
11.19.1.   Company overview
11.19.2.   Key Executives
11.19.3.   Company snapshot
11.19.4.   Operating business segments
11.19.5.   Product portfolio
11.19.6.   R&D Expenditure
11.19.7.   Business performance
11.19.8.   Key strategic moves and developments
11.20.   SANDLER AG
11.20.1.   Company overview
11.20.2.   Key Executives
11.20.3.   Company snapshot
11.20.4.   Product portfolio
11.21.   SCHWEITZER-MAUDUIT INTERNATIONAL, INC.
11.21.1.   Company overview
11.21.2.   Key Executives
11.21.3.   Company snapshot
11.21.4.   Operating business segments
11.21.5.   Product portfolio
11.21.6.   R&D Expenditure
11.21.7.   Business performance
11.22.   SUPERIOR FELT & FILTRATION, LLC
11.22.1.   Company overview
11.22.2.   Key Executives
11.22.3.   Company snapshot
11.22.4.   Product portfolio
11.23.   TORAY INDUSTRIES, INC.
11.23.1.   Company overview
11.23.2.   Key Executives
11.23.3.   Company snapshot
11.23.4.   Operating business segments
11.23.5.   Product portfolio
11.23.6.   R&D Expenditure
11.23.7.   Business performance
11.23.8.   Key strategic moves and developments
LIST OF TABLES
TABLE 01.   GLOBAL AIR FILTRATION MEDIA MARKET REVENUE, BY END USER, 2018-2026 ($MILLION)
TABLE 02.   AIR FILTRATION MEDIA MARKET REVENUE FOR INDUSTRIAL, BY REGION 2018–2026($MILLION)
TABLE 03.   AIR FILTRATION MEDIA MARKET REVENUE FOR COMMERICIAL, BY REGION 2018–2026($MILLION)
TABLE 04.   AIR FILTRATION MEDIA MARKET REVENUE FOR RESIDENTIAL, BY REGION 2018–2026($MILLION)
TABLE 05.   GLOBAL AIR FILTRATION MEDIA MARKET REVENUE, BY APPLICATION, 2018-2026 ($MILLION)
TABLE 06.   AIR FILTRATION MEDIA MARKET REVENUE FOR HVAC, BY REGION 2018–2026($MILLION)
TABLE 07.   GLOBAL AIR FILTRATION MEDIA MARKET REVENUE FOR HVAC BY MEDIA, 2018-2026 ($MILLION)
TABLE 08.   AIR FILTRATION MEDIA MARKET REVENUE FOR AIR PURIFIER, BY REGION 2018–2026($MILLION)
TABLE 09.   GLOBAL AIR FILTRATION MEDIA MARKET REVENUE FOR AIR PURIFIER BY MEDIA, 2018-2026 ($MILLION)
TABLE 10.   AIR FILTRATION MEDIA MARKET REVENUE FOR FACE MASK, BY REGION 2018–2026($MILLION)
TABLE 11.   GLOBAL AIR FILTRATION MEDIA MARKET REVENUE FOR FACE MASK BY MEDIA, 2018-2026 ($MILLION)
TABLE 12.   AIR FILTRATION MEDIA MARKET REVENUE FOR AIR POLLUTION CONTROL (APC), BY REGION 2018–2026($MILLION)
TABLE 13.   GLOBAL AIR FILTRATION MEDIA MARKET REVENUE FOR AIR POLLUTION CONTROL BY MEDIA, 2018-2026 ($MILLION)
TABLE 14.   AIR FILTRATION MEDIA MARKET REVENUE FOR INDUSTRIAL MANUFACTURING, BY REGION 2018–2026($MILLION)
TABLE 15.   GLOBAL AIR FILTRATION MEDIA MARKET REVENUE FOR INDUSTRIAL MANUFACTURING BY MEDIA, 2018-2026 ($MILLION)
TABLE 16.   AIR FILTRATION MEDIA MARKET REVENUE FOR TRANSPORTATION, BY REGION 2018–2026($MILLION)
TABLE 17.   GLOBAL AIR FILTRATION MEDIA MARKET REVENUE FOR TRANSPORTATION, BY MEDIA, 2018-2026 ($MILLION)
TABLE 18.   AIR FILTRATION MEDIA MARKET REVENUE FOR OTHERS, BY REGION 2018–2026($MILLION)
TABLE 19.   GLOBAL AIR FILTRATION MEDIA MARKET REVENUE FOR OTHERS BY MEDIA, 2018-2026 ($MILLION)
TABLE 20.   GLOBAL AIR FILTRATION MEDIA MARKET REVENUE, BY MEDIA, 2018-2026 ($MILLION)
TABLE 21.   AIR FILTRATION MEDIA MARKET REVENUE FOR SPUNBOND, BY REGION 2018–2026($MILLION)
TABLE 22.   AIR FILTRATION MEDIA MARKET REVENUE FOR NEEDLEFELT, BY REGION 2018–2026($MILLION)
TABLE 23.   AIR FILTRATION MEDIA MARKET REVENUE FOR WET LAID, BY REGION 2018–2026($MILLION)
TABLE 24.   AIR FILTRATION MEDIA MARKET REVENUE FOR MELTBLOWN, BY REGION 2018–2026($MILLION)
TABLE 25.   AIR FILTRATION MEDIA MARKET REVENUE FOR OTHERS, BY REGION 2018–2026($MILLION)
TABLE 26.   GLOBAL AIR FILTRATION MEDIA MARKET REVENUE, BY USAGE, 2018-2026 ($MILLION)
TABLE 27.   AIR FILTRATION MEDIA MARKET REVENUE FOR DISPOSABLE, BY REGION 2018–2026($MILLION)
TABLE 28.   AIR FILTRATION MEDIA MARKET REVENUE FOR WASHABLE, BY REGION 2018–2026($MILLION)
TABLE 29.   GLOBAL AIR FILTRATION MEDIA MARKET REVENUE, BY RATING, 2018-2026 ($MILLION)
TABLE 30.   AIR FILTRATION MEDIA MARKET REVENUE FOR MERV, BY REGION 2018–2026($MILLION)
TABLE 31.   AIR FILTRATION MEDIA MARKET REVENUE FOR HEPA , BY REGION 2018–2026($MILLION)
TABLE 32.   AIR FILTRATION MEDIA MARKET REVENUE FOR ULPA, BY REGION 2018–2026($MILLION)
TABLE 33.   AIR FILTRATION MEDIA MARKET REVENUE FOR OTHERS, BY REGION 2018–2026($MILLION)
TABLE 34.   GLOBAL AIR FILTRATION MEDIA MARKET REVENUE, BUSINESS TYPE, 2018-2026 ($MILLION)
TABLE 35.   AIR FILTRATION MEDIA MARKET REVENUE FOR OEM, BY REGION 2018–2026($MILLION)
TABLE 36.   AIR FILTRATION MEDIA MARKET REVENUE FOR AFTERMARKET, BY REGION 2018–2026($MILLION)
TABLE 37.   NORTH AMERICA AIR FILTRATION MEDIA MARKET REVENUE, BY END-USER 2018–2026($MILLION)
TABLE 38.   NORTH AMERICA AIR FILTRATION MEDIA MARKET REVENUE, BY APPLICATION 2018–2026($MILLION)
TABLE 39.   NORTH AMERICA AIR FILTRATION MEDIA MARKET REVENUE, BY MEDIA, 2018–2026($MILLION)
TABLE 40.   NORTH AMERICA AIR FILTRATION MEDIA MARKET REVENUE, BY USAGE, 2018–2026($MILLION)
TABLE 41.   NORTH AMERICA AIR FILTRATION MEDIA MARKET REVENUE, BY RATING 2018–2026($MILLION)
TABLE 42.   NORTH AMERICA AIR FILTRATION MEDIA MARKET REVENUE, BY BUSINESS 2018–2026($MILLION)
TABLE 43.   U.S.AIR FILTRATION MEDIA MARKET REVENUE, BY END USER 2018–2026($MILLION)
TABLE 44.   U.S. AIR FILTRATION MEDIA MARKET REVENUE, BY APPLICATION 2018–2026($MILLION)
TABLE 45.   U.S.AIR FILTRATION MEDIA MARKET REVENUE, BY MEDIA 2018–2026($MILLION)
TABLE 46.   U.S.AIR FILTRATION MEDIA MARKET REVENUE, BY USAGE, 2018–2026($MILLION)
TABLE 47.   U.S. AIR FILTRATION MEDIA MARKET REVENUE, BY RATING 2018–2026($MILLION)
TABLE 48.   U.S. AIR FILTRATION MEDIA MARKET REVENUE, BY BUSINESS 2018–2026($MILLION)
TABLE 49.   CANADA AIR FILTRATION MEDIA MARKET REVENUE, BY END USER 2018–2026($MILLION)
TABLE 50.   CANADA AIR FILTRATION MEDIA MARKET REVENUE, BY APPLICATION 2018–2026($MILLION)
TABLE 51.   CANADA AIR FILTRATION MEDIA MARKET REVENUE, BY MEDIA 2018–2026($MILLION)
TABLE 52.   CANADA AIR FILTRATION MEDIA MARKET REVENUE, BY USAGE, 2018–2026($MILLION)
TABLE 53.   CANADA AIR FILTRATION MEDIA MARKET REVENUE, BY RATING 2018–2026($MILLION)
TABLE 54.   CANADA AIR FILTRATION MEDIA MARKET REVENUE, BY BUSINESS 2018–2026($MILLION)
TABLE 55.   MEXICO AIR FILTRATION MEDIA MARKET REVENUE, BY END USER 2018–2026($MILLION)
TABLE 56.   MEXICO AIR FILTRATION MEDIA MARKET REVENUE, BY APPLICATION 2018–2026($MILLION)
TABLE 57.   MEXICO AIR FILTRATION MEDIA MARKET REVENUE, BY MEDIA 2018–2026($MILLION)
TABLE 58.   MEXICO AIR FILTRATION MEDIA MARKET REVENUE, BY USAGE, 2018–2026($MILLION)
TABLE 59.   MEXICO AIR FILTRATION MEDIA MARKET REVENUE, BY RATING 2018–2026($MILLION)
TABLE 60.   MEXICO AIR FILTRATION MEDIA MARKET REVENUE, BY BUSINESS 2018–2026($MILLION)
TABLE 61.   EUROPE AIR FILTRATION MEDIA MARKET REVENUE, BY END-USER 2018–2026($MILLION)
TABLE 62.   EUROPE AIR FILTRATION MEDIA MARKET REVENUE, BY APPLICATION 2018–2026($MILLION)
TABLE 63.   EUROPE AIR FILTRATION MEDIA MARKET REVENUE, BY MEDIA, 2018–2026($MILLION)
TABLE 64.   EUROPE AIR FILTRATION MEDIA MARKET REVENUE, BY USAGE, 2018–2026($MILLION)
TABLE 65.   EUROPE AIR FILTRATION MEDIA MARKET REVENUE, BY RATING 2018–2026($MILLION)
TABLE 66.   EUROPE AIR FILTRATION MEDIA MARKET REVENUE, BY BUSINESS 2018–2026($MILLION)
TABLE 67.   GERMANY AIR FILTRATION MEDIA MARKET REVENUE, BY END USER 2018–2026($MILLION)
TABLE 68.   GERMANY AIR FILTRATION MEDIA MARKET REVENUE, BY APPLICATION 2018–2026($MILLION)
TABLE 69.   GERMANY AIR FILTRATION MEDIA MARKET REVENUE, BY MEDIA 2018–2026($MILLION)
TABLE 70.   GERMANY AIR FILTRATION MEDIA MARKET REVENUE, BY USAGE, 2018–2026($MILLION)
TABLE 71.   GERMANY AIR FILTRATION MEDIA MARKET REVENUE, BY RATING 2018–2026($MILLION)
TABLE 72.   GERMANY AIR FILTRATION MEDIA MARKET REVENUE, BY BUSINESS 2018–2026($MILLION)
TABLE 73.   FRANCE AIR FILTRATION MEDIA MARKET REVENUE, BY END USER 2018–2026($MILLION)
TABLE 74.   FRANCE AIR FILTRATION MEDIA MARKET REVENUE, BY APPLICATION 2018–2026($MILLION)
TABLE 75.   FRANCE AIR FILTRATION MEDIA MARKET REVENUE, BY MEDIA 2018–2026($MILLION)
TABLE 76.   FRANCE AIR FILTRATION MEDIA MARKET REVENUE, BY USAGE, 2018–2026($MILLION)
TABLE 77.   FRANCE AIR FILTRATION MEDIA MARKET REVENUE, BY RATING 2018–2026($MILLION)
TABLE 78.   FRANCE AIR FILTRATION MEDIA MARKET REVENUE, BY MEDIA 2018–2026($MILLION)
TABLE 79.   UK AIR FILTRATION MEDIA MARKET REVENUE, BY END USER 2018–2026($MILLION)
TABLE 80.   UK AIR FILTRATION MEDIA MARKET REVENUE, BY APPLICATION 2018–2026($MILLION)
TABLE 81.   UK AIR FILTRATION MEDIA MARKET REVENUE, BY MEDIA 2018–2026($MILLION)
TABLE 82.   UK AIR FILTRATION MEDIA MARKET REVENUE, BY USAGE, 2018–2026($MILLION)
TABLE 83.   UK AIR FILTRATION MEDIA MARKET REVENUE, BY RATING 2018–2026($MILLION)
TABLE 84.   UK AIR FILTRATION MEDIA MARKET REVENUE, BY MEDIA 2018–2026($MILLION)
TABLE 85.   ITALY AIR FILTRATION MEDIA MARKET REVENUE, BY END USER 2018–2026($MILLION)
TABLE 86.   ITALY AIR FILTRATION MEDIA MARKET REVENUE, BY APPLICATION 2018–2026($MILLION)
TABLE 87.   ITALY AIR FILTRATION MEDIA MARKET REVENUE, BY MEDIA 2018–2026($MILLION)
TABLE 88.   ITALY AIR FILTRATION MEDIA MARKET REVENUE, BY USAGE, 2018–2026($MILLION)
TABLE 89.   ITALY AIR FILTRATION MEDIA MARKET REVENUE, BY RATING 2018–2026($MILLION)
TABLE 90.   ITALY AIR FILTRATION MEDIA MARKET REVENUE, BY MEDIA 2018–2026($MILLION)
TABLE 91.   RUSSIA AIR FILTRATION MEDIA MARKET REVENUE, BY END USER 2018–2026($MILLION)
TABLE 92.   RUSSIA AIR FILTRATION MEDIA MARKET REVENUE, BY APPLICATION 2018–2026($MILLION)
TABLE 93.   RUSSIA AIR FILTRATION MEDIA MARKET REVENUE, BY MEDIA 2018–2026($MILLION)
TABLE 94.   RUSSIA AIR FILTRATION MEDIA MARKET REVENUE, BY USAGE, 2018–2026($MILLION)
TABLE 95.   RUSSIA AIR FILTRATION MEDIA MARKET REVENUE, BY RATING 2018–2026($MILLION)
TABLE 96.   RUSSIA AIR FILTRATION MEDIA MARKET REVENUE, BY MEDIA 2018–2026($MILLION)
TABLE 97.   REST OF EUROPE AIR FILTRATION MEDIA MARKET REVENUE, BY END USER 2018–2026($MILLION)
TABLE 98.   REST OF EUROPE AIR FILTRATION MEDIA MARKET REVENUE, BY APPLICATION 2018–2026($MILLION)
TABLE 99.   REST OF EUROPE AIR FILTRATION MEDIA MARKET REVENUE, BY MEDIA 2018–2026($MILLION)
TABLE 100.   REST OF EUROPE AIR FILTRATION MEDIA MARKET REVENUE, BY USAGE, 2018–2026($MILLION)
TABLE 101.   REST OF EUROPE AIR FILTRATION MEDIA MARKET REVENUE, BY RATING 2018–2026($MILLION)
TABLE 102.   REST OF EUROPE AIR FILTRATION MEDIA MARKET REVENUE, BY MEDIA 2018–2026($MILLION)
TABLE 103.   ASIA-PACIFIC AIR FILTRATION MEDIA MARKET REVENUE, BY END-USER 2018–2026($MILLION)
TABLE 104.   ASIA-PACIFIC AIR FILTRATION MEDIA MARKET REVENUE, BY APPLICATION 2018–2026($MILLION)
TABLE 105.   ASIA-PACIFIC AIR FILTRATION MEDIA MARKET REVENUE, BY MEDIA, 2018–2026($MILLION)
TABLE 106.   ASIA-PACIFIC AIR FILTRATION MEDIA MARKET REVENUE, BY USAGE, 2018–2026($MILLION)
TABLE 107.   ASIA-PACIFIC AIR FILTRATION MEDIA MARKET REVENUE, BY RATING 2018–2026($MILLION)
TABLE 108.   ASIA-PACIFIC AIR FILTRATION MEDIA MARKET REVENUE, BY BUSINESS 2018–2026($MILLION)
TABLE 109.   JAPAN AIR FILTRATION MEDIA MARKET REVENUE, BY END USER 2018–2026($MILLION)
TABLE 110.   JAPAN AIR FILTRATION MEDIA MARKET REVENUE, BY APPLICATION 2018–2026($MILLION)
TABLE 111.   JAPAN AIR FILTRATION MEDIA MARKET REVENUE, BY MEDIA 2018–2026($MILLION)
TABLE 112.   JAPAN AIR FILTRATION MEDIA MARKET REVENUE, BY USAGE, 2018–2026($MILLION)
TABLE 113.   JAPAN AIR FILTRATION MEDIA MARKET REVENUE, BY RATING 2018–2026($MILLION)
TABLE 114.   JAPAN AIR FILTRATION MEDIA MARKET REVENUE, BY MEDIA 2018–2026($MILLION)
TABLE 115.   CHINA AIR FILTRATION MEDIA MARKET REVENUE, BY END USER 2018–2026($MILLION)
TABLE 116.   CHINA AIR FILTRATION MEDIA MARKET REVENUE, BY APPLICATION 2018–2026($MILLION)
TABLE 117.   CHINA AIR FILTRATION MEDIA MARKET REVENUE, BY MEDIA 2018–2026($MILLION)
TABLE 118.   CHINA AIR FILTRATION MEDIA MARKET REVENUE, BY USAGE, 2018–2026($MILLION)
TABLE 119.   CHINA AIR FILTRATION MEDIA MARKET REVENUE, BY RATING 2018–2026($MILLION)
TABLE 120.   CHINA AIR FILTRATION MEDIA MARKET REVENUE, BY MEDIA 2018–2026($MILLION)
TABLE 121.   INDIA AIR FILTRATION MEDIA MARKET REVENUE, BY END USER 2018–2026($MILLION)
TABLE 122.   INDIA AIR FILTRATION MEDIA MARKET REVENUE, BY APPLICATION 2018–2026($MILLION)
TABLE 123.   INDIA AIR FILTRATION MEDIA MARKET REVENUE, BY MEDIA 2018–2026($MILLION)
TABLE 124.   INDIA AIR FILTRATION MEDIA MARKET REVENUE, BY USAGE, 2018–2026($MILLION)
TABLE 125.   INDIA AIR FILTRATION MEDIA MARKET REVENUE, BY RATING 2018–2026($MILLION)
TABLE 126.   INDIA AIR FILTRATION MEDIA MARKET REVENUE, BY MEDIA 2018–2026($MILLION)
TABLE 127.   SOUTH KOREA AIR FILTRATION MEDIA MARKET REVENUE, BY END USER 2018–2026($MILLION)
TABLE 128.   SOUTH KOREA AIR FILTRATION MEDIA MARKET REVENUE, BY APPLICATION 2018–2026($MILLION)
TABLE 129.   SOUTH KOREA AIR FILTRATION MEDIA MARKET REVENUE, BY MEDIA 2018–2026($MILLION)
TABLE 130.   SOUTH KOREA AIR FILTRATION MEDIA MARKET REVENUE, BY USAGE, 2018–2026($MILLION)
TABLE 131.   SOUTH KOREA AIR FILTRATION MEDIA MARKET REVENUE, BY RATING 2018–2026($MILLION)
TABLE 132.   SOUTH KOREA AIR FILTRATION MEDIA MARKET REVENUE, BY MEDIA 2018–2026($MILLION)
TABLE 133.   SINGAPORE AIR FILTRATION MEDIA MARKET REVENUE, BY END USER 2018–2026($MILLION)
TABLE 134.   SINGAP
The air filtration media market holds high potential in the HVAC and transportation industry. The current business scenario experiences rapid development in air purifiers leading to the readiness to adopt this technology, particularly in the developed regions such as North America and Europe. Companies in this industry adopt various innovative techniques to provide customers with advanced and innovative features.
Improved efficiency and high durability are some of the major drivers for this market. However, high cost and entry of hackers into the driving operation impede the growth of this market. In the near future, there will be rise in demand for the air filter media due to rise in air pollution and government regulation. Such factors are expected to create lucrative opportunities for the key players operating in the air filtration media market. In the near future, rise in demand for the air purifiers and favorable government policies are expected to create lucrative opportunities for the key players operating in the air filtration media market.
Among the analyzed regions, Asia-Pacific is expected to account for the highest revenue in the global market throughout the forecast period (2019-2026) followed by LAMEA, North America, and Europe.
The key companies have focused on product launch, and joint venture to strengthen their foothold in the market. For instance, in October 2018, Toray Industries, Inc. established a joint venture company along with MCM Co., Ltd. named M&T Engineering Co. Ltd. The joint venture was aimed at providing integrated design and development of fibers and filter membranes as well as to expand the business in Republic of Korea.
Â
A. Degradation of air quality to increase focus on curbing air pollution, and rise in demand for air filters in healthcare industry factors drive the growth of air filtration media market.
A. The global air filtration media market size was valued at $3,573.0 million in 2018.
A. To get latest version of air filtration media market report
A. Asia-Pacific will provide more business opportunities for air filtration media in future.
A. Rise in awareness about the ill effects of air pollution on health, and environmental protection law enforced by the various governments for controlling emission are the key trends in the air filtration media market.
A. On the basis of top growing big corporation, we select top 10 players.
A. Product launch and acquisition are key growth strategies of air filtration media market players.
A. 3M, Ahlstrom-Munksjo, AIM Nonwovens and Interiors Private Limited, Air filters, Inc, Avgol Industries 1953 Ltd, Berry, Cabot Corporation, Calgon Carbon Corporation, Clean & Science, and Donaldson company, Inc.
A. Based on end user, in 2018, the commercial segment was the highest revenue contributor across the globe.
A. HVAC, air purifier, and transportation sectors are the potential customers of air filtration media industry.
Start reading instantly.
This Report and over 66,805+ more Reports, Available with Avenue Library. T&C*.
Enterprise
License/PDF
Library
Membership
*Taxes/Fees, if applicable will be added during checkout. All prices in USD
To ensure high-level data integrity, accurate analysis, and impeccable forecasts
For complete satisfaction
On-demand customization of scope of the report to exactly meet your needs
Targeted market view to provide pertinent information and save time of readers
Get insights on topics that are crucial for your business. Stay abreast of your interest areas.
Get Industry Data AlertsTo ensure high-level data integrity, accurate analysis, and impeccable forecasts
For complete satisfaction
On-demand customization of scope of the report to exactly meet your needs
Targeted market view to provide pertinent information and save time of readers