
Air Freshener Market Outlook - 2025
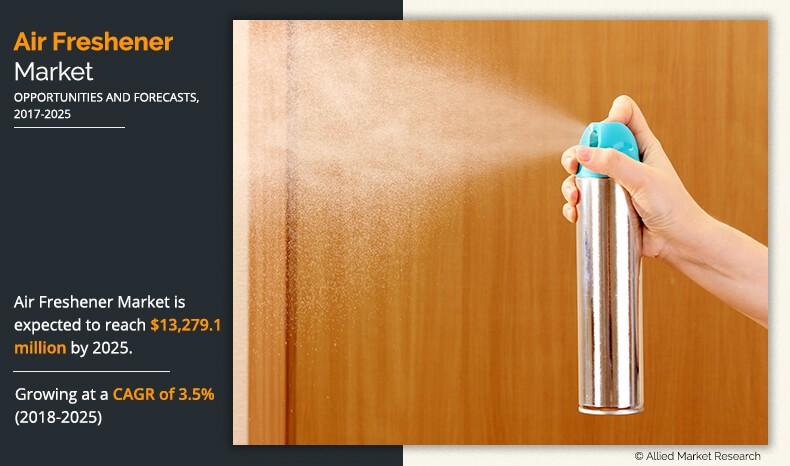
The global air freshener market was valued at $10,124.4 million in 2017, and is expected to garner $13,279.1 million by 2025, registering a CAGR of 3.5% from 2018 to 2025. An air freshener is a product that typically emits fragrance to eliminate unpleasant odor in a room. It contains different ingredients such as aerosol propellants, fragrances, and solvents such as 2-butoxyethanol, mineral oil, and glycol ethers, which neutralize unpleasant odor. These air fresheners adsorb the bad odor, thereby masking the bad smell in the air. Air fresheners are being used throughout society. Typically, indoor environments with air fresheners may include buildings and facilities such as offices, schools, hospitals, theaters, stores, hotels, health clubs, restaurants, restrooms, and more. Apart from these indoor environments, they are also being used in transportation such as airplanes, cars, taxis, buses, trains, terminals, boats, and many more.
Rise in demand for air care and increase in concerns over indoor air quality have led to a high demand for air fresheners worldwide. Furthermore, rise in disposable income and change in lifestyle & spending habits further boost the market growth. Moreover, rapid growth in car sales along with a surge in number of pets’ ownerships and increase in consumers’ willingness to use premium air fresheners drives the growth of the global air freshener market. However, high cost of production hampers the widespread adoption and act as the major restraint for the global air freshener market. On the contrary, increase in demand for high-end lifestyles and luxury in everyday lives provide lucrative opportunity for the use of air fresheners in an extensive manner. The need for luxury has increased at a rapid pace owing to rise in disposable income of individuals. Moreover, bad odor in hospitals or healthcare centers due to chemicals and bacterial infections has fueled the demand for air fresheners. In near future, these areas would be prime opportunity areas for the growth of the air freshener industry.
The report segments the global air freshener market based on product type, application, type of customer, and region. Based on product type, the market has been bifurcated into sprays/aerosols, electric air fresheners, gels, candles, and others. Based on application, the market has been segmented into residential, corporate offices, cars, and others. Based on type of customer, the market has been classified into individual customers and enterprise customers. By region, the global air freshener market has been studied and analyzed across North America, Europe, Asia-Pacific, and LAMEA.
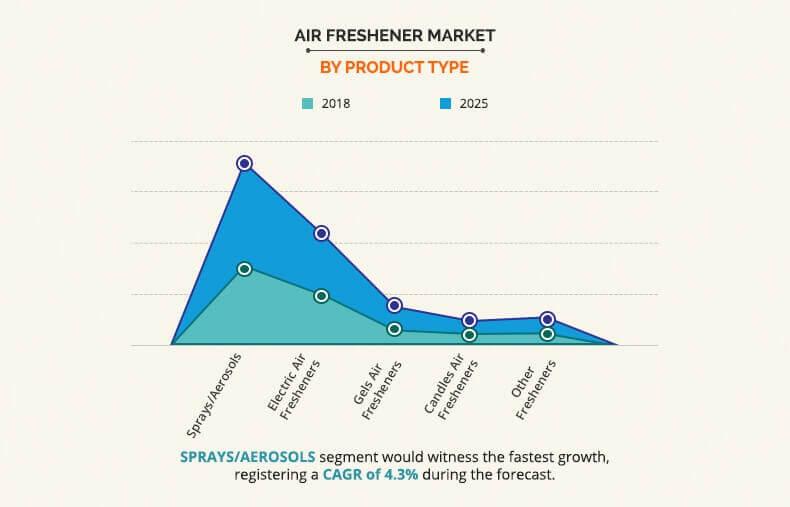
In 2017, the sprays/aerosols segment accounted for the highest share in the product type segment. The market for sprays/aerosols is driven by ease of use and availability all over the world. The gel air freshener segment is expected to witness the substantial growth with CAGR of 4.2% throughout the forecast period. This was attributed to increase in adoption of this product for use in cars. Increase in demand for cars drives the growth of gel air fresheners worldwide.
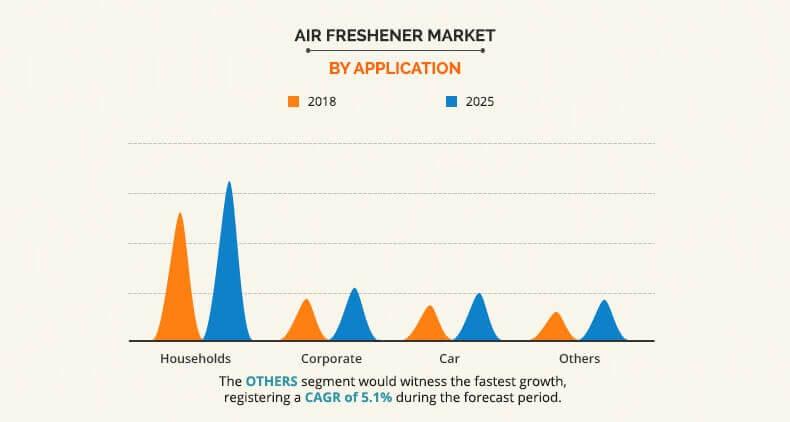
In 2017, the household segment dominated the application segment in the air freshener market. This was attributed to favorable demography and rise in inclination toward sanitation throughout the globe. However, the car segment is projected to grow at the highest CAGR of 4.0% throughout the forecast period. This was attributed to increased disposable income and rise in affinity of consumers to spend on premium products. Moreover, surge in the growth of the automobile industry has also helped achieve this high growth rate.
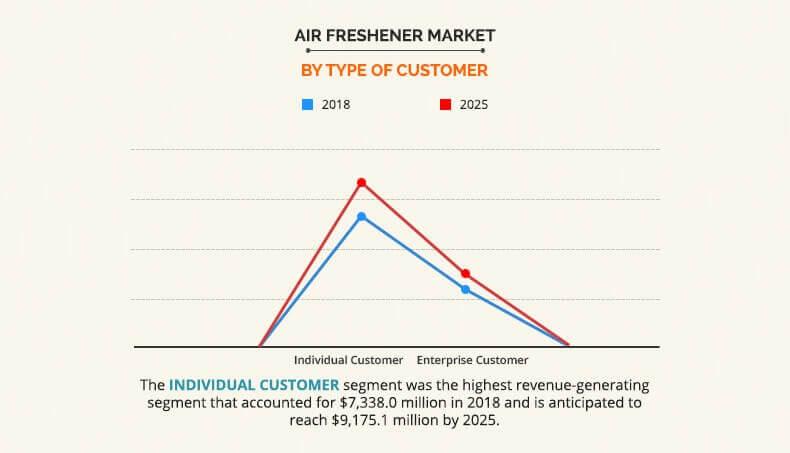
In 2017, the individual customers had the highest contribution in the global air freshener market share. This was due to rise in affinity of consumers toward sanitation and premium products. Moreover, attractive advertising and ease of availability also drive the global air freshener market growth. The enterprise customer segment is expected to witness the highest CAGR of 4.3% in 2017 owing to increase in adoption of air care products in offices and other landmarks to maintain good environmental hygiene.
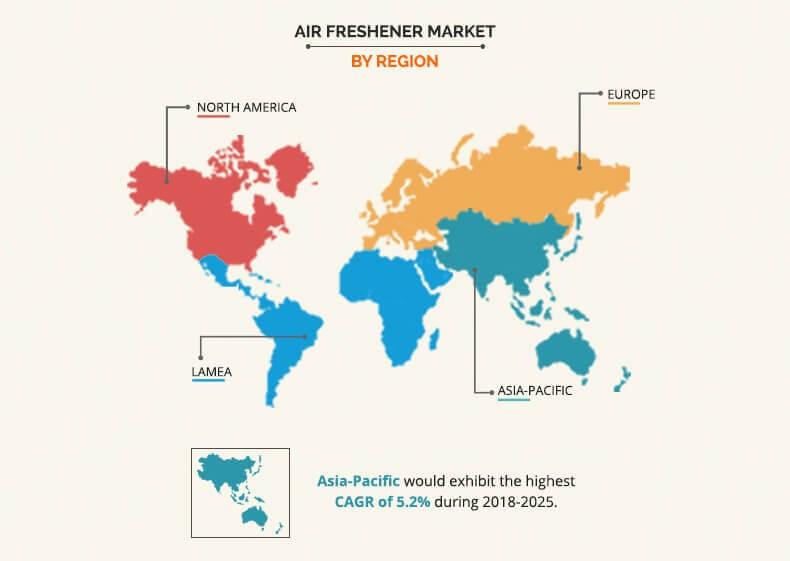
In 2017, Europe is expected to dominate the market for air freshener due to mature and developed retail infrastructure. Effective retail infrastructure allows companies to easily make its product available to the customers, which in turn helps by increase in overall sales. Furthermore, European population have high disposable income that allows them to consume premium quality products, which further adds to the growth of this region in the global air freshener industry.
Players have adopted product launch as their key strategy to increase their market share and to remain competitive in the market. The leading players in the air freshener industry have also focused on acquisition and business expansion as their key strategies to gain a significant market share globally. The key players profiled in the report include Procter & Gamble Co., Reckitt Benckiser Inc., Henkel KGaA, Church & Dwight Co. Inc., Car-Freshener Corporation, SC Johnson & Son Inc., Kobayashi Pharmaceutical Co. Ltd., Godrej Household Products Ltd., Farcent Enterprise Co. Ltd., and Newell Brands.
The other market players (not profiled in this report) include Air Delights Inc., Dabur India Ltd., Hamilton Beach Brands Holding Company, Rexair LLC, Beaumont Products, Inc., Scott's Liquid Gold, Dr.Marcus International, Jelly Belly UK, Pinnacle Horizons Pty Ltd and Balev Corporation Eood.
Key Benefits For Air Freshener Market:
- The report provides a quantitative analysis of the current air freshener market trends, estimations, and dynamics of the market size from 2017 to 2025 to identify the prevailing market opportunities.
- The key countries in all the major regions are mapped based on their market share.
- Porter’s five forces analysis highlights the potency of buyers and suppliers to enable stakeholders to make profit-oriented business decisions and strengthen their supplier–buyer network.
- In-depth analysis and the air freshener market size and segmentation assists in determining the prevailing air freshener market opportunities.
- Major countries in each region are mapped according to their revenue contribution to the global air freshener industry.
- Market player positioning segment facilitates benchmarking and provides a clear understanding of the present position of the market players.
- The report includes revenue generated from the sales and air freshener market forecast across North America, Europe, Asia-Pacific, and LAMEA.
- The air freshener market report includes the air freshener market analysis at regional as well as the global level, key players, market segments, application areas, and growth strategies.
- Competitive intelligence of the industry highlights the business practices followed by key players across geographies and the prevailing market opportunities.
Air Freshener Market Report Highlights
| Aspects | Details |
| By Product Type |
|
| By Application |
|
| By Type |
|
| By Region |
|
| Key Market Players | Procter & Gamble, Farcent Enterprise Co. Ltd., Newell Brands, Church & Dwight, Inc., Henkel AG & Co. KGaA, Kobayashi Pharmaceutical Co. Ltd., Car-Freshener Corporation, Godrej Consumer Products Limited, S. C. Johnson & Son, Inc., Reckitt Benckiser Group plc. |
Analyst Review
Globally, the air freshener market share is estimated to escalate at a higher growth rate due to increase in demand for home and air care products across the world.
Based on the interviews of various top-level CXOs of leading companies, the increase in sale of air freshener is driven by increase in concerns over indoor air quality. Moreover, rapid growth in car sales all around the globe along with a surge in number of pet ownership as well as increase in consumers’ willingness to purchase premium products fuel the growth of the global air freshener market. Furthermore, increase in disposable income and improvement in lifestyle of consumers especially in the emerging economies have paved the way for the air freshener market growth. To meet the consumer’s demand to expand their business, air freshener manufacturers across various regions focus on improving their existing products as well as increasing the manufacture of a number of air freshener with different fragrance. This is one of the major factors due to which the demands of air freshener are experiencing a surge. Europe is among the dominating region holding a major share in the air freshener market in terms of value in 2017 and is closely followed by North America and Asia-Pacific, respectively.
However, as per CXOs’ perspectives, high cost of production hampers the widespread adoption and act as the major restraint for the global air freshener market.
The growth rate of air freshener market is 3.5% from 2018 to 2025, owing to rise in demand for air care and increase in concerns over indoor air quality have led to a high demand for air fresheners worldwide. The demand is further fueled by the rapid growth in car sales, surge in number of pet ownerships, and increase in consumers’ willingness to use premium air fresheners.
The global air freshener market was valued at $10,124.4 million in 2017, and is expected to garner $13,279.1 million by 2025, registering a CAGR of 3.5% from 2018 to 2025. High disposable income and improvement in lifestyle of consumers provide lucrative opportunities for the market development. However, factors such as high operational cost are expected to restrain the market growth.
The key players operating in the market include Procter & Gamble Co., Reckitt Benckiser Inc., Henkel KGaA, Church & Dwight Co. Inc., Car-Freshener Corporation, SC Johnson & Son Inc., Kobayashi Pharmaceutical Co. Ltd., Godrej Household Products Ltd., Farcent Enterprise Co. Ltd., and Newell Brands.
The growth of the air freshener industry is driven by increase in disposable income of people along with rise in the living standards of consumers around the globe. Moreover, increase in concerns over indoor air quality have led to a high demand for air fresheners worldwide. Furthermore, rapid growth in car sales along with a surge in number of pets ownerships and increase in consumers’ willingness to use premium air fresheners are expected to boost the growth of the global air freshener market
Need for aromatherapy, High focus on indoor air quality and healthcare improvement, Rise in car and pet ownership, are some of the driving factors fuelling the global Air Freshener market. Therefore, air freshener is an important product in the car aftermarket, especially in countries such as the U.S. and the UK. In addition, the number of car sales has increased rapidly in emerging economies, which is expected to boost the air freshener market
Air freshener diffusers, be it electronic or manual, need to be refilled at the end of a fortnight or a month. Thus, high cost associated with air fresheners limits market growth. The use of toxic-free natural beeswax and plug-in devices is expensive, as these cannot be used in all the indoor enterprises such as high business-end corporate sectors, which further restricts the growth of this market.
Emerging countries such as India, Brazil, and rest of LAMEA are growing with a growth rate OF 5.6%, 3.4%, and 3.7% respectively. Increasing disposable income and improvement in lifestyle of consumers provide lucrative opportunities for the market development in emerging countries. However, factors such as high operational cost are expected to restrain the market growth.
Based on the interviews of various top-level CXOs of leading companies, the increase in sale of air freshener is driven by rise in concerns over indoor air quality. Moreover, rapid growth in car sales across the globe along with a surge in number of pet ownerships as well as an increase in consumers’ willingness to purchase premium products have fueled the growth of the global air freshener market.
Loading Table Of Content...

