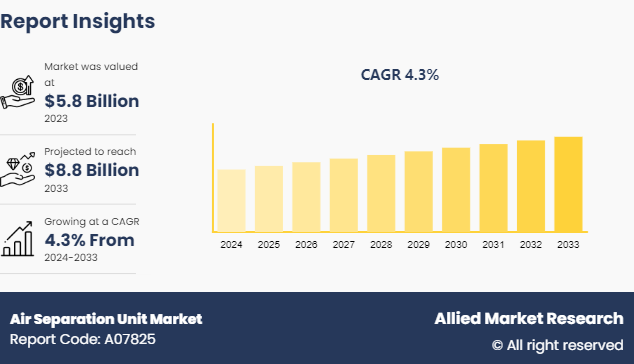
0
Upcoming Allied Market Research
2023
Air Separation Unit Market

Air Separation Unit Market: Global Opportunity Analysis and Industry Forecast, 2023-2030 Market

Report Code: A07825
Nov 2023 | Pages: NA
Tables: NA
Charts: NA
  • Formats*:

  • pdf

    Single User License, Five User
    License & Enterprise User License

  • xls

    Data Pack Excel License

  • ppt

    It comes with the additional cost
    of $2500.00 contact sales.


COVID-19

Pandemic disrupted the entire world and affected many industries.

Get detailed COVID-19 impact analysis on the Air Separation Unit Market

Request Now !

Air Separation Unit Market Outlook - 2027

Air separation unit facilitates the separation of primary components such as nitrogen, oxygen, argon, and other inert gases from atmosphere. The most common methods for air separation include cryogenic distillation and non-cryogenic distillation. Furthermore, air separation units are majorly applicable in the chemical and oil & gas industries.

COVID-19 impact analysis

The global market for air separation unit is severely impacted by the outbreak of the COVID-19 pandemic. The pandemic has forced many industries in the market to nearly stop their operations to comply with the government regulations such as social distancing. Thus, the suspension of manufacturing activities in commercial and industrial sectors has led to less usage of air separation units, thus declining their demand in the market. In addition, insufficiency in raw material supply is anticipated to hamper the production rate of air separation units. Owing to the lockdown implemented across various countries, national and international transport have been hampered, which has significantly impacted the supply chain of numerous industries across the globe, thereby increasing the supply–demand gap. However, the sectors such as chemical industry are expected to witness more usage of air separation units, as they are the least affected segments by the coronavirus outbreak.

Top impacting factors: market scenario analysis, trends, drivers, and impact analysis

The expansion of industrial, commercial, and utility-scale sectors is the major driver of the air separation unit market growth. Continuous bacteria-free air supply is vital for proper functioning in industrial process, which boosts the demand for air separation units. The emission reduction target is further boosting the demand for air separation units. However, complex installation process and the volatility in prices of air separation units are anticipated to hamper the growth of the market during the forecast period.

New product launches to flourish the market

Leading market players have been focusing on launching new products, which exhibit improved capabilities. For example, air separator has been introduced for pharmaceutical powder of size 45 micrometer. Expansions, acquisitions, and partnerships are the key growth strategies adopted by the key players to expand their business in the potential markets. The market players are further seeking opportunities to expand their range of air separation units in different segments of oil & gas as well as commercial industries.

Surge in usage in residential and commercial applications 

Manufacturers have been focusing on producing new products for specific applications, as there are varying demands based on the utilization. Leading market players have determined how improved accuracy can be influential in many applications. In addition, the expansion of the chemical industry and increase in residential activities drive the demand for air separation units.

Key benefits of the report

  • This study presents the analytical depiction of the global air separation unit industry along with the current trends and market estimation to determine the imminent investment pockets.
  • The report represents information related to key drivers, restraints, and opportunities along with detailed analysis of the air separation market.
  • The current market is quantitatively analyzed to highlight the market growth scenario.
  • The report provides a detailed market analysis depending on competitive and how the competition will take shape in coming years.
  • This report helps users in comprehending the key product segments and their future.

Air Separation Unit Market: Global Opportunity Analysis and Industry Forecast, 2020–2027 Report Highlights

Aspects Details
By Process
  • Cryogenic distillation
  • Non-cryogenic distillation
By Gas
  • Nitrogen
  • Oxygen
  • Argon
  • Others
By End User
  • Chemical
  • Oil & gas
  • Iron & steel
  • Others
By Region
  • North America  (US, Canada)
  • Europe  (Germany, UK, France, rest of Europe)
  • Asia-Pacific  (China, Japan, India, rest of Asia-Pacific)
  • LAMEA  (Brazil, Mexico, rest of LATAM)
  • Middle East 
  • Africa 
Key Market Players Universal Industrial Gases, Messer Group GmbH, Praxair, Inc., Air Liquide S.A., Linde AG, Technex Ltd., Air Products and Chemicals, Inc., Sichuan Air Separation Plant Group, Taiyo Nippon Sanso Corporation
 
  • CHAPTER 1: INTRODUCTION

    • 1.1. Report Description

    • 1.2. Key Market Segments

    • 1.3. Key Benefits

    • 1.4. Research Methodology

      • 1.4.1. Primary Research

      • 1.4.2. Secondary Research

      • 1.4.3. Analyst Tools and Models

  • CHAPTER 2: EXECUTIVE SUMMARY

    • 2.1. CXO Perspective

  • CHAPTER 3: MARKET LANDSCAPE

    • 3.1. Market Definition and Scope

    • 3.2. Key Findings

      • 3.2.1. Top Investment Pockets

      • 3.2.2. Top Winning Strategies

    • 3.3. Porter's Five Forces Analysis

      • 3.3.1. Bargaining Power of Suppliers

      • 3.3.2. Threat of New Entrants

      • 3.3.3. Threat of Substitutes

      • 3.3.4. Competitive Rivalry

      • 3.3.5. Bargaining Power among Buyers

    • 3.5. Market Dynamics

      • 3.5.1. Drivers

      • 3.5.2. Restraints

      • 3.5.3. Opportunities

    • 3.6. COVID-19 Impact Analysis

  • CHAPTER 4: AIR SEPARATION UNIT MARKET, BY PROCESS

    • 4.1. Market Overview

      • 4.1.1 Market Size and Forecast, By Process

    • 4.2. Cryogenic Distillation

      • 4.2.1. Key Market Trends, Growth Factors and Opportunities

      • 4.2.2. Market Size and Forecast, By Region

      • 4.2.3. Market Share Analysis, By Country

    • 4.3. Non-cryogenic Distillation

      • 4.3.1. Key Market Trends, Growth Factors and Opportunities

      • 4.3.2. Market Size and Forecast, By Region

      • 4.3.3. Market Share Analysis, By Country

  • CHAPTER 5: AIR SEPARATION UNIT MARKET, BY GAS

    • 5.1. Market Overview

      • 5.1.1 Market Size and Forecast, By Gas

    • 5.2. Nitrogen

      • 5.2.1. Key Market Trends, Growth Factors and Opportunities

      • 5.2.2. Market Size and Forecast, By Region

      • 5.2.3. Market Share Analysis, By Country

    • 5.3. Oxygen

      • 5.3.1. Key Market Trends, Growth Factors and Opportunities

      • 5.3.2. Market Size and Forecast, By Region

      • 5.3.3. Market Share Analysis, By Country

    • 5.4. Argon

      • 5.4.1. Key Market Trends, Growth Factors and Opportunities

      • 5.4.2. Market Size and Forecast, By Region

      • 5.4.3. Market Share Analysis, By Country

    • 5.5. Others

      • 5.5.1. Key Market Trends, Growth Factors and Opportunities

      • 5.5.2. Market Size and Forecast, By Region

      • 5.5.3. Market Share Analysis, By Country

  • CHAPTER 6: AIR SEPARATION UNIT MARKET, BY END USER

    • 6.1. Market Overview

      • 6.1.1 Market Size and Forecast, By End User

    • 6.2. Chemical

      • 6.2.1. Key Market Trends, Growth Factors and Opportunities

      • 6.2.2. Market Size and Forecast, By Region

      • 6.2.3. Market Share Analysis, By Country

    • 6.3. Oil Gas

      • 6.3.1. Key Market Trends, Growth Factors and Opportunities

      • 6.3.2. Market Size and Forecast, By Region

      • 6.3.3. Market Share Analysis, By Country

    • 6.4. Iron Steel

      • 6.4.1. Key Market Trends, Growth Factors and Opportunities

      • 6.4.2. Market Size and Forecast, By Region

      • 6.4.3. Market Share Analysis, By Country

    • 6.5. Others

      • 6.5.1. Key Market Trends, Growth Factors and Opportunities

      • 6.5.2. Market Size and Forecast, By Region

      • 6.5.3. Market Share Analysis, By Country

  • CHAPTER 7: AIR SEPARATION UNIT MARKET, BY REGION

    • 7.1. Market Overview

      • 7.1.1 Market Size and Forecast, By Region

    • 7.2. North America

      • 7.2.1. Key Market Trends and Opportunities

      • 7.2.2. Market Size and Forecast, By Process

      • 7.2.3. Market Size and Forecast, By Gas

      • 7.2.4. Market Size and Forecast, By End User

      • 7.2.5. Market Size and Forecast, By Country

      • 7.2.6. U.S. Air Separation Unit Market

        • 7.2.6.1. Market Size and Forecast, By Process
        • 7.2.6.2. Market Size and Forecast, By Gas
        • 7.2.6.3. Market Size and Forecast, By End User
      • 7.2.7. Canada Air Separation Unit Market

        • 7.2.7.1. Market Size and Forecast, By Process
        • 7.2.7.2. Market Size and Forecast, By Gas
        • 7.2.7.3. Market Size and Forecast, By End User
      • 7.2.8. Mexico Air Separation Unit Market

        • 7.2.8.1. Market Size and Forecast, By Process
        • 7.2.8.2. Market Size and Forecast, By Gas
        • 7.2.8.3. Market Size and Forecast, By End User
    • 7.3. Europe

      • 7.3.1. Key Market Trends and Opportunities

      • 7.3.2. Market Size and Forecast, By Process

      • 7.3.3. Market Size and Forecast, By Gas

      • 7.3.4. Market Size and Forecast, By End User

      • 7.3.5. Market Size and Forecast, By Country

      • 7.3.6. France Air Separation Unit Market

        • 7.3.6.1. Market Size and Forecast, By Process
        • 7.3.6.2. Market Size and Forecast, By Gas
        • 7.3.6.3. Market Size and Forecast, By End User
      • 7.3.7. Germany Air Separation Unit Market

        • 7.3.7.1. Market Size and Forecast, By Process
        • 7.3.7.2. Market Size and Forecast, By Gas
        • 7.3.7.3. Market Size and Forecast, By End User
      • 7.3.8. Italy Air Separation Unit Market

        • 7.3.8.1. Market Size and Forecast, By Process
        • 7.3.8.2. Market Size and Forecast, By Gas
        • 7.3.8.3. Market Size and Forecast, By End User
      • 7.3.9. Spain Air Separation Unit Market

        • 7.3.9.1. Market Size and Forecast, By Process
        • 7.3.9.2. Market Size and Forecast, By Gas
        • 7.3.9.3. Market Size and Forecast, By End User
      • 7.3.10. UK Air Separation Unit Market

        • 7.3.10.1. Market Size and Forecast, By Process
        • 7.3.10.2. Market Size and Forecast, By Gas
        • 7.3.10.3. Market Size and Forecast, By End User
      • 7.3.11. Russia Air Separation Unit Market

        • 7.3.11.1. Market Size and Forecast, By Process
        • 7.3.11.2. Market Size and Forecast, By Gas
        • 7.3.11.3. Market Size and Forecast, By End User
      • 7.3.12. Rest Of Europe Air Separation Unit Market

        • 7.3.12.1. Market Size and Forecast, By Process
        • 7.3.12.2. Market Size and Forecast, By Gas
        • 7.3.12.3. Market Size and Forecast, By End User
    • 7.4. Asia-Pacific

      • 7.4.1. Key Market Trends and Opportunities

      • 7.4.2. Market Size and Forecast, By Process

      • 7.4.3. Market Size and Forecast, By Gas

      • 7.4.4. Market Size and Forecast, By End User

      • 7.4.5. Market Size and Forecast, By Country

      • 7.4.6. China Air Separation Unit Market

        • 7.4.6.1. Market Size and Forecast, By Process
        • 7.4.6.2. Market Size and Forecast, By Gas
        • 7.4.6.3. Market Size and Forecast, By End User
      • 7.4.7. Japan Air Separation Unit Market

        • 7.4.7.1. Market Size and Forecast, By Process
        • 7.4.7.2. Market Size and Forecast, By Gas
        • 7.4.7.3. Market Size and Forecast, By End User
      • 7.4.8. India Air Separation Unit Market

        • 7.4.8.1. Market Size and Forecast, By Process
        • 7.4.8.2. Market Size and Forecast, By Gas
        • 7.4.8.3. Market Size and Forecast, By End User
      • 7.4.9. South Korea Air Separation Unit Market

        • 7.4.9.1. Market Size and Forecast, By Process
        • 7.4.9.2. Market Size and Forecast, By Gas
        • 7.4.9.3. Market Size and Forecast, By End User
      • 7.4.10. Australia Air Separation Unit Market

        • 7.4.10.1. Market Size and Forecast, By Process
        • 7.4.10.2. Market Size and Forecast, By Gas
        • 7.4.10.3. Market Size and Forecast, By End User
      • 7.4.11. Thailand Air Separation Unit Market

        • 7.4.11.1. Market Size and Forecast, By Process
        • 7.4.11.2. Market Size and Forecast, By Gas
        • 7.4.11.3. Market Size and Forecast, By End User
      • 7.4.12. Malaysia Air Separation Unit Market

        • 7.4.12.1. Market Size and Forecast, By Process
        • 7.4.12.2. Market Size and Forecast, By Gas
        • 7.4.12.3. Market Size and Forecast, By End User
      • 7.4.13. Indonesia Air Separation Unit Market

        • 7.4.13.1. Market Size and Forecast, By Process
        • 7.4.13.2. Market Size and Forecast, By Gas
        • 7.4.13.3. Market Size and Forecast, By End User
      • 7.4.14. Rest of Asia Pacific Air Separation Unit Market

        • 7.4.14.1. Market Size and Forecast, By Process
        • 7.4.14.2. Market Size and Forecast, By Gas
        • 7.4.14.3. Market Size and Forecast, By End User
    • 7.5. LAMEA

      • 7.5.1. Key Market Trends and Opportunities

      • 7.5.2. Market Size and Forecast, By Process

      • 7.5.3. Market Size and Forecast, By Gas

      • 7.5.4. Market Size and Forecast, By End User

      • 7.5.5. Market Size and Forecast, By Country

      • 7.5.6. Brazil Air Separation Unit Market

        • 7.5.6.1. Market Size and Forecast, By Process
        • 7.5.6.2. Market Size and Forecast, By Gas
        • 7.5.6.3. Market Size and Forecast, By End User
      • 7.5.7. South Africa Air Separation Unit Market

        • 7.5.7.1. Market Size and Forecast, By Process
        • 7.5.7.2. Market Size and Forecast, By Gas
        • 7.5.7.3. Market Size and Forecast, By End User
      • 7.5.8. Saudi Arabia Air Separation Unit Market

        • 7.5.8.1. Market Size and Forecast, By Process
        • 7.5.8.2. Market Size and Forecast, By Gas
        • 7.5.8.3. Market Size and Forecast, By End User
      • 7.5.9. UAE Air Separation Unit Market

        • 7.5.9.1. Market Size and Forecast, By Process
        • 7.5.9.2. Market Size and Forecast, By Gas
        • 7.5.9.3. Market Size and Forecast, By End User
      • 7.5.10. Argentina Air Separation Unit Market

        • 7.5.10.1. Market Size and Forecast, By Process
        • 7.5.10.2. Market Size and Forecast, By Gas
        • 7.5.10.3. Market Size and Forecast, By End User
      • 7.5.11. Rest of LAMEA Air Separation Unit Market

        • 7.5.11.1. Market Size and Forecast, By Process
        • 7.5.11.2. Market Size and Forecast, By Gas
        • 7.5.11.3. Market Size and Forecast, By End User
  • CHAPTER 8: COMPETITIVE LANDSCAPE

    • 8.1. Introduction

    • 8.2. Top Winning Strategies

    • 8.3. Product Mapping Of Top 10 Player

    • 8.4. Competitive Dashboard

    • 8.5. Competitive Heatmap

    • 8.6. Top Player Positioning,2022

  • CHAPTER 9: COMPANY PROFILES

    • 9.1. Linde AG

      • 9.1.1. Company Overview

      • 9.1.2. Key Executives

      • 9.1.3. Company Snapshot

      • 9.1.4. Operating Business Segments

      • 9.1.5. Product Portfolio

      • 9.1.6. Business Performance

      • 9.1.7. Key Strategic Moves and Developments

    • 9.2. Air Liquide S.A.

      • 9.2.1. Company Overview

      • 9.2.2. Key Executives

      • 9.2.3. Company Snapshot

      • 9.2.4. Operating Business Segments

      • 9.2.5. Product Portfolio

      • 9.2.6. Business Performance

      • 9.2.7. Key Strategic Moves and Developments

    • 9.3. Praxair, Inc.

      • 9.3.1. Company Overview

      • 9.3.2. Key Executives

      • 9.3.3. Company Snapshot

      • 9.3.4. Operating Business Segments

      • 9.3.5. Product Portfolio

      • 9.3.6. Business Performance

      • 9.3.7. Key Strategic Moves and Developments

    • 9.4. Air Products And Chemicals, Inc.

      • 9.4.1. Company Overview

      • 9.4.2. Key Executives

      • 9.4.3. Company Snapshot

      • 9.4.4. Operating Business Segments

      • 9.4.5. Product Portfolio

      • 9.4.6. Business Performance

      • 9.4.7. Key Strategic Moves and Developments

    • 9.5. Taiyo Nippon Sanso Corporation

      • 9.5.1. Company Overview

      • 9.5.2. Key Executives

      • 9.5.3. Company Snapshot

      • 9.5.4. Operating Business Segments

      • 9.5.5. Product Portfolio

      • 9.5.6. Business Performance

      • 9.5.7. Key Strategic Moves and Developments

    • 9.6. Messer Group GmbH

      • 9.6.1. Company Overview

      • 9.6.2. Key Executives

      • 9.6.3. Company Snapshot

      • 9.6.4. Operating Business Segments

      • 9.6.5. Product Portfolio

      • 9.6.6. Business Performance

      • 9.6.7. Key Strategic Moves and Developments

    • 9.7. Sichuan Air Separation Plant Group

      • 9.7.1. Company Overview

      • 9.7.2. Key Executives

      • 9.7.3. Company Snapshot

      • 9.7.4. Operating Business Segments

      • 9.7.5. Product Portfolio

      • 9.7.6. Business Performance

      • 9.7.7. Key Strategic Moves and Developments

    • 9.8. Universal Industrial Gases

      • 9.8.1. Company Overview

      • 9.8.2. Key Executives

      • 9.8.3. Company Snapshot

      • 9.8.4. Operating Business Segments

      • 9.8.5. Product Portfolio

      • 9.8.6. Business Performance

      • 9.8.7. Key Strategic Moves and Developments

    • 9.9. Technex Ltd.

      • 9.9.1. Company Overview

      • 9.9.2. Key Executives

      • 9.9.3. Company Snapshot

      • 9.9.4. Operating Business Segments

      • 9.9.5. Product Portfolio

      • 9.9.6. Business Performance

      • 9.9.7. Key Strategic Moves and Developments

  • LIST OF TABLES

  • TABLE 1. GLOBAL AIR SEPARATION UNIT MARKET, BY PROCESS, 2022-2032 ($MILLION)
  • TABLE 2. GLOBAL AIR SEPARATION UNIT MARKET FOR CRYOGENIC DISTILLATION, BY REGION, 2022-2032 ($MILLION)
  • TABLE 3. GLOBAL AIR SEPARATION UNIT MARKET FOR NON-CRYOGENIC DISTILLATION, BY REGION, 2022-2032 ($MILLION)
  • TABLE 4. GLOBAL AIR SEPARATION UNIT MARKET, BY GAS, 2022-2032 ($MILLION)
  • TABLE 5. GLOBAL AIR SEPARATION UNIT MARKET FOR NITROGEN, BY REGION, 2022-2032 ($MILLION)
  • TABLE 6. GLOBAL AIR SEPARATION UNIT MARKET FOR OXYGEN, BY REGION, 2022-2032 ($MILLION)
  • TABLE 7. GLOBAL AIR SEPARATION UNIT MARKET FOR ARGON, BY REGION, 2022-2032 ($MILLION)
  • TABLE 8. GLOBAL AIR SEPARATION UNIT MARKET FOR OTHERS, BY REGION, 2022-2032 ($MILLION)
  • TABLE 9. GLOBAL AIR SEPARATION UNIT MARKET, BY END USER, 2022-2032 ($MILLION)
  • TABLE 10. GLOBAL AIR SEPARATION UNIT MARKET FOR CHEMICAL, BY REGION, 2022-2032 ($MILLION)
  • TABLE 11. GLOBAL AIR SEPARATION UNIT MARKET FOR OIL GAS, BY REGION, 2022-2032 ($MILLION)
  • TABLE 12. GLOBAL AIR SEPARATION UNIT MARKET FOR IRON STEEL, BY REGION, 2022-2032 ($MILLION)
  • TABLE 13. GLOBAL AIR SEPARATION UNIT MARKET FOR OTHERS, BY REGION, 2022-2032 ($MILLION)
  • TABLE 14. GLOBAL AIR SEPARATION UNIT MARKET, BY REGION, 2022-2032 ($MILLION)
  • TABLE 15. NORTH AMERICA AIR SEPARATION UNIT, BY REGION, 2022-2032 ($MILLION)
  • TABLE 16. NORTH AMERICA AIR SEPARATION UNIT, BY PROCESS, 2022-2032 ($MILLION)
  • TABLE 17. NORTH AMERICA AIR SEPARATION UNIT, BY GAS, 2022-2032 ($MILLION)
  • TABLE 18. NORTH AMERICA AIR SEPARATION UNIT, BY END USER, 2022-2032 ($MILLION)
  • TABLE 19. U.S. AIR SEPARATION UNIT, BY PROCESS, 2022-2032 ($MILLION)
  • TABLE 20. U.S. AIR SEPARATION UNIT, BY GAS, 2022-2032 ($MILLION)
  • TABLE 21. U.S. AIR SEPARATION UNIT, BY END USER, 2022-2032 ($MILLION)
  • TABLE 22. CANADA AIR SEPARATION UNIT, BY PROCESS, 2022-2032 ($MILLION)
  • TABLE 23. CANADA AIR SEPARATION UNIT, BY GAS, 2022-2032 ($MILLION)
  • TABLE 24. CANADA AIR SEPARATION UNIT, BY END USER, 2022-2032 ($MILLION)
  • TABLE 25. MEXICO AIR SEPARATION UNIT, BY PROCESS, 2022-2032 ($MILLION)
  • TABLE 26. MEXICO AIR SEPARATION UNIT, BY GAS, 2022-2032 ($MILLION)
  • TABLE 27. MEXICO AIR SEPARATION UNIT, BY END USER, 2022-2032 ($MILLION)
  • TABLE 28. EUROPE AIR SEPARATION UNIT, BY REGION, 2022-2032 ($MILLION)
  • TABLE 29. EUROPE AIR SEPARATION UNIT, BY PROCESS, 2022-2032 ($MILLION)
  • TABLE 30. EUROPE AIR SEPARATION UNIT, BY GAS, 2022-2032 ($MILLION)
  • TABLE 31. EUROPE AIR SEPARATION UNIT, BY END USER, 2022-2032 ($MILLION)
  • TABLE 32. FRANCE AIR SEPARATION UNIT, BY PROCESS, 2022-2032 ($MILLION)
  • TABLE 33. FRANCE AIR SEPARATION UNIT, BY GAS, 2022-2032 ($MILLION)
  • TABLE 34. FRANCE AIR SEPARATION UNIT, BY END USER, 2022-2032 ($MILLION)
  • TABLE 35. GERMANY AIR SEPARATION UNIT, BY PROCESS, 2022-2032 ($MILLION)
  • TABLE 36. GERMANY AIR SEPARATION UNIT, BY GAS, 2022-2032 ($MILLION)
  • TABLE 37. GERMANY AIR SEPARATION UNIT, BY END USER, 2022-2032 ($MILLION)
  • TABLE 38. ITALY AIR SEPARATION UNIT, BY PROCESS, 2022-2032 ($MILLION)
  • TABLE 39. ITALY AIR SEPARATION UNIT, BY GAS, 2022-2032 ($MILLION)
  • TABLE 40. ITALY AIR SEPARATION UNIT, BY END USER, 2022-2032 ($MILLION)
  • TABLE 41. SPAIN AIR SEPARATION UNIT, BY PROCESS, 2022-2032 ($MILLION)
  • TABLE 42. SPAIN AIR SEPARATION UNIT, BY GAS, 2022-2032 ($MILLION)
  • TABLE 43. SPAIN AIR SEPARATION UNIT, BY END USER, 2022-2032 ($MILLION)
  • TABLE 44. UK AIR SEPARATION UNIT, BY PROCESS, 2022-2032 ($MILLION)
  • TABLE 45. UK AIR SEPARATION UNIT, BY GAS, 2022-2032 ($MILLION)
  • TABLE 46. UK AIR SEPARATION UNIT, BY END USER, 2022-2032 ($MILLION)
  • TABLE 47. RUSSIA AIR SEPARATION UNIT, BY PROCESS, 2022-2032 ($MILLION)
  • TABLE 48. RUSSIA AIR SEPARATION UNIT, BY GAS, 2022-2032 ($MILLION)
  • TABLE 49. RUSSIA AIR SEPARATION UNIT, BY END USER, 2022-2032 ($MILLION)
  • TABLE 50. REST OF EUROPE AIR SEPARATION UNIT, BY PROCESS, 2022-2032 ($MILLION)
  • TABLE 51. REST OF EUROPE AIR SEPARATION UNIT, BY GAS, 2022-2032 ($MILLION)
  • TABLE 52. REST OF EUROPE AIR SEPARATION UNIT, BY END USER, 2022-2032 ($MILLION)
  • TABLE 53. ASIA-PACIFIC AIR SEPARATION UNIT, BY REGION, 2022-2032 ($MILLION)
  • TABLE 54. ASIA-PACIFIC AIR SEPARATION UNIT, BY PROCESS, 2022-2032 ($MILLION)
  • TABLE 55. ASIA-PACIFIC AIR SEPARATION UNIT, BY GAS, 2022-2032 ($MILLION)
  • TABLE 56. ASIA-PACIFIC AIR SEPARATION UNIT, BY END USER, 2022-2032 ($MILLION)
  • TABLE 57. CHINA AIR SEPARATION UNIT, BY PROCESS, 2022-2032 ($MILLION)
  • TABLE 58. CHINA AIR SEPARATION UNIT, BY GAS, 2022-2032 ($MILLION)
  • TABLE 59. CHINA AIR SEPARATION UNIT, BY END USER, 2022-2032 ($MILLION)
  • TABLE 60. JAPAN AIR SEPARATION UNIT, BY PROCESS, 2022-2032 ($MILLION)
  • TABLE 61. JAPAN AIR SEPARATION UNIT, BY GAS, 2022-2032 ($MILLION)
  • TABLE 62. JAPAN AIR SEPARATION UNIT, BY END USER, 2022-2032 ($MILLION)
  • TABLE 63. INDIA AIR SEPARATION UNIT, BY PROCESS, 2022-2032 ($MILLION)
  • TABLE 64. INDIA AIR SEPARATION UNIT, BY GAS, 2022-2032 ($MILLION)
  • TABLE 65. INDIA AIR SEPARATION UNIT, BY END USER, 2022-2032 ($MILLION)
  • TABLE 66. SOUTH KOREA AIR SEPARATION UNIT, BY PROCESS, 2022-2032 ($MILLION)
  • TABLE 67. SOUTH KOREA AIR SEPARATION UNIT, BY GAS, 2022-2032 ($MILLION)
  • TABLE 68. SOUTH KOREA AIR SEPARATION UNIT, BY END USER, 2022-2032 ($MILLION)
  • TABLE 69. AUSTRALIA AIR SEPARATION UNIT, BY PROCESS, 2022-2032 ($MILLION)
  • TABLE 70. AUSTRALIA AIR SEPARATION UNIT, BY GAS, 2022-2032 ($MILLION)
  • TABLE 71. AUSTRALIA AIR SEPARATION UNIT, BY END USER, 2022-2032 ($MILLION)
  • TABLE 72. THAILAND AIR SEPARATION UNIT, BY PROCESS, 2022-2032 ($MILLION)
  • TABLE 73. THAILAND AIR SEPARATION UNIT, BY GAS, 2022-2032 ($MILLION)
  • TABLE 74. THAILAND AIR SEPARATION UNIT, BY END USER, 2022-2032 ($MILLION)
  • TABLE 75. MALAYSIA AIR SEPARATION UNIT, BY PROCESS, 2022-2032 ($MILLION)
  • TABLE 76. MALAYSIA AIR SEPARATION UNIT, BY GAS, 2022-2032 ($MILLION)
  • TABLE 77. MALAYSIA AIR SEPARATION UNIT, BY END USER, 2022-2032 ($MILLION)
  • TABLE 78. INDONESIA AIR SEPARATION UNIT, BY PROCESS, 2022-2032 ($MILLION)
  • TABLE 79. INDONESIA AIR SEPARATION UNIT, BY GAS, 2022-2032 ($MILLION)
  • TABLE 80. INDONESIA AIR SEPARATION UNIT, BY END USER, 2022-2032 ($MILLION)
  • TABLE 81. REST OF ASIA PACIFIC AIR SEPARATION UNIT, BY PROCESS, 2022-2032 ($MILLION)
  • TABLE 82. REST OF ASIA PACIFIC AIR SEPARATION UNIT, BY GAS, 2022-2032 ($MILLION)
  • TABLE 83. REST OF ASIA PACIFIC AIR SEPARATION UNIT, BY END USER, 2022-2032 ($MILLION)
  • TABLE 84. LAMEA AIR SEPARATION UNIT, BY REGION, 2022-2032 ($MILLION)
  • TABLE 85. LAMEA AIR SEPARATION UNIT, BY PROCESS, 2022-2032 ($MILLION)
  • TABLE 86. LAMEA AIR SEPARATION UNIT, BY GAS, 2022-2032 ($MILLION)
  • TABLE 87. LAMEA AIR SEPARATION UNIT, BY END USER, 2022-2032 ($MILLION)
  • TABLE 88. BRAZIL AIR SEPARATION UNIT, BY PROCESS, 2022-2032 ($MILLION)
  • TABLE 89. BRAZIL AIR SEPARATION UNIT, BY GAS, 2022-2032 ($MILLION)
  • TABLE 90. BRAZIL AIR SEPARATION UNIT, BY END USER, 2022-2032 ($MILLION)
  • TABLE 91. SOUTH AFRICA AIR SEPARATION UNIT, BY PROCESS, 2022-2032 ($MILLION)
  • TABLE 92. SOUTH AFRICA AIR SEPARATION UNIT, BY GAS, 2022-2032 ($MILLION)
  • TABLE 93. SOUTH AFRICA AIR SEPARATION UNIT, BY END USER, 2022-2032 ($MILLION)
  • TABLE 94. SAUDI ARABIA AIR SEPARATION UNIT, BY PROCESS, 2022-2032 ($MILLION)
  • TABLE 95. SAUDI ARABIA AIR SEPARATION UNIT, BY GAS, 2022-2032 ($MILLION)
  • TABLE 96. SAUDI ARABIA AIR SEPARATION UNIT, BY END USER, 2022-2032 ($MILLION)
  • TABLE 97. UAE AIR SEPARATION UNIT, BY PROCESS, 2022-2032 ($MILLION)
  • TABLE 98. UAE AIR SEPARATION UNIT, BY GAS, 2022-2032 ($MILLION)
  • TABLE 99. UAE AIR SEPARATION UNIT, BY END USER, 2022-2032 ($MILLION)
  • TABLE 100. ARGENTINA AIR SEPARATION UNIT, BY PROCESS, 2022-2032 ($MILLION)
  • TABLE 101. ARGENTINA AIR SEPARATION UNIT, BY GAS, 2022-2032 ($MILLION)
  • TABLE 102. ARGENTINA AIR SEPARATION UNIT, BY END USER, 2022-2032 ($MILLION)
  • TABLE 103. REST OF LAMEA AIR SEPARATION UNIT, BY PROCESS, 2022-2032 ($MILLION)
  • TABLE 104. REST OF LAMEA AIR SEPARATION UNIT, BY GAS, 2022-2032 ($MILLION)
  • TABLE 105. REST OF LAMEA AIR SEPARATION UNIT, BY END USER, 2022-2032 ($MILLION)
  • TABLE 106. LINDE AG: KEY EXECUTIVES
  • TABLE 107. LINDE AG: COMPANY SNAPSHOT
  • TABLE 108. LINDE AG: OPERATING SEGMENTS
  • TABLE 109. LINDE AG: PRODUCT PORTFOLIO
  • TABLE 110. LINDE AG: KEY STRATEGIC MOVES AND DEVELOPMENTS
  • TABLE 111. AIR LIQUIDE S.A.: KEY EXECUTIVES
  • TABLE 112. AIR LIQUIDE S.A.: COMPANY SNAPSHOT
  • TABLE 113. AIR LIQUIDE S.A.: OPERATING SEGMENTS
  • TABLE 114. AIR LIQUIDE S.A.: PRODUCT PORTFOLIO
  • TABLE 115. AIR LIQUIDE S.A.: KEY STRATEGIC MOVES AND DEVELOPMENTS
  • TABLE 116. PRAXAIR, INC.: KEY EXECUTIVES
  • TABLE 117. PRAXAIR, INC.: COMPANY SNAPSHOT
  • TABLE 118. PRAXAIR, INC.: OPERATING SEGMENTS
  • TABLE 119. PRAXAIR, INC.: PRODUCT PORTFOLIO
  • TABLE 120. PRAXAIR, INC.: KEY STRATEGIC MOVES AND DEVELOPMENTS
  • TABLE 121. AIR PRODUCTS AND CHEMICALS, INC.: KEY EXECUTIVES
  • TABLE 122. AIR PRODUCTS AND CHEMICALS, INC.: COMPANY SNAPSHOT
  • TABLE 123. AIR PRODUCTS AND CHEMICALS, INC.: OPERATING SEGMENTS
  • TABLE 124. AIR PRODUCTS AND CHEMICALS, INC.: PRODUCT PORTFOLIO
  • TABLE 125. AIR PRODUCTS AND CHEMICALS, INC.: KEY STRATEGIC MOVES AND DEVELOPMENTS
  • TABLE 126. TAIYO NIPPON SANSO CORPORATION: KEY EXECUTIVES
  • TABLE 127. TAIYO NIPPON SANSO CORPORATION: COMPANY SNAPSHOT
  • TABLE 128. TAIYO NIPPON SANSO CORPORATION: OPERATING SEGMENTS
  • TABLE 129. TAIYO NIPPON SANSO CORPORATION: PRODUCT PORTFOLIO
  • TABLE 130. TAIYO NIPPON SANSO CORPORATION: KEY STRATEGIC MOVES AND DEVELOPMENTS
  • TABLE 131. MESSER GROUP GMBH: KEY EXECUTIVES
  • TABLE 132. MESSER GROUP GMBH: COMPANY SNAPSHOT
  • TABLE 133. MESSER GROUP GMBH: OPERATING SEGMENTS
  • TABLE 134. MESSER GROUP GMBH: PRODUCT PORTFOLIO
  • TABLE 135. MESSER GROUP GMBH: KEY STRATEGIC MOVES AND DEVELOPMENTS
  • TABLE 136. SICHUAN AIR SEPARATION PLANT GROUP: KEY EXECUTIVES
  • TABLE 137. SICHUAN AIR SEPARATION PLANT GROUP: COMPANY SNAPSHOT
  • TABLE 138. SICHUAN AIR SEPARATION PLANT GROUP: OPERATING SEGMENTS
  • TABLE 139. SICHUAN AIR SEPARATION PLANT GROUP: PRODUCT PORTFOLIO
  • TABLE 140. SICHUAN AIR SEPARATION PLANT GROUP: KEY STRATEGIC MOVES AND DEVELOPMENTS
  • TABLE 141. UNIVERSAL INDUSTRIAL GASES: KEY EXECUTIVES
  • TABLE 142. UNIVERSAL INDUSTRIAL GASES: COMPANY SNAPSHOT
  • TABLE 143. UNIVERSAL INDUSTRIAL GASES: OPERATING SEGMENTS
  • TABLE 144. UNIVERSAL INDUSTRIAL GASES: PRODUCT PORTFOLIO
  • TABLE 145. UNIVERSAL INDUSTRIAL GASES: KEY STRATEGIC MOVES AND DEVELOPMENTS
  • TABLE 146. TECHNEX LTD.: KEY EXECUTIVES
  • TABLE 147. TECHNEX LTD.: COMPANY SNAPSHOT
  • TABLE 148. TECHNEX LTD.: OPERATING SEGMENTS
  • TABLE 149. TECHNEX LTD.: PRODUCT PORTFOLIO
  • TABLE 150. TECHNEX LTD.: KEY STRATEGIC MOVES AND DEVELOPMENTS
  • LIST OF FIGURES

  • FIGURE 1. GLOBAL AIR SEPARATION UNIT MARKET SEGMENTATION
  • FIGURE 2. GLOBAL AIR SEPARATION UNIT MARKET
  • FIGURE 3. SEGMENTATION AIR SEPARATION UNIT MARKET
  • FIGURE 4. TOP INVESTMENT POCKET IN AIR SEPARATION UNIT MARKET
  • FIGURE 5. MODERATE BARGAINING POWER OF BUYERS
  • FIGURE 6. MODERATE BARGAINING POWER OF SUPPLIERS
  • FIGURE 7. MODERATE THREAT OF NEW ENTRANTS
  • FIGURE 8. LOW THREAT OF SUBSTITUTION
  • FIGURE 9. HIGH COMPETITIVE RIVALRY
  • FIGURE 10. OPPORTUNITIES, RESTRAINTS AND DRIVERS: GLOBALAIR SEPARATION UNIT MARKET
  • FIGURE 11. AIR SEPARATION UNIT MARKET SEGMENTATION, BY BY PROCESS
  • FIGURE 12. AIR SEPARATION UNIT MARKET FOR CRYOGENIC DISTILLATION, BY COUNTRY, 2022-2032 ($MILLION)
  • FIGURE 13. AIR SEPARATION UNIT MARKET FOR NON-CRYOGENIC DISTILLATION, BY COUNTRY, 2022-2032 ($MILLION)
  • FIGURE 14. AIR SEPARATION UNIT MARKET SEGMENTATION, BY BY GAS
  • FIGURE 15. AIR SEPARATION UNIT MARKET FOR NITROGEN, BY COUNTRY, 2022-2032 ($MILLION)
  • FIGURE 16. AIR SEPARATION UNIT MARKET FOR OXYGEN, BY COUNTRY, 2022-2032 ($MILLION)
  • FIGURE 17. AIR SEPARATION UNIT MARKET FOR ARGON, BY COUNTRY, 2022-2032 ($MILLION)
  • FIGURE 18. AIR SEPARATION UNIT MARKET FOR OTHERS, BY COUNTRY, 2022-2032 ($MILLION)
  • FIGURE 19. AIR SEPARATION UNIT MARKET SEGMENTATION, BY BY END USER
  • FIGURE 20. AIR SEPARATION UNIT MARKET FOR CHEMICAL, BY COUNTRY, 2022-2032 ($MILLION)
  • FIGURE 21. AIR SEPARATION UNIT MARKET FOR OIL GAS, BY COUNTRY, 2022-2032 ($MILLION)
  • FIGURE 22. AIR SEPARATION UNIT MARKET FOR IRON STEEL, BY COUNTRY, 2022-2032 ($MILLION)
  • FIGURE 23. AIR SEPARATION UNIT MARKET FOR OTHERS, BY COUNTRY, 2022-2032 ($MILLION)
  • FIGURE 24. TOP WINNING STRATEGIES, BY YEAR, 2020-2022*
  • FIGURE 25. TOP WINNING STRATEGIES, BY DEVELOPMENT, 2020-2022*
  • FIGURE 26. TOP WINNING STRATEGIES, BY COMPANY, 2020-2022*
  • FIGURE 27. PRODUCT MAPPING OF TOP 10 PLAYERS
  • FIGURE 28. COMPETITIVE DASHBOARD
  • FIGURE 29. COMPETITIVE HEATMAP: AIR SEPARATION UNIT MARKET
  • FIGURE 30. Top player positioning, 2022
  • FIGURE 31. LINDE AG: NET SALES, 2020-2022 ($MILLION)
  • FIGURE 32. LINDE AG: REVENUE SHARE, BY SEGMENT, 2032 (%)
  • FIGURE 33. LINDE AG: REVENUE SHARE, BY REGION, 2032 (%)
  • FIGURE 34. AIR LIQUIDE S.A.: NET SALES, 2020-2022 ($MILLION)
  • FIGURE 35. AIR LIQUIDE S.A.: REVENUE SHARE, BY SEGMENT, 2032 (%)
  • FIGURE 36. AIR LIQUIDE S.A.: REVENUE SHARE, BY REGION, 2032 (%)
  • FIGURE 37. PRAXAIR, INC.: NET SALES, 2020-2022 ($MILLION)
  • FIGURE 38. PRAXAIR, INC.: REVENUE SHARE, BY SEGMENT, 2032 (%)
  • FIGURE 39. PRAXAIR, INC.: REVENUE SHARE, BY REGION, 2032 (%)
  • FIGURE 40. AIR PRODUCTS AND CHEMICALS, INC.: NET SALES, 2020-2022 ($MILLION)
  • FIGURE 41. AIR PRODUCTS AND CHEMICALS, INC.: REVENUE SHARE, BY SEGMENT, 2032 (%)
  • FIGURE 42. AIR PRODUCTS AND CHEMICALS, INC.: REVENUE SHARE, BY REGION, 2032 (%)
  • FIGURE 43. TAIYO NIPPON SANSO CORPORATION: NET SALES, 2020-2022 ($MILLION)
  • FIGURE 44. TAIYO NIPPON SANSO CORPORATION: REVENUE SHARE, BY SEGMENT, 2032 (%)
  • FIGURE 45. TAIYO NIPPON SANSO CORPORATION: REVENUE SHARE, BY REGION, 2032 (%)
  • FIGURE 46. MESSER GROUP GMBH: NET SALES, 2020-2022 ($MILLION)
  • FIGURE 47. MESSER GROUP GMBH: REVENUE SHARE, BY SEGMENT, 2032 (%)
  • FIGURE 48. MESSER GROUP GMBH: REVENUE SHARE, BY REGION, 2032 (%)
  • FIGURE 49. SICHUAN AIR SEPARATION PLANT GROUP: NET SALES, 2020-2022 ($MILLION)
  • FIGURE 50. SICHUAN AIR SEPARATION PLANT GROUP: REVENUE SHARE, BY SEGMENT, 2032 (%)
  • FIGURE 51. SICHUAN AIR SEPARATION PLANT GROUP: REVENUE SHARE, BY REGION, 2032 (%)
  • FIGURE 52. UNIVERSAL INDUSTRIAL GASES: NET SALES, 2020-2022 ($MILLION)
  • FIGURE 53. UNIVERSAL INDUSTRIAL GASES: REVENUE SHARE, BY SEGMENT, 2032 (%)
  • FIGURE 54. UNIVERSAL INDUSTRIAL GASES: REVENUE SHARE, BY REGION, 2032 (%)
  • FIGURE 55. TECHNEX LTD.: NET SALES, 2020-2022 ($MILLION)
  • FIGURE 56. TECHNEX LTD.: REVENUE SHARE, BY SEGMENT, 2032 (%)
  • FIGURE 57. TECHNEX LTD.: REVENUE SHARE, BY REGION, 2032 (%)


With collective industry experience of about 200 years of its analysts and experts, Allied Market Research (AMR) encompasses most infallible research methodology for its market intelligence and industry analysis. We do not only engrave the deepest levels of markets but also sneak through its slimmest details for the purpose of our market estimates and forecasts. Our approach helps in building greater market consensus view for size, shape and industry trends within each industry segment. We carefully factor in industry trends and real developments for identifying key growth factors and future course of the market. Our research proceeds are the resultant of high quality data, expert views and analysis and high value independent opinions. Our research process is designed to deliver balanced view of the global markets and allow stakeholders to make informed decisions.

We offer our clients exhaustive research and analysis based on wide variety of factual inputs, which largely include interviews with industry participants, reliable statistics and regional intelligence. Our in-house industry experts play instrumental role in designing analytic tools and models, tailored to the requirements of particular industry segment. These analytical tools and models sanitize the data & statistics and enhance the accuracy of our recommendations and advice. With AMR’s calibrated research process and 360` degree data-evaluation methodology, our clients are assured of receiving:

  • Consistent, valuable, robust and actionable data & analysis that can easily be referenced for strategic business planning
  • Technologically sophisticated and reliable insights through well audited and veracious research methodology
  • Sovereign research proceeds that present a tangible depiction of marketplace


With a strong methodology we are, therefore, confident that our research and analysis are most reliable and guarantees sound business planning.

Secondary research
We refer a broad array of industry sources for our secondary, which typically include; however, not limited to: Company SEC filings, annual reports, company websites, broker & financial reports and investor presentations for competitive scenario and shape of the industry

  • Patent and regulatory databases for understanding of technical & legal developments
  • Scientific and technical writings for product information and related preemptions
  • Regional government and statistical databases for macro analysis
  • Authentic new articles, web-casts and other related releases for market evaluation
  • Internal and external proprietary databases, key market indicators and relevant press releases for market estimates and forecast


Primary research
Our primary research efforts include reaching out participants through mail, tele-conversations, referrals, professional networks and face-to-face interactions. We are also in professional corporate relations with various companies that allow us greater flexibility for reaching out industry participants and commentators for interviews and discussions, fulfilling following functions:

  • Validates and improves the data quality and strengthens research proceeds
  • Further develops analyst team’s market understanding and expertise
  • Supplies authentic information about market size, share, growth and forecasts


Our primary research interview and discussion panels are typically composed of most experienced industry members. These participants include; however, not limited to:

  • Chief executives and VPs of leading corporations specific to industry
  • Product and sales managers or country heads; channel partners and top level distributors; banking, investments and valuation experts Key opinion leaders (KOLs)


Analyst tools and models
AMR has developed set of analyst tools and data models to supplement and expedite the analysis process. Corresponding to markets, where there is significant lack of information and estimates, AMR’s team of experts and analyst develop specific analyst tools and industry models to translate qualitative and quantitative industry indicators into exact industry estimates. These models also allow analysts to examine the prospects and opportunities prevailing in the market to accurately forecast the course of the market.

PURCHASE OPTIONS

Call or Email us

U.S.-Canada Toll-free: +1-800-792-5285
Int'l : +1-503-894-6022
Europe : +44-845-528-1300
Email : help@alliedmarketresearch.com

Looking for Customization?

 Customization Request

Have a Question?

 Speak with Analyst

Any Confusion?

 Inquire Before Buying

Have a glance of the Report

  Enquiry Now

Purchase Full Report of
Air Separation Unit Market

Start reading.
This Report and over 67,092+ more Reports, Available with Avenue Library. T&C*.

  • Online Only
  • $3,690
  • Online cloud access only
  • Restricted print, copy, paste & download
  • Read only
  • Free industry update
    (Within 180 days)
  • Free report update in next update cycle
  • Data Pack
  • $3,840
  • Restricted to one authorized user
  • One print only
  • Available in
    Excel
  • Free industry update
    (Within 180 days)
  •   Free report update in next update cycle
  • Single User
  • $5,820
  • Restricted to one authorized user
  • One print only
  • Available in
    PDF
  • Free industry update
    (Within 180 days)
  •   Free report update in next update cycle
  • Five Users
  • $6,540
  • Limited to five authorized users
  • Print upto five copies
  • Available in
    PDF
  • Free industry update
    (Within 180 days)
  •   Free report update in next update cycle
  • Enterprise
    License/PDF

  • $9,870
  • Unlimited
    within
    company/enterprise
  • Available in Excel & PDF
  • Free industry update
    (Within 180 days)
  •   Free report update in next update cycle
  • Library
    Membership

  • $999 $ 1,175
    Per User/ Per month/ Billed annually
  • Published Content
    E-access
  • Company Profiles
    E-access
  • Newly Added Content Access
  • 10 PDF
    Downloads
  • 5 Excel Data
    Pack Downloads
  • 250 Company Profiles PDF Downloads
  • Buy Now

*Taxes/Fees, if applicable will be added during checkout. All prices in USD

RELATED REPORTS
 

Why Allied Market Research?


Infallible Methodology

To ensure high-level data integrity, accurate analysis, and impeccable forecasts

Analyst Support

For complete satisfaction

Customization

On-demand customization of scope of the report to exactly meet your needs

TARGETED MARKET VIEW

Targeted market view to provide pertinent information and save time of readers

Get fresh content delivered

Get insights on topics that are crucial for your business. Stay abreast of your interest areas.

Get Industry Data Alerts

Why Allied Market Research?

Infallible Methodology

To ensure high-level data integrity, accurate analysis, and impeccable forecasts

Analyst Support

For complete satisfaction

Customization

On-demand customization of scope of the report to exactly meet your needs

TARGETED MARKET VIEW

Targeted market view to provide pertinent information and save time of readers