0
New
New
2023
Aircraft Galley Market

Aircraft Galley Market

by Galley Type (Standard Galley, Modular Galley, Customized Galley), by Fit (Line Fit, Retro Fit), by Galley Insert (Electrical, Non-Electrical), by Application (Narrow-Body, Wide-Body, Others): Global Opportunity Analysis and Industry Forecast, 2023-2032

Report Code: A10509
Aug 2023 | Pages: 410
Tables: 144
Charts: 69
  • Formats*:

  • pdf

    Single User License, Five User
    License & Enterprise User License

  • xls

    Data Pack Excel License

  • ppt

    It comes with the additional cost
    of $2500.00 contact sales.


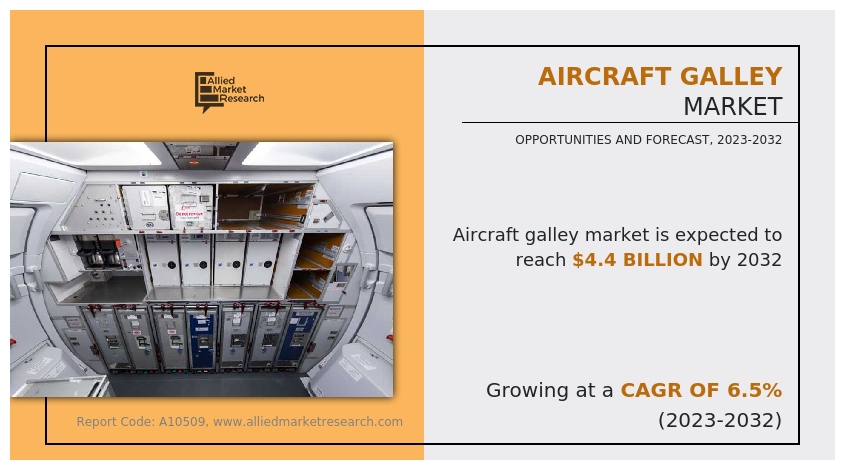
The global aircraft galley market was valued at $2.4 billion in 2022, and is projected to reach $4.4 billion by 2032, growing at a CAGR of 6.5% from 2023 to 2032.

Report Key Highlighters:

  • The aircraft galley market study covers 14 countries. The research includes regional and segment analysis of each country in terms of value ($million) for the projected period 2023-2032.
  • The study integrated high-quality data, professional opinions and analysis, and critical independent perspectives. The research approach is intended to provide a balanced view of global markets and to assist stakeholders in making educated decisions in order to achieve their most ambitious growth objectives.
  • Over 3,700 product literature, annual reports, industry statements, and other comparable materials from major aircraft galley industry participants were reviewed to gain a better understanding of the market.
  • The aircraft galley market share is moderately fragmented, into several players including Aerolux Ltd., AVIC Cabin Systems, Boeing, Bucher Group, Diehl Stiftung & Co. KG, Dynamo Aviation, GAL Aerospace Group, JAMCO Corporation, RTX and Safran. The companies have adopted strategies such as product launch, contract, expansion, agreement, and others to improve their market positioning.
Aircraft Galley Market

An aircraft galley refers to the kitchen area onboard an aircraft where food and beverages are prepared, stored, and sometimes even heated before being served to passengers and crew during a flight. The galley is an essential component of an aircraft's interior, especially on longer flights where passengers are provided with meals and refreshments. Galleys are equipped with various appliances and equipment necessary for meal preparation and service, such as ovens, microwaves, coffee makers, refrigerators, and storage compartments for food, beverages, and utensils. The design and layout of galleys can vary depending on the type of aircraft and the airline's specific requirements. They are typically located in specific sections of the aircraft, often near the front or rear, depending on the aircraft's configuration.

The global adoption of aircraft galley has been driven by the necessity to cater to passenger needs, the provision of in-flight services, and the efficient utilization of space within aircraft. As air travel became a fundamental mode of transportation, the demand for onboard amenities like meals and beverages led to the integration of galleys. Additionally, airlines recognized the economic benefits of offering these services, contributing to passenger satisfaction and potentially generating additional revenue streams. Consequently, aircraft galleys have become integral components of commercial aviation, enhancing the overall travel experience for passengers while serving as a strategic element for airlines' operational success.

Furthermore, in 2022, air passenger traffic experienced a further boost as restrictions were completely lifted. Recent reports from the International Air Transport Association (IATA) indicate that air passenger traffic in March 2022 exceeded that of March 2021 by over 76%. This heightened air passenger traffic prompted numerous airlines to expand their fleet sizes and modernize their existing aircraft.
Aircraft Galley Market

In 2021, Airbus achieved a delivery milestone of 611 commercial aircraft, surpassing its output from the preceding year, 2020. Concurrently, Boeing's aircraft deliveries for 2021 reached 340, nearly doubling its output compared to the 157 aircraft delivered in 2020. These aircraft are equipped with galleys designed to accommodate a diverse array of passengers' culinary preferences, thus necessitating the incorporation of advanced galley features like espresso machines and wine-chilling units. As airlines view distinctive services as a means to bolster their market presence and brand reputation, the acquisition of next-generation aircraft is anticipated to propel the integration of sophisticated aircraft galleys, consequently augmenting the business opportunities within the aircraft galley market.

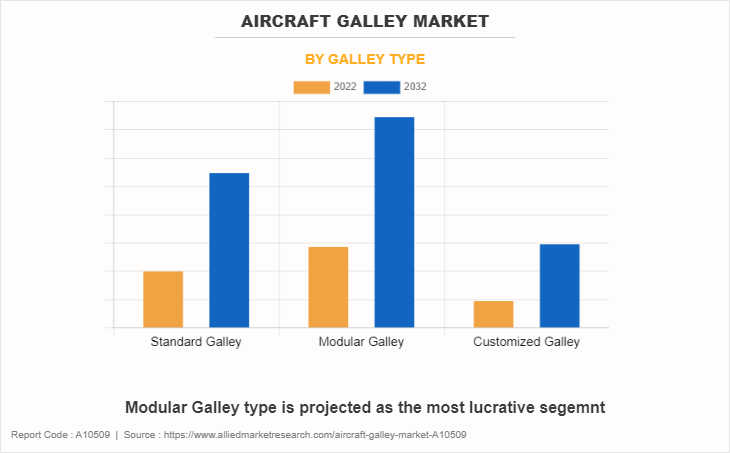
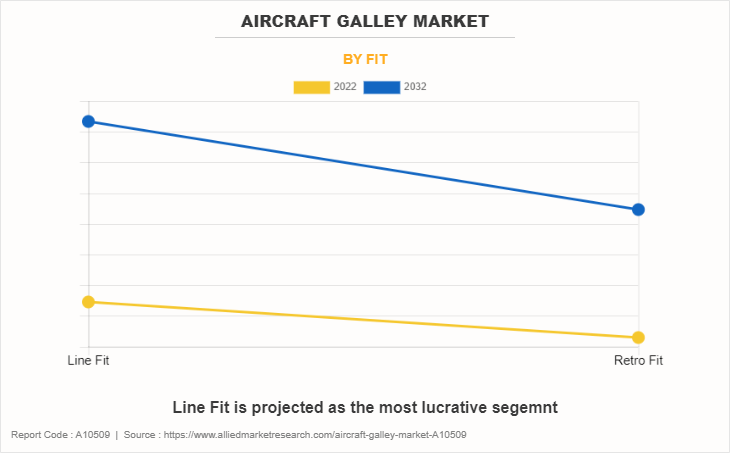
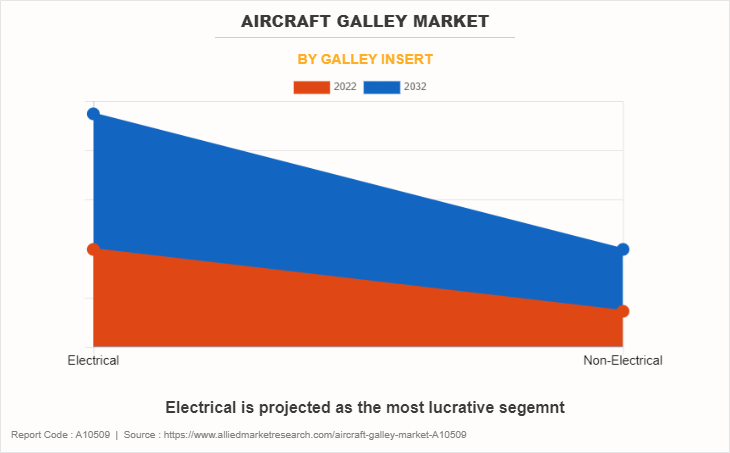
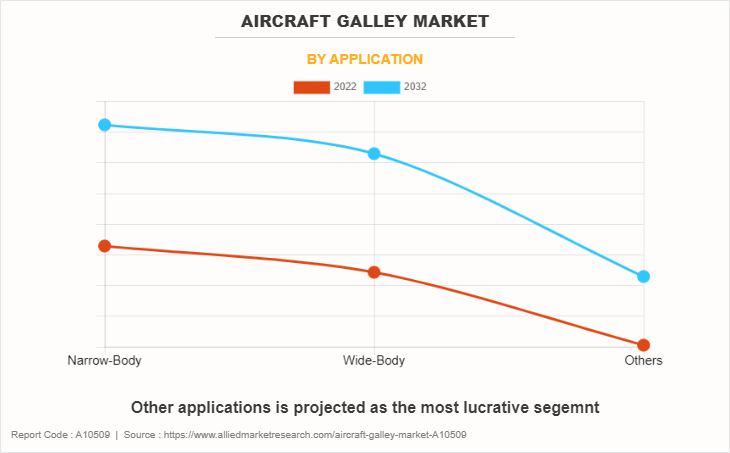
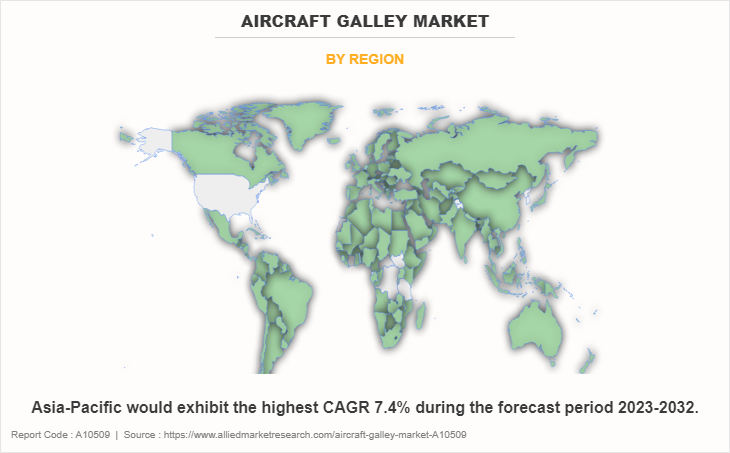
The global aircraft galley market is segmented on the basis of galley type, fit, insert, application and region. By galley type, the market is segmented into Standard Galley, Modular Galley and Customized Galley. Further, based on fit, the market is segmented into line fit and retro fit. Based on insert, the market is segmented into electric and non-electric insert. By application, the market is segmented into narrow-body, wide-body and others. Region-wise, the market is segmented into North America, Europe, Asia-Pacific, Latin America, Middle East & Africa (LAMEA) including country-level analysis for each region.

The aircraft galley market in North America has witnessed significant growth and is poised to offer compelling opportunities in the coming years. The increasing focus on sustainability and efficiency. Airlines in North America are looking for galley equipment that not only enhances passenger comfort and service but also minimizes waste, reduces energy consumption, and lowers overall operational costs. This trend aligns with the broader aviation industry's commitment to environmental sustainability.
Aircraft Galley Market

In addition, the integration of advanced technology into aircraft galleys. This includes the adoption of smart galley solutions that use data analytics and automation to optimize catering operations. These technologies can help airlines improve inventory management, reduce food wastage, and enhance the overall passenger experience. The concept of the low-cost carrier (LCC) model revolves around maximizing the passenger count on flights and offering minimal services for which passengers pay as needed. The growing worldwide presence of LCCs has brought about design difficulties in adapting to the limited space within aircraft cabins. This has compelled galley designers to downsize and lighten the galley equipment. The manufacturers in the aircraft galley market face definite hurdles in terms of technological intricacies and design intricacies.

Furthermore, the North America aircraft galley market is benefiting from the growing demand for in-flight services and premium experiences. As airlines seek to differentiate themselves and attract passengers, they are investing in upgraded galleys that can offer a wide range of culinary options, including gourmet meals and specialty beverages. This trend creates opportunities for galley equipment manufacturers to develop innovative and luxurious solutions.
Aircraft Galley Market

Key Developments

The leading companies are adopting strategies such as acquisition, agreement, expansion, partnership, contracts, and product launches to strengthen their market position.

  • In June 2023, RTX (Raytheon Technologies) through its subsidiary Collins Aerospace introduced a cost-effective wireless connectivity solution for airplane galley inserts (the appliances used to prepare inflight food and beverage). It provides operational efficiencies and cost savings for airlines while also supporting improved passenger service.
  • In November 2022, Bucher Group signed an agreement with Deutsche aircraft to supply Galleys and Partitions for the new D328ecoTM cabin. This strategic move plays a key development & manufacturing role in Deutsche Aircraft’s new eco-efficient airplane.
  • In July 2021, Diehl Stiftung & Co. KG signed an agreement with HAECO Cabin Solutions (HCS) in the field of upgrade solutions for commercial aircraft cabins. It covers floor-to-floor interior components, cabin lighting, galleys, lavatories, seating, reconfiguration engineering, certification, and installation for cabin upgrade requirements of airlines and MRO providers.
  • In September 2020, AVIC Cabin Systems through its subsidiary AIM Altitude developed & modernize the aircraft galley and is being hailed as a solution towards increased flight hygiene.

Shift in preference to provide enhanced passenger comfort

The aviation industry has witnessed a notable shift in focus towards enhancing passenger comfort and experience, which in turn is driving significant growth in the aircraft galley market. Airlines recognize that providing a comfortable and enjoyable journey is a key factor in attracting and retaining passengers. This shift has led to increased demand for modern, well-equipped galleys that can cater to passengers' culinary preferences and dietary requirements. Airlines are now offering more diverse and higher-quality in-flight meals, including options for special diets and premium dining experiences. For instance, in August 2022, Emirates invested over $2 billion to enhance its in-flight customer experience. Customers can savor unlimited portions of Persian caviar as part of the ‘dine on demand’ service, with an exquisite pairing of the world-renowned Dom Perignon vintage champagne. Emirates is the only airline with an exclusive agreement to offer the luxury brand on board.

To meet these expectations, aircraft galley manufacturers are developing innovative solutions such as compact ovens that can quickly heat and serve a variety of dishes while optimizing space efficiency. These enhanced galley setups not only enable airlines to provide exceptional dining experiences but also contribute to passengers' overall satisfaction, leading to repeat business and positive word-of-mouth recommendations.

Growth in Air Passenger Traffic

The substantial growth in air passenger traffic over the years has played a pivotal role in driving significant expansion within the aircraft galley market. As more individuals opt for air travel as their preferred mode of transportation, airlines are compelled to adapt and cater to the evolving demands of their passengers. This surge in passenger numbers has spurred airlines to invest in expanding their fleets and enhancing the overall onboard experience. This in turn, has propelled the demand for modern, efficient, and technologically advanced aircraft galleys that can cater to the increased number of passengers. For instance, in 2022, there was a notable increase in air passenger traffic following the complete relaxation of restrictions. Recent updates from the International Air Transport Association (IATA) reveal that air passenger traffic during March 2022 exceeded 76% in comparison to the corresponding period in March 2021. This surge in air passenger traffic prompted numerous airlines to expand their fleet capacity and implement modernization measures on their existing aircraft.
Aircraft Galley Market

Strict Regulations and Delayed Certifications

When building the interior system and components of an airplane, weight and safety are two crucial considerations. The weight of the aircraft may be increased by the use of traditional materials and components in the development of this system. Therefore, the 16G seat standards that strengthen the protection against head injuries were established by internationally authorized agencies in order to prevent accidents and promote passenger safety. The cost of product development is also being increased by the use of fire-retardant materials and improved test standards for components such as galleys, seats, ceilings, partitions, and stowage bins, among others. The production costs of these interior producers rise as a result of strict aviation standards. It is projected that rising production and raw material costs are anticipated to impede market expansion. However, it is anticipated that the development of aircraft interior parts using composite materials and additive manufacturing processes would result in lower production costs and new business opportunities for OEMs.

The certification process for IFEC systems is exhaustive due to the long time for the approval process and the high costs of IFEC systems. In addition, the IFEC system must be connected to a power rail to ensure a safe landing of an aircraft. This procedure requires approval from the FAA. Thus, these regulatory frameworks and certifications are expected to ultimately curb the growth of the aircraft galley market.
Aircraft Galley Market

Innovations in Galley Equipment

The traditional concept of aircraft galleys, primarily focused on functionality and space optimization, has evolved into a realm of cutting-edge technologies and passenger-centric designs. With airlines increasingly emphasizing the passenger experience as a competitive edge, the demand for galley equipment that not only streamlines operations but also enhances in-flight service quality has surged. Modern galley solutions now incorporate state-of-the-art materials, modular configurations, and advanced automation. These innovations enable airlines to efficiently manage catering, reduce turnaround times and offer a diverse range of culinary options to passengers. For instance, in June 2023, Collins Aerospace, a Raytheon Technologies business, introduced a cost-effective wireless connectivity solution for airplane galley inserts (the appliances used to prepare inflight food and beverage), providing operational efficiencies and cost savings for airlines while also supporting improved passenger service.

Additionally, ergonomic layouts and creative space utilization have led to improved crew efficiency, further driving operational excellence. As airlines struggle to attract travelers, the appeal of onboard gourmet experiences and seamless service has heightened, propelling the growth of the aircraft galley market. This evolution presents a golden opportunity for manufacturers and suppliers to capitalize on the rising demand for innovative galley equipment, fostering a dynamic landscape where technological advancements intersect with heightened passenger expectations.

The conflict has led to geopolitical tensions, airspace closures, and regulatory uncertainties, all of which have disrupted normal aviation operations and caused shifts in industry dynamics. The conflict has resulted in the closure of airspace and restrictions on flight routes in the affected region, forcing airlines to alter flight paths and schedules. This has led to increased operational costs, flight delays, and decreased efficiency for airlines operating in or flying over the conflict zone. Airlines might hesitate to invest in new aircraft or upgrades during times of uncertainty, affecting orders for new aircraft and associated galley equipment. Moreover, the economic consequences of the conflict can lead to reduced passenger demand, affecting overall air travel, which, in turn, affects the need for galley services.

Key Benefits For Stakeholders

  • This report provides a quantitative analysis of the market segments, current trends, estimations, and dynamics of the aircraft galley market analysis from 2022 to 2032 to identify the prevailing aircraft galley market opportunities.
  • The market research is offered along with information related to key drivers, restraints, and opportunities.
  • Porter's five forces analysis highlights the potency of buyers and suppliers to enable stakeholders make profit-oriented business decisions and strengthen their supplier-buyer network.
  • In-depth analysis of the aircraft galley market segmentation assists to determine the prevailing market opportunities.
  • Major countries in each region are mapped according to their revenue contribution to the global market.
  • Market player positioning facilitates benchmarking and provides a clear understanding of the present position of the market players.
  • The report includes the analysis of the regional as well as global aircraft galley market trends, key players, market segments, application areas, and market growth strategies.

Aircraft Galley Market Report Highlights

Aspects Details
Market Size By 2032 USD 4.4 billion
Growth Rate CAGR of 6.5%
Forecast period 2022 - 2032
Report Pages 410
By Galley Type
  • Standard Galley
  • Modular Galley
  • Customized Galley
By Fit
  • Line Fit
  • Retro Fit
By Galley Insert
  • Non-Electrical
  • Electrical
By Application
  • Narrow-Body
  • Wide-Body
  • Others
By Region
  • North America  (U.S., Canada, Mexico)
  • Europe  (UK, Germany, Spain, France, Rest of Europe)
  • Asia-Pacific  (China, India, Japan, South Korea, Rest of Asia-Pacific)
  • LAMEA  (Latin America, Middle East, Africa)
Key Market Players GAL Aerospace, SAFRAN, RTX, Aerolux Ltd, Boeing, Bucher Group, DYNAMO Aviation, Jamco Corporation, AVIC Cabin Systems, Diehl Stiftung & Co. KG
 
  • CHAPTER 1: INTRODUCTION

    • 1.1. Report description

    • 1.2. Key market segments

    • 1.3. Key benefits to the stakeholders

    • 1.4. Research Methodology

      • 1.4.1. Primary research

      • 1.4.2. Secondary research

      • 1.4.3. Analyst tools and models

  • CHAPTER 2: EXECUTIVE SUMMARY

    • 2.1. CXO Perspective

  • CHAPTER 3: MARKET OVERVIEW

    • 3.1. Market definition and scope

    • 3.2. Key findings

      • 3.2.1. Top impacting factors

      • 3.2.2. Top investment pockets

    • 3.3. Porter’s five forces analysis

      • 3.3.1. Low bargaining power of suppliers

      • 3.3.2. Low threat of new entrants

      • 3.3.3. Low threat of substitutes

      • 3.3.4. Low intensity of rivalry

      • 3.3.5. Low bargaining power of buyers

    • 3.4. Market dynamics

      • 3.4.1. Drivers

        • 3.4.1.1. Shift in preference to provide enhanced passenger comfort
        • 3.4.1.2. Growth in Air Passenger Traffic
        • 3.4.1.3. Growing Refurbishment and Renewal of Old Aircraft to Extend Aircraft Life
      • 3.4.2. Restraints

        • 3.4.2.1. Strict Regulations and Delayed Certifications
        • 3.4.2.2. High Initial Costs
      • 3.4.3. Opportunities

        • 3.4.3.1. Innovations in Galley Equipment
        • 3.4.3.2. Growth in Urban Air Mobility (UAM) platform
  • CHAPTER 4: AIRCRAFT GALLEY MARKET, BY GALLEY TYPE

    • 4.1. Overview

      • 4.1.1. Market size and forecast

    • 4.2. Standard Galley

      • 4.2.1. Key market trends, growth factors and opportunities

      • 4.2.2. Market size and forecast, by region

      • 4.2.3. Market share analysis by country

    • 4.3. Modular Galley

      • 4.3.1. Key market trends, growth factors and opportunities

      • 4.3.2. Market size and forecast, by region

      • 4.3.3. Market share analysis by country

    • 4.4. Customized Galley

      • 4.4.1. Key market trends, growth factors and opportunities

      • 4.4.2. Market size and forecast, by region

      • 4.4.3. Market share analysis by country

  • CHAPTER 5: AIRCRAFT GALLEY MARKET, BY FIT

    • 5.1. Overview

      • 5.1.1. Market size and forecast

    • 5.2. Line Fit

      • 5.2.1. Key market trends, growth factors and opportunities

      • 5.2.2. Market size and forecast, by region

      • 5.2.3. Market share analysis by country

    • 5.3. Retro Fit

      • 5.3.1. Key market trends, growth factors and opportunities

      • 5.3.2. Market size and forecast, by region

      • 5.3.3. Market share analysis by country

  • CHAPTER 6: AIRCRAFT GALLEY MARKET, BY GALLEY INSERT

    • 6.1. Overview

      • 6.1.1. Market size and forecast

    • 6.2. Electrical

      • 6.2.1. Key market trends, growth factors and opportunities

      • 6.2.2. Market size and forecast, by region

      • 6.2.3. Market share analysis by country

    • 6.3. Non-Electrical

      • 6.3.1. Key market trends, growth factors and opportunities

      • 6.3.2. Market size and forecast, by region

      • 6.3.3. Market share analysis by country

  • CHAPTER 7: AIRCRAFT GALLEY MARKET, BY APPLICATION

    • 7.1. Overview

      • 7.1.1. Market size and forecast

    • 7.2. Narrow-Body

      • 7.2.1. Key market trends, growth factors and opportunities

      • 7.2.2. Market size and forecast, by region

      • 7.2.3. Market share analysis by country

    • 7.3. Wide-Body

      • 7.3.1. Key market trends, growth factors and opportunities

      • 7.3.2. Market size and forecast, by region

      • 7.3.3. Market share analysis by country

    • 7.4. Others

      • 7.4.1. Key market trends, growth factors and opportunities

      • 7.4.2. Market size and forecast, by region

      • 7.4.3. Market share analysis by country

  • CHAPTER 8: AIRCRAFT GALLEY MARKET, BY REGION

    • 8.1. Overview

      • 8.1.1. Market size and forecast By Region

    • 8.2. North America

      • 8.2.1. Key market trends, growth factors and opportunities

      • 8.2.2. Market size and forecast, by Galley Type

      • 8.2.3. Market size and forecast, by Fit

      • 8.2.4. Market size and forecast, by Galley Insert

      • 8.2.5. Market size and forecast, by Application

      • 8.2.6. Market size and forecast, by country

        • 8.2.6.1. U.S.
          • 8.2.6.1.1. Market size and forecast, by Galley Type
          • 8.2.6.1.2. Market size and forecast, by Fit
          • 8.2.6.1.3. Market size and forecast, by Galley Insert
          • 8.2.6.1.4. Market size and forecast, by Application
        • 8.2.6.2. Canada
          • 8.2.6.2.1. Market size and forecast, by Galley Type
          • 8.2.6.2.2. Market size and forecast, by Fit
          • 8.2.6.2.3. Market size and forecast, by Galley Insert
          • 8.2.6.2.4. Market size and forecast, by Application
        • 8.2.6.3. Mexico
          • 8.2.6.3.1. Market size and forecast, by Galley Type
          • 8.2.6.3.2. Market size and forecast, by Fit
          • 8.2.6.3.3. Market size and forecast, by Galley Insert
          • 8.2.6.3.4. Market size and forecast, by Application
    • 8.3. Europe

      • 8.3.1. Key market trends, growth factors and opportunities

      • 8.3.2. Market size and forecast, by Galley Type

      • 8.3.3. Market size and forecast, by Fit

      • 8.3.4. Market size and forecast, by Galley Insert

      • 8.3.5. Market size and forecast, by Application

      • 8.3.6. Market size and forecast, by country

        • 8.3.6.1. UK
          • 8.3.6.1.1. Market size and forecast, by Galley Type
          • 8.3.6.1.2. Market size and forecast, by Fit
          • 8.3.6.1.3. Market size and forecast, by Galley Insert
          • 8.3.6.1.4. Market size and forecast, by Application
        • 8.3.6.2. Germany
          • 8.3.6.2.1. Market size and forecast, by Galley Type
          • 8.3.6.2.2. Market size and forecast, by Fit
          • 8.3.6.2.3. Market size and forecast, by Galley Insert
          • 8.3.6.2.4. Market size and forecast, by Application
        • 8.3.6.3. Spain
          • 8.3.6.3.1. Market size and forecast, by Galley Type
          • 8.3.6.3.2. Market size and forecast, by Fit
          • 8.3.6.3.3. Market size and forecast, by Galley Insert
          • 8.3.6.3.4. Market size and forecast, by Application
        • 8.3.6.4. France
          • 8.3.6.4.1. Market size and forecast, by Galley Type
          • 8.3.6.4.2. Market size and forecast, by Fit
          • 8.3.6.4.3. Market size and forecast, by Galley Insert
          • 8.3.6.4.4. Market size and forecast, by Application
        • 8.3.6.5. Rest of Europe
          • 8.3.6.5.1. Market size and forecast, by Galley Type
          • 8.3.6.5.2. Market size and forecast, by Fit
          • 8.3.6.5.3. Market size and forecast, by Galley Insert
          • 8.3.6.5.4. Market size and forecast, by Application
    • 8.4. Asia-Pacific

      • 8.4.1. Key market trends, growth factors and opportunities

      • 8.4.2. Market size and forecast, by Galley Type

      • 8.4.3. Market size and forecast, by Fit

      • 8.4.4. Market size and forecast, by Galley Insert

      • 8.4.5. Market size and forecast, by Application

      • 8.4.6. Market size and forecast, by country

        • 8.4.6.1. China
          • 8.4.6.1.1. Market size and forecast, by Galley Type
          • 8.4.6.1.2. Market size and forecast, by Fit
          • 8.4.6.1.3. Market size and forecast, by Galley Insert
          • 8.4.6.1.4. Market size and forecast, by Application
        • 8.4.6.2. India
          • 8.4.6.2.1. Market size and forecast, by Galley Type
          • 8.4.6.2.2. Market size and forecast, by Fit
          • 8.4.6.2.3. Market size and forecast, by Galley Insert
          • 8.4.6.2.4. Market size and forecast, by Application
        • 8.4.6.3. Japan
          • 8.4.6.3.1. Market size and forecast, by Galley Type
          • 8.4.6.3.2. Market size and forecast, by Fit
          • 8.4.6.3.3. Market size and forecast, by Galley Insert
          • 8.4.6.3.4. Market size and forecast, by Application
        • 8.4.6.4. South Korea
          • 8.4.6.4.1. Market size and forecast, by Galley Type
          • 8.4.6.4.2. Market size and forecast, by Fit
          • 8.4.6.4.3. Market size and forecast, by Galley Insert
          • 8.4.6.4.4. Market size and forecast, by Application
        • 8.4.6.5. Rest of Asia-Pacific
          • 8.4.6.5.1. Market size and forecast, by Galley Type
          • 8.4.6.5.2. Market size and forecast, by Fit
          • 8.4.6.5.3. Market size and forecast, by Galley Insert
          • 8.4.6.5.4. Market size and forecast, by Application
    • 8.5. LAMEA

      • 8.5.1. Key market trends, growth factors and opportunities

      • 8.5.2. Market size and forecast, by Galley Type

      • 8.5.3. Market size and forecast, by Fit

      • 8.5.4. Market size and forecast, by Galley Insert

      • 8.5.5. Market size and forecast, by Application

      • 8.5.6. Market size and forecast, by country

        • 8.5.6.1. Latin America
          • 8.5.6.1.1. Market size and forecast, by Galley Type
          • 8.5.6.1.2. Market size and forecast, by Fit
          • 8.5.6.1.3. Market size and forecast, by Galley Insert
          • 8.5.6.1.4. Market size and forecast, by Application
        • 8.5.6.2. Middle East
          • 8.5.6.2.1. Market size and forecast, by Galley Type
          • 8.5.6.2.2. Market size and forecast, by Fit
          • 8.5.6.2.3. Market size and forecast, by Galley Insert
          • 8.5.6.2.4. Market size and forecast, by Application
        • 8.5.6.3. Africa
          • 8.5.6.3.1. Market size and forecast, by Galley Type
          • 8.5.6.3.2. Market size and forecast, by Fit
          • 8.5.6.3.3. Market size and forecast, by Galley Insert
          • 8.5.6.3.4. Market size and forecast, by Application
  • CHAPTER 9: COMPETITIVE LANDSCAPE

    • 9.1. Introduction

    • 9.2. Top winning strategies

    • 9.3. Product Mapping of Top 10 Player

    • 9.4. Competitive Dashboard

    • 9.5. Competitive Heatmap

    • 9.6. Top player positioning, 2022

  • CHAPTER 10: COMPANY PROFILES

    • 10.1. Aerolux Ltd

      • 10.1.1. Company overview

      • 10.1.2. Key Executives

      • 10.1.3. Company snapshot

      • 10.1.4. Operating business segments

      • 10.1.5. Product portfolio

    • 10.2. AVIC Cabin Systems

      • 10.2.1. Company overview

      • 10.2.2. Key Executives

      • 10.2.3. Company snapshot

      • 10.2.4. Operating business segments

      • 10.2.5. Product portfolio

      • 10.2.6. Key strategic moves and developments

    • 10.3. Boeing

      • 10.3.1. Company overview

      • 10.3.2. Key Executives

      • 10.3.3. Company snapshot

      • 10.3.4. Operating business segments

      • 10.3.5. Product portfolio

      • 10.3.6. Business performance

    • 10.4. Bucher Group

      • 10.4.1. Company overview

      • 10.4.2. Key Executives

      • 10.4.3. Company snapshot

      • 10.4.4. Operating business segments

      • 10.4.5. Product portfolio

      • 10.4.6. Business performance

      • 10.4.7. Key strategic moves and developments

    • 10.5. Diehl Stiftung & Co. KG

      • 10.5.1. Company overview

      • 10.5.2. Key Executives

      • 10.5.3. Company snapshot

      • 10.5.4. Operating business segments

      • 10.5.5. Product portfolio

      • 10.5.6. Business performance

      • 10.5.7. Key strategic moves and developments

    • 10.6. DYNAMO Aviation

      • 10.6.1. Company overview

      • 10.6.2. Key Executives

      • 10.6.3. Company snapshot

      • 10.6.4. Operating business segments

      • 10.6.5. Product portfolio

    • 10.7. GAL Aerospace

      • 10.7.1. Company overview

      • 10.7.2. Key Executives

      • 10.7.3. Company snapshot

      • 10.7.4. Operating business segments

      • 10.7.5. Product portfolio

    • 10.8. Jamco Corporation

      • 10.8.1. Company overview

      • 10.8.2. Key Executives

      • 10.8.3. Company snapshot

      • 10.8.4. Operating business segments

      • 10.8.5. Product portfolio

      • 10.8.6. Business performance

    • 10.9. SAFRAN

      • 10.9.1. Company overview

      • 10.9.2. Key Executives

      • 10.9.3. Company snapshot

      • 10.9.4. Operating business segments

      • 10.9.5. Product portfolio

      • 10.9.6. Business performance

      • 10.9.7. Key strategic moves and developments

    • 10.10. RTX

      • 10.10.1. Company overview

      • 10.10.2. Key Executives

      • 10.10.3. Company snapshot

      • 10.10.4. Operating business segments

      • 10.10.5. Product portfolio

      • 10.10.6. Business performance

      • 10.10.7. Key strategic moves and developments

  • LIST OF TABLES

  • TABLE 01. GLOBAL AIRCRAFT GALLEY MARKET, BY GALLEY TYPE, 2022-2032 ($MILLION)
    TABLE 02. AIRCRAFT GALLEY MARKET FOR STANDARD GALLEY, BY REGION, 2022-2032 ($MILLION)
    TABLE 03. AIRCRAFT GALLEY MARKET FOR MODULAR GALLEY, BY REGION, 2022-2032 ($MILLION)
    TABLE 04. AIRCRAFT GALLEY MARKET FOR CUSTOMIZED GALLEY, BY REGION, 2022-2032 ($MILLION)
    TABLE 05. GLOBAL AIRCRAFT GALLEY MARKET, BY FIT, 2022-2032 ($MILLION)
    TABLE 06. AIRCRAFT GALLEY MARKET FOR LINE FIT, BY REGION, 2022-2032 ($MILLION)
    TABLE 07. AIRCRAFT GALLEY MARKET FOR RETRO FIT, BY REGION, 2022-2032 ($MILLION)
    TABLE 08. GLOBAL AIRCRAFT GALLEY MARKET, BY GALLEY INSERT, 2022-2032 ($MILLION)
    TABLE 09. AIRCRAFT GALLEY MARKET FOR ELECTRICAL, BY REGION, 2022-2032 ($MILLION)
    TABLE 10. AIRCRAFT GALLEY MARKET FOR NON-ELECTRICAL, BY REGION, 2022-2032 ($MILLION)
    TABLE 11. GLOBAL AIRCRAFT GALLEY MARKET, BY APPLICATION, 2022-2032 ($MILLION)
    TABLE 12. AIRCRAFT GALLEY MARKET FOR NARROW-BODY, BY REGION, 2022-2032 ($MILLION)
    TABLE 13. AIRCRAFT GALLEY MARKET FOR WIDE-BODY, BY REGION, 2022-2032 ($MILLION)
    TABLE 14. AIRCRAFT GALLEY MARKET FOR OTHERS, BY REGION, 2022-2032 ($MILLION)
    TABLE 15. AIRCRAFT GALLEY MARKET, BY REGION, 2022-2032 ($MILLION)
    TABLE 16. NORTH AMERICA AIRCRAFT GALLEY MARKET, BY GALLEY TYPE, 2022-2032 ($MILLION)
    TABLE 17. NORTH AMERICA AIRCRAFT GALLEY MARKET, BY FIT, 2022-2032 ($MILLION)
    TABLE 18. NORTH AMERICA AIRCRAFT GALLEY MARKET, BY GALLEY INSERT, 2022-2032 ($MILLION)
    TABLE 19. NORTH AMERICA AIRCRAFT GALLEY MARKET, BY APPLICATION, 2022-2032 ($MILLION)
    TABLE 20. NORTH AMERICA AIRCRAFT GALLEY MARKET, BY COUNTRY, 2022-2032 ($MILLION)
    TABLE 21. U.S. AIRCRAFT GALLEY MARKET, BY GALLEY TYPE, 2022-2032 ($MILLION)
    TABLE 22. U.S. AIRCRAFT GALLEY MARKET, BY FIT, 2022-2032 ($MILLION)
    TABLE 23. U.S. AIRCRAFT GALLEY MARKET, BY GALLEY INSERT, 2022-2032 ($MILLION)
    TABLE 24. U.S. AIRCRAFT GALLEY MARKET, BY APPLICATION, 2022-2032 ($MILLION)
    TABLE 25. CANADA AIRCRAFT GALLEY MARKET, BY GALLEY TYPE, 2022-2032 ($MILLION)
    TABLE 26. CANADA AIRCRAFT GALLEY MARKET, BY FIT, 2022-2032 ($MILLION)
    TABLE 27. CANADA AIRCRAFT GALLEY MARKET, BY GALLEY INSERT, 2022-2032 ($MILLION)
    TABLE 28. CANADA AIRCRAFT GALLEY MARKET, BY APPLICATION, 2022-2032 ($MILLION)
    TABLE 29. MEXICO AIRCRAFT GALLEY MARKET, BY GALLEY TYPE, 2022-2032 ($MILLION)
    TABLE 30. MEXICO AIRCRAFT GALLEY MARKET, BY FIT, 2022-2032 ($MILLION)
    TABLE 31. MEXICO AIRCRAFT GALLEY MARKET, BY GALLEY INSERT, 2022-2032 ($MILLION)
    TABLE 32. MEXICO AIRCRAFT GALLEY MARKET, BY APPLICATION, 2022-2032 ($MILLION)
    TABLE 33. EUROPE AIRCRAFT GALLEY MARKET, BY GALLEY TYPE, 2022-2032 ($MILLION)
    TABLE 34. EUROPE AIRCRAFT GALLEY MARKET, BY FIT, 2022-2032 ($MILLION)
    TABLE 35. EUROPE AIRCRAFT GALLEY MARKET, BY GALLEY INSERT, 2022-2032 ($MILLION)
    TABLE 36. EUROPE AIRCRAFT GALLEY MARKET, BY APPLICATION, 2022-2032 ($MILLION)
    TABLE 37. EUROPE AIRCRAFT GALLEY MARKET, BY COUNTRY, 2022-2032 ($MILLION)
    TABLE 38. UK AIRCRAFT GALLEY MARKET, BY GALLEY TYPE, 2022-2032 ($MILLION)
    TABLE 39. UK AIRCRAFT GALLEY MARKET, BY FIT, 2022-2032 ($MILLION)
    TABLE 40. UK AIRCRAFT GALLEY MARKET, BY GALLEY INSERT, 2022-2032 ($MILLION)
    TABLE 41. UK AIRCRAFT GALLEY MARKET, BY APPLICATION, 2022-2032 ($MILLION)
    TABLE 42. GERMANY AIRCRAFT GALLEY MARKET, BY GALLEY TYPE, 2022-2032 ($MILLION)
    TABLE 43. GERMANY AIRCRAFT GALLEY MARKET, BY FIT, 2022-2032 ($MILLION)
    TABLE 44. GERMANY AIRCRAFT GALLEY MARKET, BY GALLEY INSERT, 2022-2032 ($MILLION)
    TABLE 45. GERMANY AIRCRAFT GALLEY MARKET, BY APPLICATION, 2022-2032 ($MILLION)
    TABLE 46. SPAIN AIRCRAFT GALLEY MARKET, BY GALLEY TYPE, 2022-2032 ($MILLION)
    TABLE 47. SPAIN AIRCRAFT GALLEY MARKET, BY FIT, 2022-2032 ($MILLION)
    TABLE 48. SPAIN AIRCRAFT GALLEY MARKET, BY GALLEY INSERT, 2022-2032 ($MILLION)
    TABLE 49. SPAIN AIRCRAFT GALLEY MARKET, BY APPLICATION, 2022-2032 ($MILLION)
    TABLE 50. FRANCE AIRCRAFT GALLEY MARKET, BY GALLEY TYPE, 2022-2032 ($MILLION)
    TABLE 51. FRANCE AIRCRAFT GALLEY MARKET, BY FIT, 2022-2032 ($MILLION)
    TABLE 52. FRANCE AIRCRAFT GALLEY MARKET, BY GALLEY INSERT, 2022-2032 ($MILLION)
    TABLE 53. FRANCE AIRCRAFT GALLEY MARKET, BY APPLICATION, 2022-2032 ($MILLION)
    TABLE 54. REST OF EUROPE AIRCRAFT GALLEY MARKET, BY GALLEY TYPE, 2022-2032 ($MILLION)
    TABLE 55. REST OF EUROPE AIRCRAFT GALLEY MARKET, BY FIT, 2022-2032 ($MILLION)
    TABLE 56. REST OF EUROPE AIRCRAFT GALLEY MARKET, BY GALLEY INSERT, 2022-2032 ($MILLION)
    TABLE 57. REST OF EUROPE AIRCRAFT GALLEY MARKET, BY APPLICATION, 2022-2032 ($MILLION)
    TABLE 58. ASIA-PACIFIC AIRCRAFT GALLEY MARKET, BY GALLEY TYPE, 2022-2032 ($MILLION)
    TABLE 59. ASIA-PACIFIC AIRCRAFT GALLEY MARKET, BY FIT, 2022-2032 ($MILLION)
    TABLE 60. ASIA-PACIFIC AIRCRAFT GALLEY MARKET, BY GALLEY INSERT, 2022-2032 ($MILLION)
    TABLE 61. ASIA-PACIFIC AIRCRAFT GALLEY MARKET, BY APPLICATION, 2022-2032 ($MILLION)
    TABLE 62. ASIA-PACIFIC AIRCRAFT GALLEY MARKET, BY COUNTRY, 2022-2032 ($MILLION)
    TABLE 63. CHINA AIRCRAFT GALLEY MARKET, BY GALLEY TYPE, 2022-2032 ($MILLION)
    TABLE 64. CHINA AIRCRAFT GALLEY MARKET, BY FIT, 2022-2032 ($MILLION)
    TABLE 65. CHINA AIRCRAFT GALLEY MARKET, BY GALLEY INSERT, 2022-2032 ($MILLION)
    TABLE 66. CHINA AIRCRAFT GALLEY MARKET, BY APPLICATION, 2022-2032 ($MILLION)
    TABLE 67. INDIA AIRCRAFT GALLEY MARKET, BY GALLEY TYPE, 2022-2032 ($MILLION)
    TABLE 68. INDIA AIRCRAFT GALLEY MARKET, BY FIT, 2022-2032 ($MILLION)
    TABLE 69. INDIA AIRCRAFT GALLEY MARKET, BY GALLEY INSERT, 2022-2032 ($MILLION)
    TABLE 70. INDIA AIRCRAFT GALLEY MARKET, BY APPLICATION, 2022-2032 ($MILLION)
    TABLE 71. JAPAN AIRCRAFT GALLEY MARKET, BY GALLEY TYPE, 2022-2032 ($MILLION)
    TABLE 72. JAPAN AIRCRAFT GALLEY MARKET, BY FIT, 2022-2032 ($MILLION)
    TABLE 73. JAPAN AIRCRAFT GALLEY MARKET, BY GALLEY INSERT, 2022-2032 ($MILLION)
    TABLE 74. JAPAN AIRCRAFT GALLEY MARKET, BY APPLICATION, 2022-2032 ($MILLION)
    TABLE 75. SOUTH KOREA AIRCRAFT GALLEY MARKET, BY GALLEY TYPE, 2022-2032 ($MILLION)
    TABLE 76. SOUTH KOREA AIRCRAFT GALLEY MARKET, BY FIT, 2022-2032 ($MILLION)
    TABLE 77. SOUTH KOREA AIRCRAFT GALLEY MARKET, BY GALLEY INSERT, 2022-2032 ($MILLION)
    TABLE 78. SOUTH KOREA AIRCRAFT GALLEY MARKET, BY APPLICATION, 2022-2032 ($MILLION)
    TABLE 79. REST OF ASIA-PACIFIC AIRCRAFT GALLEY MARKET, BY GALLEY TYPE, 2022-2032 ($MILLION)
    TABLE 80. REST OF ASIA-PACIFIC AIRCRAFT GALLEY MARKET, BY FIT, 2022-2032 ($MILLION)
    TABLE 81. REST OF ASIA-PACIFIC AIRCRAFT GALLEY MARKET, BY GALLEY INSERT, 2022-2032 ($MILLION)
    TABLE 82. REST OF ASIA-PACIFIC AIRCRAFT GALLEY MARKET, BY APPLICATION, 2022-2032 ($MILLION)
    TABLE 83. LAMEA AIRCRAFT GALLEY MARKET, BY GALLEY TYPE, 2022-2032 ($MILLION)
    TABLE 84. LAMEA AIRCRAFT GALLEY MARKET, BY FIT, 2022-2032 ($MILLION)
    TABLE 85. LAMEA AIRCRAFT GALLEY MARKET, BY GALLEY INSERT, 2022-2032 ($MILLION)
    TABLE 86. LAMEA AIRCRAFT GALLEY MARKET, BY APPLICATION, 2022-2032 ($MILLION)
    TABLE 87. LAMEA AIRCRAFT GALLEY MARKET, BY COUNTRY, 2022-2032 ($MILLION)
    TABLE 88. LATIN AMERICA AIRCRAFT GALLEY MARKET, BY GALLEY TYPE, 2022-2032 ($MILLION)
    TABLE 89. LATIN AMERICA AIRCRAFT GALLEY MARKET, BY FIT, 2022-2032 ($MILLION)
    TABLE 90. LATIN AMERICA AIRCRAFT GALLEY MARKET, BY GALLEY INSERT, 2022-2032 ($MILLION)
    TABLE 91. LATIN AMERICA AIRCRAFT GALLEY MARKET, BY APPLICATION, 2022-2032 ($MILLION)
    TABLE 92. MIDDLE EAST AIRCRAFT GALLEY MARKET, BY GALLEY TYPE, 2022-2032 ($MILLION)
    TABLE 93. MIDDLE EAST AIRCRAFT GALLEY MARKET, BY FIT, 2022-2032 ($MILLION)
    TABLE 94. MIDDLE EAST AIRCRAFT GALLEY MARKET, BY GALLEY INSERT, 2022-2032 ($MILLION)
    TABLE 95. MIDDLE EAST AIRCRAFT GALLEY MARKET, BY APPLICATION, 2022-2032 ($MILLION)
    TABLE 96. AFRICA AIRCRAFT GALLEY MARKET, BY GALLEY TYPE, 2022-2032 ($MILLION)
    TABLE 97. AFRICA AIRCRAFT GALLEY MARKET, BY FIT, 2022-2032 ($MILLION)
    TABLE 98. AFRICA AIRCRAFT GALLEY MARKET, BY GALLEY INSERT, 2022-2032 ($MILLION)
    TABLE 99. AFRICA AIRCRAFT GALLEY MARKET, BY APPLICATION, 2022-2032 ($MILLION)
    TABLE 100. AEROLUX LTD: KEY EXECUTIVES
    TABLE 101. AEROLUX LTD: COMPANY SNAPSHOT
    TABLE 102. AEROLUX LTD: PRODUCT SEGMENTS
    TABLE 103. AEROLUX LTD: PRODUCT PORTFOLIO
    TABLE 104. AVIC CABIN SYSTEMS: KEY EXECUTIVES
    TABLE 105. AVIC CABIN SYSTEMS: COMPANY SNAPSHOT
    TABLE 106. AVIC CABIN SYSTEMS: PRODUCT SEGMENTS
    TABLE 107. AVIC CABIN SYSTEMS: PRODUCT PORTFOLIO
    TABLE 108. AVIC CABIN SYSTEMS: KEY STRATERGIES
    TABLE 109. BOEING: KEY EXECUTIVES
    TABLE 110. BOEING: COMPANY SNAPSHOT
    TABLE 111. BOEING: PRODUCT SEGMENTS
    TABLE 112. BOEING: PRODUCT PORTFOLIO
    TABLE 113. BUCHER GROUP: KEY EXECUTIVES
    TABLE 114. BUCHER GROUP: COMPANY SNAPSHOT
    TABLE 115. BUCHER GROUP: PRODUCT SEGMENTS
    TABLE 116. BUCHER GROUP: PRODUCT PORTFOLIO
    TABLE 117. BUCHER GROUP: KEY STRATERGIES
    TABLE 118. DIEHL STIFTUNG & CO. KG: KEY EXECUTIVES
    TABLE 119. DIEHL STIFTUNG & CO. KG: COMPANY SNAPSHOT
    TABLE 120. DIEHL STIFTUNG & CO. KG: PRODUCT SEGMENTS
    TABLE 121. DIEHL STIFTUNG & CO. KG: PRODUCT PORTFOLIO
    TABLE 122. DIEHL STIFTUNG & CO. KG: KEY STRATERGIES
    TABLE 123. DYNAMO AVIATION: KEY EXECUTIVES
    TABLE 124. DYNAMO AVIATION: COMPANY SNAPSHOT
    TABLE 125. DYNAMO AVIATION: PRODUCT SEGMENTS
    TABLE 126. DYNAMO AVIATION: PRODUCT PORTFOLIO
    TABLE 127. GAL AEROSPACE: KEY EXECUTIVES
    TABLE 128. GAL AEROSPACE: COMPANY SNAPSHOT
    TABLE 129. GAL AEROSPACE: PRODUCT SEGMENTS
    TABLE 130. GAL AEROSPACE: PRODUCT PORTFOLIO
    TABLE 131. JAMCO CORPORATION: KEY EXECUTIVES
    TABLE 132. JAMCO CORPORATION: COMPANY SNAPSHOT
    TABLE 133. JAMCO CORPORATION: PRODUCT SEGMENTS
    TABLE 134. JAMCO CORPORATION: PRODUCT PORTFOLIO
    TABLE 135. SAFRAN: KEY EXECUTIVES
    TABLE 136. SAFRAN: COMPANY SNAPSHOT
    TABLE 137. SAFRAN: PRODUCT SEGMENTS
    TABLE 138. SAFRAN: PRODUCT PORTFOLIO
    TABLE 139. SAFRAN: KEY STRATERGIES
    TABLE 140. RTX: KEY EXECUTIVES
    TABLE 141. RTX: COMPANY SNAPSHOT
    TABLE 142. RTX: PRODUCT SEGMENTS
    TABLE 143. RTX: PRODUCT PORTFOLIO
    TABLE 144. RTX: KEY STRATERGIES
  • LIST OF FIGURES

  • FIGURE 01. AIRCRAFT GALLEY MARKET, 2022-2032
    FIGURE 02. SEGMENTATION OF AIRCRAFT GALLEY MARKET,2022-2032
    FIGURE 03. TOP INVESTMENT POCKETS IN AIRCRAFT GALLEY MARKET (2023-2032)
    FIGURE 04. LOW BARGAINING POWER OF SUPPLIERS
    FIGURE 05. LOW THREAT OF NEW ENTRANTS
    FIGURE 06. LOW THREAT OF SUBSTITUTES
    FIGURE 07. LOW INTENSITY OF RIVALRY
    FIGURE 08. LOW BARGAINING POWER OF BUYERS
    FIGURE 09. GLOBAL AIRCRAFT GALLEY MARKET:DRIVERS, RESTRAINTS AND OPPORTUNITIES
    FIGURE 10. AIRCRAFT GALLEY MARKET, BY GALLEY TYPE, 2022(%)
    FIGURE 11. COMPARATIVE SHARE ANALYSIS OF AIRCRAFT GALLEY MARKET FOR STANDARD GALLEY, BY COUNTRY 2022 AND 2032(%)
    FIGURE 12. COMPARATIVE SHARE ANALYSIS OF AIRCRAFT GALLEY MARKET FOR MODULAR GALLEY, BY COUNTRY 2022 AND 2032(%)
    FIGURE 13. COMPARATIVE SHARE ANALYSIS OF AIRCRAFT GALLEY MARKET FOR CUSTOMIZED GALLEY, BY COUNTRY 2022 AND 2032(%)
    FIGURE 14. AIRCRAFT GALLEY MARKET, BY FIT, 2022(%)
    FIGURE 15. COMPARATIVE SHARE ANALYSIS OF AIRCRAFT GALLEY MARKET FOR LINE FIT, BY COUNTRY 2022 AND 2032(%)
    FIGURE 16. COMPARATIVE SHARE ANALYSIS OF AIRCRAFT GALLEY MARKET FOR RETRO FIT, BY COUNTRY 2022 AND 2032(%)
    FIGURE 17. AIRCRAFT GALLEY MARKET, BY GALLEY INSERT, 2022(%)
    FIGURE 18. COMPARATIVE SHARE ANALYSIS OF AIRCRAFT GALLEY MARKET FOR ELECTRICAL, BY COUNTRY 2022 AND 2032(%)
    FIGURE 19. COMPARATIVE SHARE ANALYSIS OF AIRCRAFT GALLEY MARKET FOR NON-ELECTRICAL, BY COUNTRY 2022 AND 2032(%)
    FIGURE 20. AIRCRAFT GALLEY MARKET, BY APPLICATION, 2022(%)
    FIGURE 21. COMPARATIVE SHARE ANALYSIS OF AIRCRAFT GALLEY MARKET FOR NARROW-BODY, BY COUNTRY 2022 AND 2032(%)
    FIGURE 22. COMPARATIVE SHARE ANALYSIS OF AIRCRAFT GALLEY MARKET FOR WIDE-BODY, BY COUNTRY 2022 AND 2032(%)
    FIGURE 23. COMPARATIVE SHARE ANALYSIS OF AIRCRAFT GALLEY MARKET FOR OTHERS, BY COUNTRY 2022 AND 2032(%)
    FIGURE 24. AIRCRAFT GALLEY MARKET BY REGION, 2022(%)
    FIGURE 25. U.S. AIRCRAFT GALLEY MARKET, 2022-2032 ($MILLION)
    FIGURE 26. CANADA AIRCRAFT GALLEY MARKET, 2022-2032 ($MILLION)
    FIGURE 27. MEXICO AIRCRAFT GALLEY MARKET, 2022-2032 ($MILLION)
    FIGURE 28. UK AIRCRAFT GALLEY MARKET, 2022-2032 ($MILLION)
    FIGURE 29. GERMANY AIRCRAFT GALLEY MARKET, 2022-2032 ($MILLION)
    FIGURE 30. SPAIN AIRCRAFT GALLEY MARKET, 2022-2032 ($MILLION)
    FIGURE 31. FRANCE AIRCRAFT GALLEY MARKET, 2022-2032 ($MILLION)
    FIGURE 32. REST OF EUROPE AIRCRAFT GALLEY MARKET, 2022-2032 ($MILLION)
    FIGURE 33. CHINA AIRCRAFT GALLEY MARKET, 2022-2032 ($MILLION)
    FIGURE 34. INDIA AIRCRAFT GALLEY MARKET, 2022-2032 ($MILLION)
    FIGURE 35. JAPAN AIRCRAFT GALLEY MARKET, 2022-2032 ($MILLION)
    FIGURE 36. SOUTH KOREA AIRCRAFT GALLEY MARKET, 2022-2032 ($MILLION)
    FIGURE 37. REST OF ASIA-PACIFIC AIRCRAFT GALLEY MARKET, 2022-2032 ($MILLION)
    FIGURE 38. LATIN AMERICA AIRCRAFT GALLEY MARKET, 2022-2032 ($MILLION)
    FIGURE 39. MIDDLE EAST AIRCRAFT GALLEY MARKET, 2022-2032 ($MILLION)
    FIGURE 40. AFRICA AIRCRAFT GALLEY MARKET, 2022-2032 ($MILLION)
    FIGURE 41. TOP WINNING STRATEGIES, BY YEAR (2020-2023)
    FIGURE 42. TOP WINNING STRATEGIES, BY DEVELOPMENT (2020-2023)
    FIGURE 43. TOP WINNING STRATEGIES, BY COMPANY (2020-2023)
    FIGURE 44. PRODUCT MAPPING OF TOP 10 PLAYERS
    FIGURE 45. COMPETITIVE DASHBOARD
    FIGURE 46. COMPETITIVE HEATMAP: AIRCRAFT GALLEY MARKET
    FIGURE 47. TOP PLAYER POSITIONING, 2022
    FIGURE 48. BOEING: RESEARCH & DEVELOPMENT EXPENDITURE, 2020-2022 ($MILLION)
    FIGURE 49. BOEING: NET REVENUE, 2020-2022 ($MILLION)
    FIGURE 50. BOEING: REVENUE SHARE BY SEGMENT, 2022 (%)
    FIGURE 51. BOEING: REVENUE SHARE BY REGION, 2021 (%)
    FIGURE 52. BUCHER GROUP: NET SALES, 2020-2022 ($MILLION)
    FIGURE 53. BUCHER GROUP: RESEARCH & DEVELOPMENT EXPENDITURE, 2020-2022 ($MILLION)
    FIGURE 54. BUCHER GROUP: REVENUE SHARE BY SEGMENT, 2022 (%)
    FIGURE 55. BUCHER GROUP: REVENUE SHARE BY REGION, 2022 (%)
    FIGURE 56. DIEHL STIFTUNG & CO. KG: RESEARCH & DEVELOPMENT EXPENDITURE, 2020-2022 ($MILLION)
    FIGURE 57. DIEHL STIFTUNG & CO. KG: NET SALES, 2020-2022 ($MILLION)
    FIGURE 58. DIEHL STIFTUNG & CO. KG: REVENUE SHARE BY SEGMENT, 2022 (%)
    FIGURE 59. DIEHL STIFTUNG & CO. KG: REVENUE SHARE BY REGION, 2022 (%)
    FIGURE 60. JAMCO CORPORATION: NET SALES, 2020-2022 ($MILLION)
    FIGURE 61. JAMCO CORPORATION: REVENUE SHARE BY SEGMENT, 2021 (%)
    FIGURE 62. SAFRAN: NET SALES, 2020-2022 ($MILLION)
    FIGURE 63. SAFRAN: RESEARCH & DEVELOPMENT EXPENDITURE, 2020-2022 ($MILLION)
    FIGURE 64. SAFRAN: REVENUE SHARE BY SEGMENT, 2022 (%)
    FIGURE 65. SAFRAN: REVENUE SHARE BY REGION, 2022 (%)
    FIGURE 66. RTX: NET SALES, 2020-2022 ($MILLION)
    FIGURE 67. RTX: RESEARCH & DEVELOPMENT EXPENDITURE, 2020-2022 ($MILLION)
    FIGURE 68. RTX: REVENUE SHARE BY SEGMENT, 2022 (%)
    FIGURE 69. RTX: REVENUE SHARE BY REGION, 2022 (%)


PURCHASE OPTIONS

Call or Email us

U.S.-Canada Toll-free: +1-800-792-5285
Int'l : +1-503-894-6022
Europe : +44-845-528-1300
Email : help@alliedmarketresearch.com
 
FREQUENTLY ASKED QUESTIONS?

A. The global aircraft galley market was valued at $2.4 billion in 2022, and is projected to reach $4.4 billion by 2032, growing at a CAGR of 6.5% from 2023 to 2032.

A. The top companies are Aerolux Ltd., AVIC Cabin Systems, Boeing, Bucher Group, Diehl Stiftung & Co. KG, Dynamo Aviation, GAL Aerospace Group, JAMCO Corporation, RTX and Safran.

A. North America is the largest regional market for Aircraft Galley market.

A. Modular Galley is the leading application of Aircraft Galley market.

A. Shift in preference to provide enhanced passenger comfort, growth in air passenger traffic, and growing refurbishment and renewal of old aircraft to extend aircraft life

Looking for Customization?

 Customization Request

Have a Question?

 Speak with Analyst

Any Confusion?

 Inquire Before Buying

Have a glance of the Report

  Request Sample
RELATED TAGS

Purchase Full Report of
Aircraft Galley Market

Start reading instantly.
This Report and over 67,404+ more Reports, Available with Avenue Library. T&C*.

  • Online Only
  • $3,570
  • Online cloud access only
  • Restricted print, copy, paste & download
  • Read only
  • Free industry update
    (Within 180 days)
  • Free report update in next update cycle
    (Aug 2024 - Aug 2025)
  • Data Pack
  • $3,840
  • Restricted to one authorized user
  • One print only
  • Available in
    Excel
  • Free industry update
    (Within 180 days)
  •   Free report update in next update cycle
    (Aug 2024 - Aug 2025)
  • Single User
  • $5,730
  • Restricted to one authorized user
  • One print only
  • Available in
    PDF
  • Free industry update
    (Within 180 days)
  •   Free report update in next update cycle
    (Aug 2024 - Aug 2025)
  • Five Users
  • $6,450
  • Limited to five authorized users
  • Print upto five copies
  • Available in
    PDF
  • Free industry update
    (Within 180 days)
  •   Free report update in next update cycle
    (Aug 2024 - Aug 2025)
  • Enterprise
    License/PDF

  • $9,600
  • Unlimited
    within
    company/enterprise
  • Available in Excel & PDF
  • Free industry update
    (Within 180 days)
  •   Free report update in next update cycle
    (Aug 2024 - Aug 2025)
  • Library
    Membership

  • $999 $ 1,175
    Per User/ Per month/ Billed annually
  • Published Content
    E-access
  • Company Profiles
    E-access
  • Newly Added Content Access
  • 10 PDF
    Downloads
  • 5 Excel Data
    Pack Downloads
  • 250 Company Profiles PDF Downloads
  • Buy Now

*Taxes/Fees, if applicable will be added during checkout. All prices in USD

RELATED REPORTS
 

Why Allied Market Research?


Infallible Methodology

To ensure high-level data integrity, accurate analysis, and impeccable forecasts

Analyst Support

For complete satisfaction

Customization

On-demand customization of scope of the report to exactly meet your needs

TARGETED MARKET VIEW

Targeted market view to provide pertinent information and save time of readers

Get fresh content delivered

Get insights on topics that are crucial for your business. Stay abreast of your interest areas.

Get Industry Data Alerts

Why Allied Market Research?

Infallible Methodology

To ensure high-level data integrity, accurate analysis, and impeccable forecasts

Analyst Support

For complete satisfaction

Customization

On-demand customization of scope of the report to exactly meet your needs

TARGETED MARKET VIEW

Targeted market view to provide pertinent information and save time of readers